Gold next week analysis Description
Whats up dear friends in the next week's gold analysis we can expect to a breakout in the zone which is 2175-2150 if there is no breakout then we go long till 2200 let's see have a great day and good luck
Goldtrend

The bearish stance on gold remains unchanged. We hold 2169 short
Gold is still volatile today. I placed a short order at 2169. In the short term at night, just continue to hold 2169 short. The stop loss remains unchanged at 2178. Wait for the decline. Let’s first look at the 2145 line.

Gold price rebounds to near the downtrend line, sell highThe price of gold fell yesterday and encountered the first-line support level of 2150. It rebounded in the short-term and rose, but the downward trend still did not break through. The short-term trend in one hour was bearish, and the upper pressure was around 2170. I am willing to sell within the day! Today the gold price will fall below the 2150 mark and head towards 2140 or even lower!
In general, it is still in the downward stage of shock. When it rebounds to near the trend line, it can be sold. The target can first see yesterday's support at 2050.
Good luck to everyone

Real-time gold trading analysis
Gold prices fell to $2,155 before bottoming out.
At this time, the one-year inflation rate forecast for the United States in March was released in the United States.
Predicted value 3.10%
Published value 3%
Preliminary value of the University of Michigan consumer confidence index in March
Predicted value 76.9
Published value 76.5
The data is very bullish for gold. As I said, there is strong support below gold, so it is a very wise choice to go long at low prices.
Now the gold price is supported below at $2,158, making it difficult to continue falling. It then turned to an upward trend, confirming my previous prediction.
Therefore, I prefer to go long at the low price of around $2160.
I will share trading strategies and trading ideas every day. Follow me in the channel at the bottom of the article to get detailed trading signals. I hope that with my help, everyone can make huge profits!

Friday of volatility! Gold adjusted DOWN⭐️ Smart investment, Strong finance
⭐️ GOLDEN INFORMATION:
The price of gold (XAU/USD) faced renewed selling pressure on Thursday and declined closer to the weekly low in response to the US Producer Price Index (PPI), which was higher than expected. This data indicated persistent inflation and dampened market expectations for early interest rate cuts by the Federal Reserve (Fed). As a result, US Treasury bond yields rose, boosting the US Dollar (USD) and prompting investors to move away from gold, which does not generate interest.
However, the markets still believe there is a higher likelihood that the US central bank will begin cutting interest rates in June. This, combined with a risk-off sentiment, helped attract some buyers for gold before it reached the $2,150 level, leading to a slight positive bias during the Asian session on Friday. Nevertheless, the XAU/USD remains within a familiar range as traders await more clarity regarding the Fed's stance on rate cuts before making any significant moves. Consequently, all eyes are on the upcoming FOMC meeting next week.
⭐️ Personal comments NOVA:
Positive data for the dollar this week, caused Gold to correct DOWN. In line with the technical chart, Gold prices continue to decline
⭐️ SET UP GOLD PRICE:
🔥BUY GOLD zone: $2137 - $2135 SL $2130
TP1: $2145
TP2: $2152
TP3: $2160
🔥SELL GOLD zone: $2170 - $2172 SL $2176
TP1: $2164
TP2: $2155
TP3: $2146
🔥SELL GOLD zone: $2188 - $2190 SL $2195
TP1: $2180
TP2: $2170
TP3: $2160
⭐️ Technical analysis:
Based on technical indicators EMA 34, EMA89 and support resistance areas to set up a reasonable SELL order.
⭐️ NOTE:
Note: Nova wishes traders to manage their capital well
- take the number of lots that match your capital
- Takeprofit equal to 4-6% of capital account
- Stoplose equal to 2-3% of capital account
- The winner is the one who sticks with the market the longest

Today's gold trading analysis
The price of gold fell to around US$2,154 yesterday and was supported by the bottom, and then rose to around US$2,160, showing a volatile trend.
Today, the price of gold is under pressure from above around $2,170, showing a volatile trend.
It should be noted that the price of gold today is above US$2,170 and is above US$2,180.
What you need to pay attention to is whether the gold price can break through when it reaches the $2,180 line.
At the bottom, we need to pay attention to the position of $2153-2150.
Therefore, I think a safer trade is to wait for the gold price to encounter resistance from above, then it would be a better choice to go short at a high price, or to go long at a low price.
My suggestion is to go short between the high price of $2176-2179.
If the price of gold falls to fluctuate around 2160, go long at a low price.
I will share trading strategies and trading ideas every day. Follow me in the channel at the bottom of the article to get detailed trading signals. I hope that with my help, everyone can make huge profits!

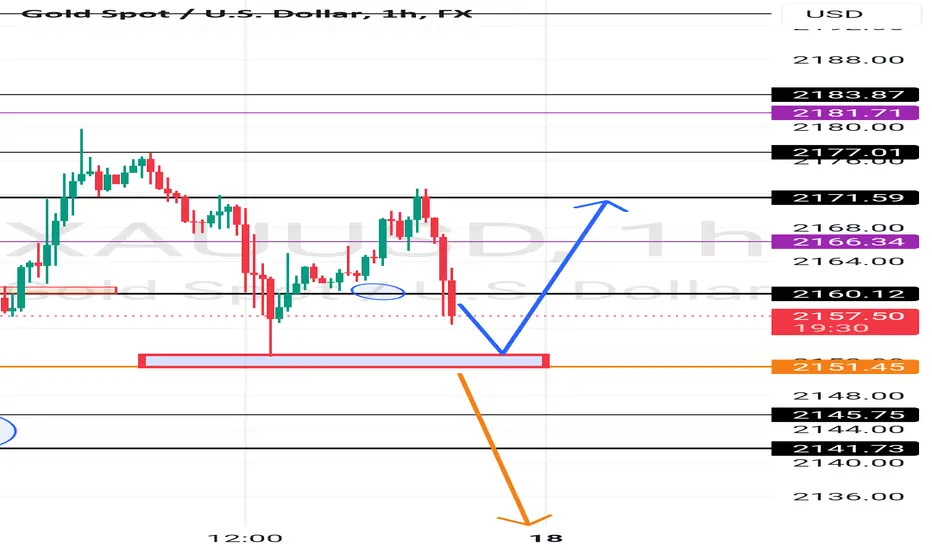
GOLD . where is next support of gold??#GOLD... well guys market very well hold your upside area 2172 73 as we discussed in our perveious idea.
Now we have one n only supporting area that is 2151
Keep close it because it only hope for buyers now .
2151
Good luck
Trade wisely
Gold 2169 continues to be short, let’s look at 2145 first
Don’t be afraid of gold’s rebound. The rebound is for better short positions. Hold the 2180 line. We firmly watch the decline.
The four-hour line is still close to the moving average. The high point is still lowering. The slope is obviously downward. At the same time, the moving average has obviously turned downward. We need to be patient and wait for the market to adjust. Let’s continue to look at the 2145 line.
Trading strategy: short gold 2169, stop loss 2178, target 2100, 2145

GOLD.. at his today resistance? will hold it? or not?#GOLD... market very well holding your area 2160 as we discussed in our video analysis, now market have 2173 as today most important resistance area,
keep close it because next further buying move will start above that area otherwise not at all.
if market hold it then drop expected from here.
good luck
trade wisely

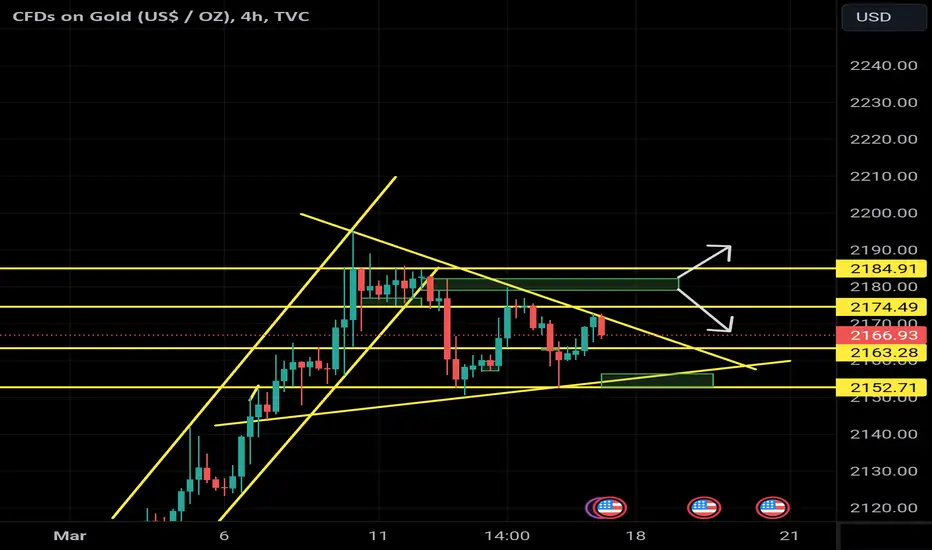
Out look on gold. Gold prices surged in the latest week's trading, driven by a weakening US dollar index and declining US bond yields. Analyzing the 4-hour timeframe reveals a flag pattern formation, reminiscent of one identified in Bitcoin on March 3rd prior to its all-time highs. Currently, gold is consolidating between 2174 and 2153, presenting an opportunity for a breakout in either direction. However, there's a long-term bullish outlook on gold, with a personal inclination towards buying around 2152, targeting the flag trendline and underlying support. The initial take profit (TP) is set at 2174, with the necessity for a sustained break and stability above this level to indicate further upward momentum. Given the flag pattern's characteristics, it's speculated that gold's peak has yet to be reached.
GOLD.. just below his major resistance? Next?#GOLD... Well guys market from last some sessions trade in range.
Now we have 2165 to 2167 region as major resistance area in current scnerio,
Keep close it guys because if market hold that region in that case you can see again upside move otherwise not at all.
If market hold it then a drop expected towards downside supporting areas.
Good luck
Trade wisely

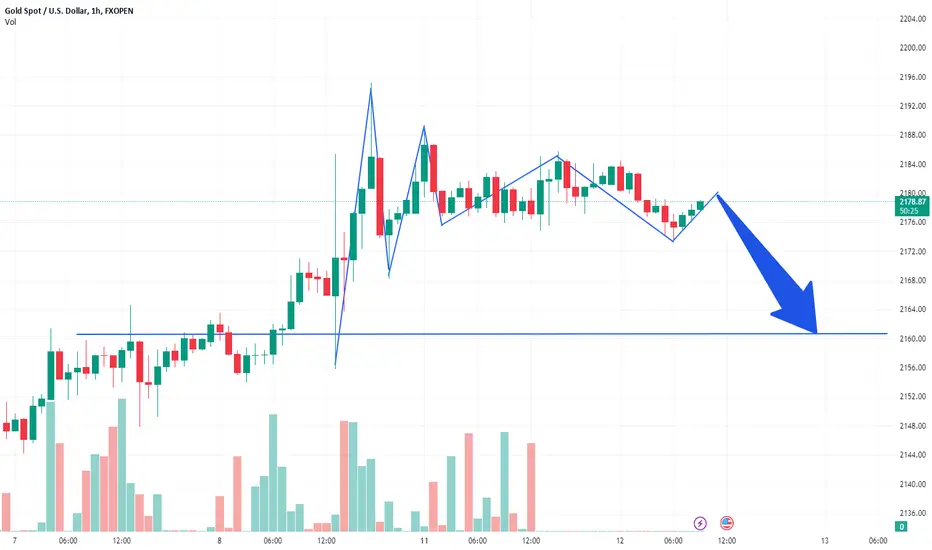
XAUUSD: 11/3 Today’s Market Analysis and StrategyGold maintained its rebound on Monday, with gold prices currently sitting around $2,180. Gold gained bullish momentum last week, hitting a new all-time high above $2,190, driven by falling U.S. Treasury yields and broad-based selling pressure in the U.S. dollar. Spot gold remains technically overbought ahead of key U.S. inflation data this week.
Data on rising U.S. unemployment has boosted expectations that the Federal Reserve may soon begin cutting interest rates. The dollar index fell 1.1% last week, hitting its lowest level since January 15 at 102.32, making gold cheaper for overseas buyers, while 10-year U.S. Treasury yields fell to more than a month low.
Starting last Tuesday, gold started a streak of record-setting trends, surpassing its December peak, mainly due to growing signs that price pressures are cooling down, as well as gold's traditional safe-haven appeal. In addition, central banks of various countries continue to rapidly increase their gold holdings, which also provides support for gold prices. Overall, the outlook for gold remains generally bullish, driven by a combination of expected lower interest rates, a weaker U.S. dollar and continued demand as a safe-haven asset.
Looking ahead to the week ahead, the biggest event risk for gold is the U.S. Consumer Price Index (CPI) report for February, which could create some selling pressure on the precious metal if inflation is higher than expected. Gold is overbought in the short term, but long-term returns suggest there is more room for gold prices to rise.
Gold technical analysis
Daily resistance is 2200, support below is 2150-24
Four-hour resistance is 2200, support below is 2167-53
Gold operation suggestions:
Gold has been super strong recently, with the highest reaching the 2195 line, and the weekly closing of the positive line. The bulls not only set a new historical high, but also set the largest unilateral increase in a single week in recent years. There is no doubt about the bullish trend. This week's major trend We continue to be bullish, but Friday's big pullback shows that the bulls have begun their final struggle. There is no unilateral rise, and there are still short-term opportunities for decline.
Today, the short-term support at the bottom will focus on the four-hour 2167 area. During the day, the support will rely on this position to continue to be bullish. The short-term pressure at the top is in the 2190-95 area.
BUY:2165~2070
BUY:2147~2054
SELL:2194~2200

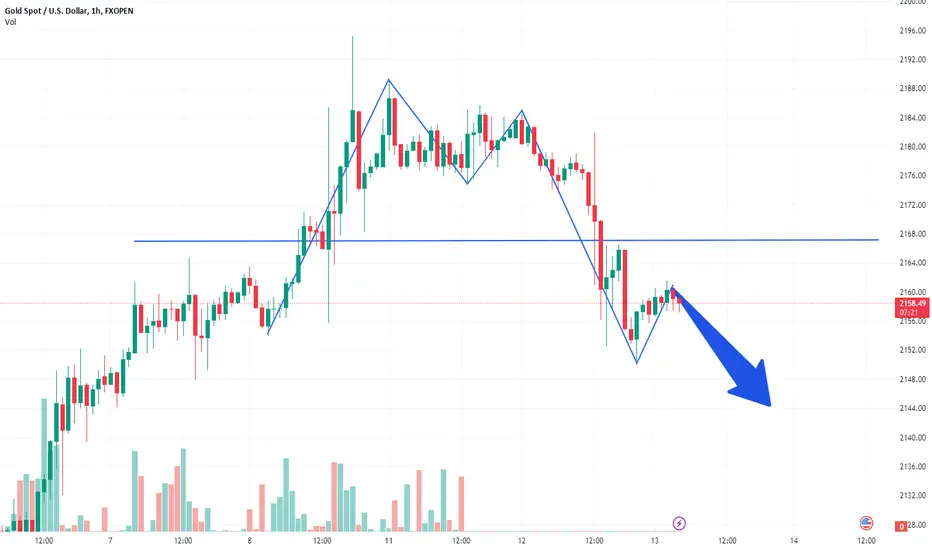
XAUUSD: 3/13 Today’s Analysis and StrategyGold fluctuated within a narrow range on Wednesday and is currently around 2159. The price of gold fell back nearly $30 on Tuesday, once touching 2150, a drop of more than 1%. The U.S. inflation report dimmed the prospect of an imminent interest rate cut by the Federal Reserve. The price of gold plummeted by nearly $25. The U.S. dollar index edged higher after a shock on Tuesday.
A red-hot U.S. inflation report dimmed prospects for a Fed rate cut soon! U.S. inflation data was hotter than expected, but not extreme. This led traders to still believe that June is the most likely time for the Federal Reserve to start cutting interest rates. The U.S. dollar recovered slightly, causing the price of gold in U.S. dollars to fall by more than 1%.
U.S. consumer prices rose sharply in February amid rising gasoline and housing costs, suggesting that inflation is somewhat sticky and further reducing the likelihood that the Federal Reserve will cut interest rates before June. Although the U.S. Labor Department's inflation reading on Tuesday rose for a second straight month, the composition of the report remained consistent with a trend of slowing inflation. Inflation-weary Americans are getting some relief from grocery store and medical bills.
Gold technical analysis
Daily resistance is 2184, support below is 2150-24
Four-hour resistance is 2200, support below is 2167-53
✅Gold operation suggestions:
Affected by the CPI data on Tuesday night, gold experienced a rapid decline like a roller coaster, and then suddenly rose. The highest continued to reach the 2183 line and began to fall back. We also gave a long suggestion of 2151-56.
Gold ushered in a daily level adjustment after the non-farm payrolls hit a high of 2195 last Friday.
From the daily analysis, today’s lower support focuses on the early 4-hour long-short conversion level near 2150. The upper pressure first looks at around 2166-70. The short-term bull strong dividing line is 2184. The key lower support during the day focuses on around 2150.
BUY: 2147~53
BUY: 2165~70
Technical analysis only provides trading direction!

Real time gold analysis
According to the current trend of gold, the price of gold has now dropped to $2158. Pay attention to my signals at any time to make the right choice from it.
Gold price predicted to rise
It is recommended to go long in the short term: go long around $2160
I will share trading strategies and trading ideas every day. Follow me in the channel at the bottom of the article to get detailed trading signals. I hope that with my help, everyone can make huge profits!
short gold 2179, stop loss 2190, target 2165
Gold has experienced stagflation in the short term. The K-line is about to fall back. Look at the 2165 line.
The golden four-hour line has always been rising at a high level, but it has continued to fail to break out of 2200 points, which shows that the market has strong resistance at this position, and the K-line deviates far from the moving average, and the K-line is bound to return to the moving average. We are looking at a pullback in the short term and are ready for 2165 first line
Trading strategy: short gold 2179, stop loss 2190, target 2165

Gold 2185 and 2183 are short, falling to around 2173 as expected
We were short on gold overnight at 2183 again. At the same time, we were also short on the current price of 2185 in early trading. The big negative line reached the 2174 line as scheduled, realizing the harvest of short orders.
At present, the K-line has peaked in the short term, and there is a bearish engulfment. The big Yin line entity directly covers the Yang line, and the moving average has made an obvious U-turn and bent downward. The big Yin line has also broken through the moving average as expected. Various forms are also bearish. , the upper shadow line has been closed frequently, continue to look at the 2160 line
Today’s latest gold strategy analysis, the current price is dire
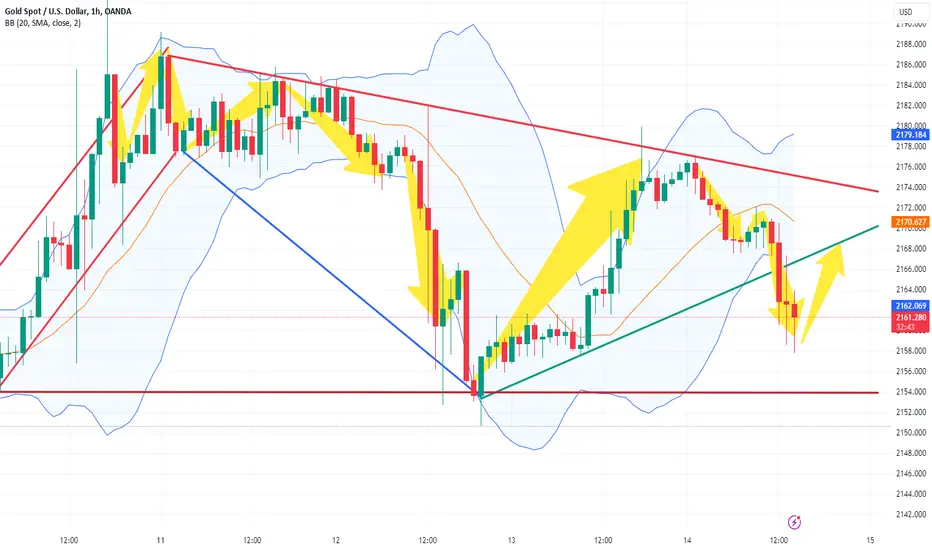
Gold was in a deep V yesterday, and gold bulls continued to exert their strength. The single negative drop in gold was just a correction on the way to gold's rise. Gold was still a bullish trend. Gold was directly bullish at 2171 in early trading!
Gold continued its upward trend in the 1 hour. The upward trend line support moved up to around 2169, and the gold moving average support was also near 2170. Gold pulled back in early trading and now stopped falling near the moving average support. Gold increased first.
The market is changing rapidly, and the market is all current. Gold bulls continued to exert force yesterday, so the previous decline in gold was just a correction, and the squat was just to rise higher. Gold bulls will continue.

Gold cannot fall at all, and the bulls will fight to the end.Gold can't go down at all. What is a bull market? This is a bull market. Money can't buy a bull back. Gold bulls have been going all the way and are unstoppable. In the current market, waiting for a fall has become a luxury, so just do it. The current price of gold 2156 just do more.
The gold 30-minute bottom has reached the 2153 line today. Today, 2153 is an opportunity to go long on dips. The gold 30-minute is now oscillating within a narrow range and then gaining momentum. If it breaks through a new high, it will be another fierce battle. Pulling up, gold bulls can’t stop the rise now, 2 targets 2200
Going with the trend is light and fluttering, but going against the trend is chaotic. Gold is too strong, so don’t guess the top. Now the top of gold is empty and there is no resistance. Where is the top? No one knows, so just continue to follow the trend, don’t give up on the rise, and continue to be bullish until the end.

Gold continues to go down, entry sell todayWorld gold prices decreased slightly with spot gold down 12.1 USD to 2,161.4 USD/ounce. Gold futures last traded at 2,166.5 USD/ounce, down 14.3 USD compared to yesterday morning.
World yellow metal prices reversed and decreased slightly in the trading session on March 14 (US time) when the market received more inflation data that was not as expected. The latest report showed that inflation in the US increased slightly higher than expected, helping the US Dollar Index recover and US Treasury bond yields increase.
Accordingly, the producer price index (PPI) increased by 0.6% in February, double the forecast increase of 0.3% over the previous month and the increase of 0.3% in the January report. Previous Meanwhile, in the middle of this week, another report showed that the consumer price index (CPI) increased by 3.2% over the same period last year, higher than experts' forecast of an increase of 3.1%. The core CPI in February increased by 3.8% compared to the expected increase of 3.7%. CPI and PPI data both increased stronger than forecast, fading the prospect that the US Federal Reserve (Fed) will soon cut interest rates.
Technically, April gold futures speculators have a solid overall near-term technical advantage. A four-week steep uptrend is underway on the daily bar chart. The bulls' next upside price objective is to produce a close above solid resistance at $2,203 an ounce. Bears' next near-term price objective is to push futures prices below solid technical support at $2,100 an ounce.

PPI - Continue to adjust DOWN XAU⭐️ Smart investment, Strong finance
⭐️ GOLDEN INFORMATION:
Traders may also be hesitant and inclined to wait on the sidelines prior to the commencement of the two-day FOMC monetary policy meeting, scheduled to begin next Tuesday. In the interim, the release of Thursday's US macroeconomic data, including the monthly Retail Sales, the Producer Price Index (PPI), and the customary Weekly Initial Jobless Claims, could potentially impact the dynamics of the USD price. These factors, along with US bond yields and overall market sentiment, may play a role in creating short-term trading prospects within the Gold price.
⭐️ Personal comments NOVA:
Continuing to expect a correction from Gold, US economic data this week is assessed optimistically
Need price range of $2100 for Gold to accumulate more buying power
⭐️ SET UP GOLD PRICE:
🔥BUY GOLD zone: $2146 - $2144 SL $2140
TP1: $2150
TP2: $2155
TP3: $2160
🔥BUY GOLD zone: $2136 - $2134 SL $2130
TP1: $2145
TP2: $2152
TP3: $2160
🔥SELL GOLD zone: $2198 - $2200 SL $2205
TP1: $2180
TP2: $2165
TP3: $2150
⭐️ Technical analysis:
Based on technical indicators EMA 34, EMA89 and support resistance areas to set up a reasonable SELL order.
⭐️ NOTE:
Note: Nova wishes traders to manage their capital well
- take the number of lots that match your capital
- Takeprofit equal to 4-6% of capital account
- Stoplose equal to 2-3% of capital account
- The winner is the one who sticks with the market the longest

Today's gold price analysis
The price of gold fluctuated after falling to around US$2,158 yesterday, and then fell when it rose to around US$2,179 and then fell under resistance from above. This is consistent with my prediction and analysis yesterday.
Today's gold price is under support at $2168 and has a tendency to bottom out, but there will also be resistance from above. Therefore, I think a safer trade is to wait for the gold price to receive resistance from above, and then shorting at a high price would be a better choice.
What needs to be noted is whether the gold price can break through when it reaches the $2,180 line.
If it fails to continue rising, my suggestion is to go short between the high price of $2176-2178.
I will share trading strategies and trading ideas every day. Follow me in the channel at the bottom of the article to get detailed trading signals. I hope that with my help, everyone can make huge profits!

The current price of gold is 2158, which is directly short!
At the beginning of this week for gold, we reminded the gold bulls to come to an end and beware of rising prices and falling back. Gold has been high and short for the past two days. Gold has plummeted. The trend has changed. Gold continues to be short. The current price of gold is 2158. It is directly short!
Gold's 1-hour moving average has turned and both have been broken. If the gold moving average forms a dead cross downward, then gold shorts will have more room. This is just the beginning. Gold rebounded as high as 2166 last night, and now the moving average The resistance is also near 2167. The rebound is an opportunity to go short. The current price of 2158 can be used to go short first.
If you go in the wrong direction, your efforts will be in vain. If you go in the right direction, you will get twice the result with half the effort; once the trend changes, we will always make a U-turn in time and go with the trend; we must know that the market is always right, it depends on how we grasp it. Don't make a desperate move against the trend, otherwise the market will eventually teach you a lesson. Now that gold has begun to enter a short trend, continue the short position to the end.
Last week, gold was over 2156 and 2169, and everyone took profit
OANDA:XAUUSD
On Friday, before the non-agricultural data, our big positive line just fell back to 2157, and then directly pulled up to the 2182 line. This long order was naturally a stop profit and left the market. Then the K line fell deeply back to the 2169 line, and we entered the market directly again. Many times, we just unplug the network cable, turn off the phone and go to sleep, but when we wake up in the morning, we continue to go directly to the front line. This is exciting, just lying down and making money.
We are also predicting to look at the 2200 line. We are looking at this target before non-agriculture. Although we have not reached it, we have reached the 2195 line at one time. It is so close and wirelessly approaching. Who else is there?
The golden four-hour line has almost not fallen back. It is all driven up by the big positive line. It is too strong and can block the rhythm of killing God. The fallback can still engulf the upward trend strongly. The K-line rises step by step, and the macd energy column continues to be at zero. above the axis, and it is still gradually rising, all the way north, continue to look at the 2200 line
