PPI - Continue to adjust DOWN XAU⭐️ Smart investment, Strong finance
⭐️ GOLDEN INFORMATION:
Traders may also be hesitant and inclined to wait on the sidelines prior to the commencement of the two-day FOMC monetary policy meeting, scheduled to begin next Tuesday. In the interim, the release of Thursday's US macroeconomic data, including the monthly Retail Sales, the Producer Price Index (PPI), and the customary Weekly Initial Jobless Claims, could potentially impact the dynamics of the USD price. These factors, along with US bond yields and overall market sentiment, may play a role in creating short-term trading prospects within the Gold price.
⭐️ Personal comments NOVA:
Continuing to expect a correction from Gold, US economic data this week is assessed optimistically
Need price range of $2100 for Gold to accumulate more buying power
⭐️ SET UP GOLD PRICE:
🔥BUY GOLD zone: $2146 - $2144 SL $2140
TP1: $2150
TP2: $2155
TP3: $2160
🔥BUY GOLD zone: $2136 - $2134 SL $2130
TP1: $2145
TP2: $2152
TP3: $2160
🔥SELL GOLD zone: $2198 - $2200 SL $2205
TP1: $2180
TP2: $2165
TP3: $2150
⭐️ Technical analysis:
Based on technical indicators EMA 34, EMA89 and support resistance areas to set up a reasonable SELL order.
⭐️ NOTE:
Note: Nova wishes traders to manage their capital well
- take the number of lots that match your capital
- Takeprofit equal to 4-6% of capital account
- Stoplose equal to 2-3% of capital account
- The winner is the one who sticks with the market the longest
Goldtrend

Today's gold price analysis
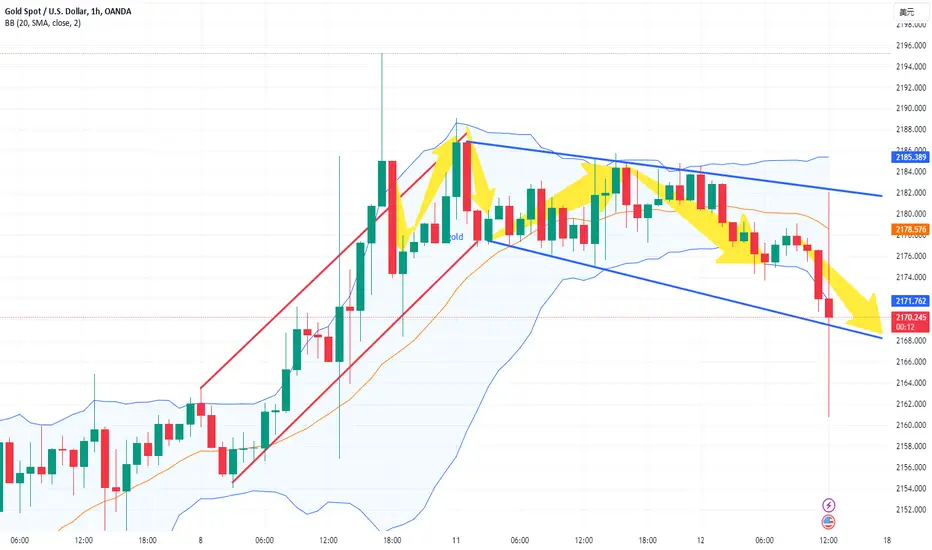
The price of gold fluctuated after falling to around US$2,158 yesterday, and then fell when it rose to around US$2,179 and then fell under resistance from above. This is consistent with my prediction and analysis yesterday.
Today's gold price is under support at $2168 and has a tendency to bottom out, but there will also be resistance from above. Therefore, I think a safer trade is to wait for the gold price to receive resistance from above, and then shorting at a high price would be a better choice.
What needs to be noted is whether the gold price can break through when it reaches the $2,180 line.
If it fails to continue rising, my suggestion is to go short between the high price of $2176-2178.
I will share trading strategies and trading ideas every day. Follow me in the channel at the bottom of the article to get detailed trading signals. I hope that with my help, everyone can make huge profits!

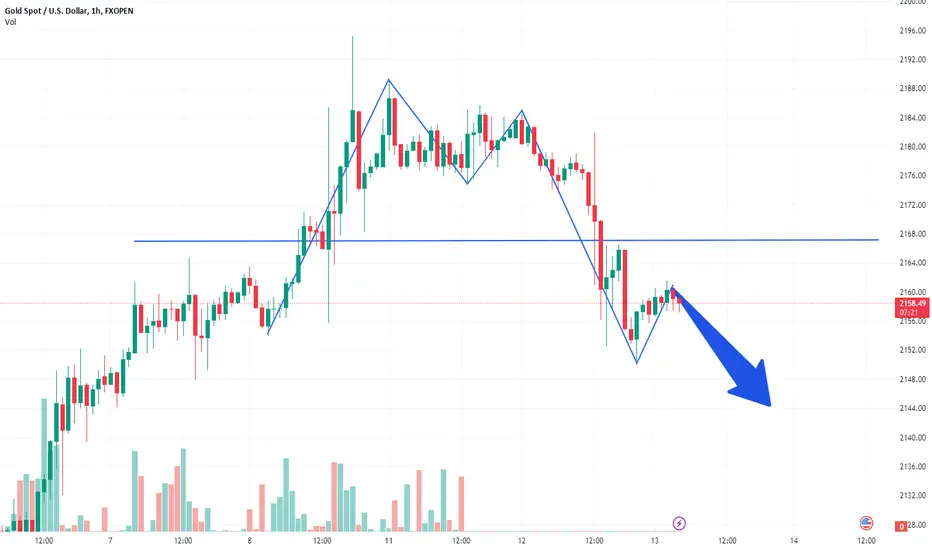
The current price of gold is 2158, which is directly short!
At the beginning of this week for gold, we reminded the gold bulls to come to an end and beware of rising prices and falling back. Gold has been high and short for the past two days. Gold has plummeted. The trend has changed. Gold continues to be short. The current price of gold is 2158. It is directly short!
Gold's 1-hour moving average has turned and both have been broken. If the gold moving average forms a dead cross downward, then gold shorts will have more room. This is just the beginning. Gold rebounded as high as 2166 last night, and now the moving average The resistance is also near 2167. The rebound is an opportunity to go short. The current price of 2158 can be used to go short first.
If you go in the wrong direction, your efforts will be in vain. If you go in the right direction, you will get twice the result with half the effort; once the trend changes, we will always make a U-turn in time and go with the trend; we must know that the market is always right, it depends on how we grasp it. Don't make a desperate move against the trend, otherwise the market will eventually teach you a lesson. Now that gold has begun to enter a short trend, continue the short position to the end.
Last week, gold was over 2156 and 2169, and everyone took profit
OANDA:XAUUSD
On Friday, before the non-agricultural data, our big positive line just fell back to 2157, and then directly pulled up to the 2182 line. This long order was naturally a stop profit and left the market. Then the K line fell deeply back to the 2169 line, and we entered the market directly again. Many times, we just unplug the network cable, turn off the phone and go to sleep, but when we wake up in the morning, we continue to go directly to the front line. This is exciting, just lying down and making money.
We are also predicting to look at the 2200 line. We are looking at this target before non-agriculture. Although we have not reached it, we have reached the 2195 line at one time. It is so close and wirelessly approaching. Who else is there?
The golden four-hour line has almost not fallen back. It is all driven up by the big positive line. It is too strong and can block the rhythm of killing God. The fallback can still engulf the upward trend strongly. The K-line rises step by step, and the macd energy column continues to be at zero. above the axis, and it is still gradually rising, all the way north, continue to look at the 2200 line

Gold prices may fall back today after rising higher
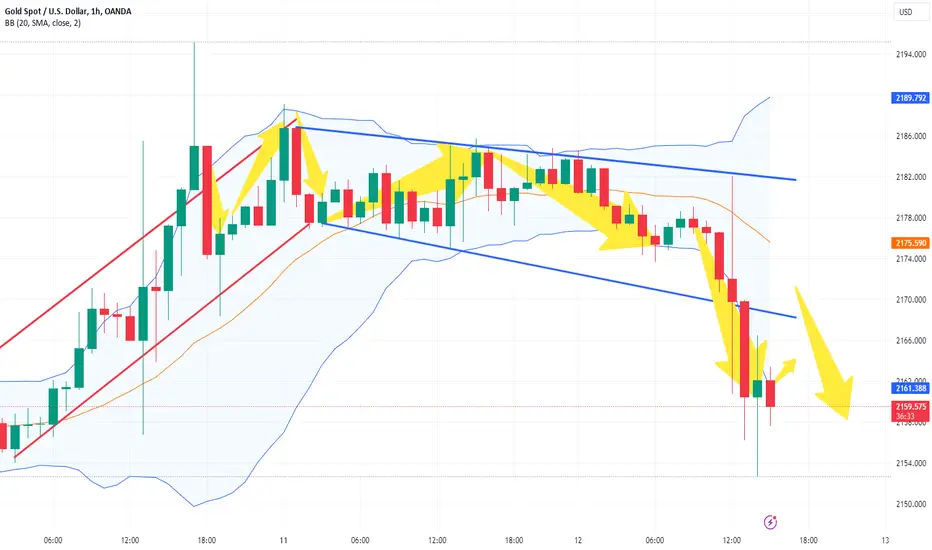
After bottoming out after falling to $2,150 yesterday, the price of gold was affected by the release of the monthly short-term energy outlook report by the U.S. EIA. The price of gold hit a maximum of $2,180 today, encountering resistance from above.
At this time, the 10-year Treasury bond bidding multiples and bidding interest rate data published in the United States on March 12 were very negative for gold. At this time, the price of gold encountered huge resistance from above around $2,180, and it was difficult to break through.
So I think gold prices will fall back when they reach the resistance level of $2,180 above.
Therefore, I recommend going short at $2177-2179.
I will share trading strategies and trading ideas every day. Follow me in the channel at the bottom of the article to get detailed trading signals. I hope that with my help, everyone can make huge profits!

Will gold continue to fall on March 14?
At the beginning of the Asian market on Thursday (March 14), gold fluctuated within a narrow range and is currently around $2,173.95 per ounce. Gold prices rose 0.75% on Wednesday to close at $2,174.15 an ounce, boosted by a weaker U.S. dollar as investors held out hope for a rate cut by the Federal Reserve in June despite sizzling U.S. inflation data, while escalating geopolitical tensions boosted safe-haven demand for gold. constant.
Gold prices found temporary support near $2,170 an ounce after falling sharply from a record high of $2,195 an ounce. "The current situation for gold bulls is a win-win, if the Fed cuts rates, gold prices will rise sharply, and if they don't, inflation concerns may push gold prices higher." Today's rise in gold indicates bargain hunting. At the same time, "the market has integrated the Russia-Ukraine crisis and the Palestinian-Israeli conflict into prices, and has been doing so for some time. Escalations or new developments will further support gold prices, which is important for paying attention to geopolitical risks."
OANDA:XAUUSD ACTIVTRADES:GOLD
Technical analysis:
Combined with BOLL observation. The K-line trends at the hourly level, four-hour level, and 24-hour level are all upward trends. And they are all within the ascending channel. So buying at low prices is still a good choice.
Personal suggestion: XAUUSD:2069-2072 buy .SL2060 .TP2085
Important note: It will be announced in 9 hours (the number of people filing for unemployment benefits in the United States in the week ending March 9 (in 10,000 people)
U.S. February retail sales monthly rate
U.S. February PPI annual rate
The impact of the U.S. PPI monthly rate in February).
MCX:GOLD1! VELOCITY:GOLD TVC:GOLD FXOPEN:XAUUSD
Highlights from yesterday.
TVC:DXY CAPITALCOM:GOLD NCDEX:GOLD
Personal operation is for reference only. If followed copy signal. Remember to continue to follow the author

Gold plummeted without stopping, selling trendWorld gold prices turned to inch up slightly with spot gold increasing by 15 USD to 2,173.5 USD/ounce. Gold futures last traded at 2,179.5 USD/ounce, up 13.4 USD compared to yesterday morning.
World yellow metal prices rebounded on Wednesday, supported by a weakening USD as investors remained hopeful the US Federal Reserve (Fed) would cut interest rates in June despite inflation. Inflation in the US increased. Meanwhile, escalating geopolitical tensions cause safe-haven demand for gold bars to remain.
After the recent recovery, experts are optimistic about the yellow metal.
On Tuesday, bullion retreated from a record high notched last week, posting its worst one-day decline since February 13 after a new report showed US consumer prices increased sharply in February, showing that inflation is still persistent.
Higher inflation data makes it difficult for the Fed to ease monetary policy and this will put pressure on non-interest-bearing assets such as gold.
Despite hotter-than-expected inflation data, traders continue to bet the Fed will cut interest rates in June. According to the CME FedWatch tool, the market is currently pricing in a roughly 65% chance The Fed will loosen monetary policy.

GOLD-CPI changes upward trend
U.S. consumer prices rose sharply in February, indicating that inflation is somewhat sticky. Data showed that the consumer price index (CPI) in February increased by 0.4% from the previous month and 3.2% from the same period last year, higher than the expected 3.1%. This further reduces the possibility of the Federal Reserve cutting interest rates before June. The market is now focused on the Federal Reserve interest rate decision on March 19. However, in this interest rate decision, the Fed is unlikely to cut interest rates. There is a high probability that the current interest rates will remain unchanged.
Yesterday, CPI changed the upward trend of gold. It can be seen that 2195 is the top of this cycle. Under the downward trend, gold can wait for the resistance point to sell.
The support of the 10-day moving average of the daily cycle is now 2135. On Wednesday, we need to observe Tuesday's low of 2150 and the strength of the support of 2135. In the H4 cycle, you need to wait for it to fall below 2150, pull the Bollinger Band open, and make it open, in order to confirm that gold has begun a downward trend.
If you don’t know how to trade, join me, learn with me, and improve the success rate of trading profits

XAUUSD:29/2 Today’s Analysis and StrategyOn Thursday, the U.S. dollar index gave up yesterday's gains at 103.93, but bulls continued to put pressure on gold ahead of the release of Personal Consumption Expenditures (PCE), and gold prices have yet to break out of range trading. The dovish Federal Reserve released a timetable for interest rate cuts, suggesting that interest rate cuts will begin in the second half of the year. The U.S. slightly revised down fourth-quarter economic growth, providing support for gold prices, but gains were limited as traders focused on key economic data and comments from Federal Reserve officials on the timetable for interest rate cuts.
This trading day will release the U.S. PCE data that the Federal Reserve focuses on in January. The market expects core PCE to increase by 0.4% month-on-month, compared with the previous value of 0.2%. Core PCE is expected to increase by 2.8% year-on-year, compared with the previous value of 2.9%. In addition, this trading day also Changes in the number of people filing for initial unemployment benefits in the United States will be released. The market expects it to be 210,000, compared with the previous value of 201,000. Investors need to pay attention to changes in market expectations for the Federal Reserve to cut interest rates.
Additionally, a fresh decline in U.S. Treasury yields prevented bearish traders from making big bets on gold prices and helped limit the downside. Compared with forecasts for a rate cut in March at the beginning of the year, recent Fed comments and hot inflation data have pushed bets on the Fed's first rate cut to June. Higher interest rates tend to dampen investment confidence in gold.
Gold technical aspect
Daily resistance 2037-40, lower support 2000-1966
Four-hour resistance 2037-40, lower support 2015
✅Gold operation suggestions:
Gold is constantly oscillating. Today, the upper resistance is around 2037-41. Relying on this position, continue to go short once. The lower support is around 2020. During the day, rely on this range to sell high and buy low. You can participate multiple times.
SELL:near 2041
SELL:near 2015
BUY:near 2000
Technical analysis only provides trading direction!

Continued DOWN correction for Gold !! Decrease⭐️ Smart investment, Strong finance
⭐️ GOLDEN INFORMATION:
Gold price (XAU/USD) attracts dip-buying in Asian session, reversing part of previous day's profit-taking slide to $2,150 area. US Treasury bond yields ticked higher after warmer than expected US consumer inflation for February, boosting the US Dollar (USD) and exerting downward pressure on gold. Bullish run in US equity markets also contributed to flow away from safe-haven precious metal.
⭐️ Personal comments NOVA:
After yesterday's CPI data, it is good for the Gold dollar to fall. In line with the DOWN adjustment, Gold prices continue to decline to create more liquidity and further accumulation
⭐️ SET UP GOLD PRICE:
🔥BUY GOLD zone: $2125 - $2127 SL $2120
TP1: $2135
TP2: $2148
TP3: $2155
🔥BUY GOLD zone: $2135 - $2133 SL $2130 scalping
TP1: $2140
TP2: $2148
TP3: $2155
🔥SELL GOLD zone: $2168 - $2170 SL $2175
TP1: $2160
TP2: $2150
TP3: $2140
⭐️ Technical analysis:
Based on technical indicators EMA 34, EMA89 and support resistance areas to set up a reasonable SELL order.
⭐️ NOTE:
Note: Nova wishes traders to manage their capital well
- take the number of lots that match your capital
- Takeprofit equal to 4-6% of capital account
- Stoplose equal to 2-3% of capital account
- The winner is the one who sticks with the market the longest

Gold is sold short term. A must see. Additional operating instru
CAPITALCOM:GOLD NCDEX:GOLD MCX:GOLD1! TVC:GOLD FXOPEN:XAUUSD TVC:DXY OANDA:XAUUSD ACTIVTRADES:GOLD VELOCITY:GOLD
It's time for the U.S. market to open. Review yesterday’s XAUUSD predictions and transactions. Completely suitable. There was no news support today, and gold had some slight rebound. But the market is currently relatively weak. I believe many people have seen that gold has been trading sideways at 2160 for a long time. It proves that the pressure above is still too high. When there is no influence of dominant news, then technical indicators can be used as a good reference. Combined with the hourly candle chart, a small pressure position is currently formed at 2165. Combined with the pressure brought by the track above the BOLL. The three tracks showed almost flat and normal fluctuations. So I think this position is a sell. Then the probability of making money is relatively high.
The operation is mainly selling gold.
2164-2167 are mainly selling. tp2154. sl2176
Personal operation is for reference only. If followed copy signal. Remember to stay tuned for verification.

Gold Wednesday Trading Strategy
With the release of cpi data, gold fell from 2185 to around 2150.
Tomorrow, gold will be supported at 2165-2168/2170-2174 above and 2145-2141/2132-2136 below. I think gold will break through above and then fall. We can rely on the upper pressure point to sell gold. Buy gold at the pressure point below.
sell 2165-2168/2170-2174
buy 2145-2141/2132-2136
Tomorrow I will give you more accurate trading signals based on specific trading trends. Please join to receive the latest updates

GOLD.. just below his today resistance?#GOLD.. well guys market very well placed 2151 in yesterday and that was our supporting area we we discussed .
Now we have 2160 to 2163 a resistance zone ..
If market told it the. You can see a drop and it will leads you towards downside further areas.
Good luck
Trade wisely

Gold fell again, selling trend todayAfter peaking at 1,282 USD/ounce, the world's gold price today, March 13, was sold very strongly when inflation in the US increased slightly and the USD increased in value compared to many other foreign currencies.
Gold prices reversed sharply today after the US announced data related to inflation that was slightly higher than forecast.
Specifically, the consumer price index (CPI) in February in the US increased by 3.2%, 0.1 percentage point higher than the market expectation of an increase of 3.1%.
CPI increased slightly, making investors worry that inflation in the US may heat up. This may cause the FED to maintain high interest rates for a long time. Accordingly, they increase their holdings of USD to help this currency increase in value. Gold price today is in a disadvantageous position.
On the other hand, US bond interest rates jumped from 4%/year to 4.14%/year, motivating many people to put capital into bonds. Meaning very little money flows into precious metals. Gold prices today are under more pressure to go down.

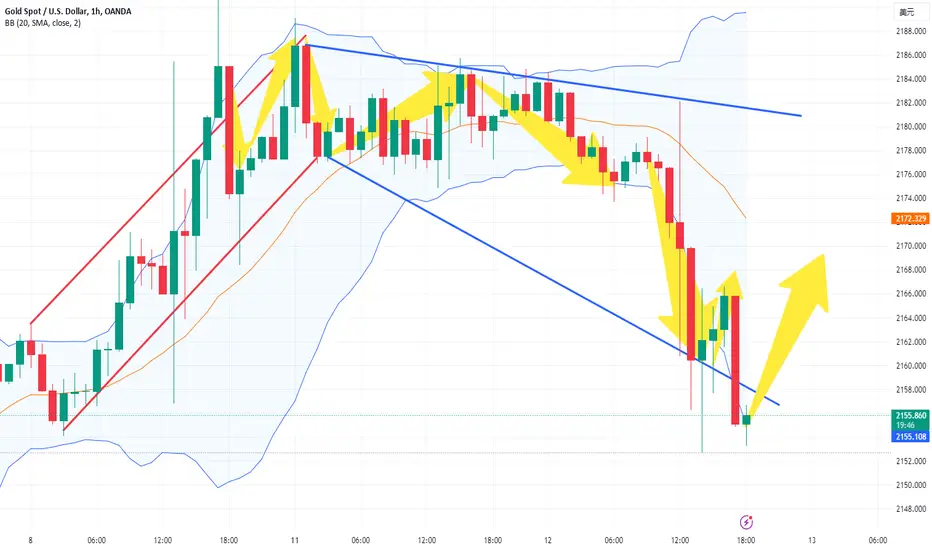
Gold prices will bottom out and rebound
According to the current gold trend, the gold price now forms a resistance level at 2154-2155. At this stage, the gold price reaches the bottom of 2154 and rebounds. Only by paying attention to my signals at any time can you make the right choice.
Gold price predicted to rise
It is recommended to go long in the short term: go long around $2155-2156
I will share trading strategies and trading ideas every day.
For those who want to make easy profits, follow me in the channel at the bottom of the article to get detailed trading signals. I hope that with my help, everyone can make huge profits!
Gold price - CPI waits for a DOWN adjustment⭐️ Smart investment, Strong finance
⭐️ GOLDEN INFORMATION:
Gold prices remained relatively unchanged towards the end of the North American session as traders prepared for the release of February's US Consumer Price Index (CPI) data. It is expected that the headline figures will remain unchanged, while core data is anticipated to cool down. This could put pressure on the US Dollar and provide a boost to XAU/USD. Currently, the price of Gold is trading at $2,180.60, showing minimal movement.
In the previous week, the price of Gold reached a record high of $2,195.15, just shy of breaking the $2,200 mark. This occurred after Jerome Powell, Chair of the US Federal Reserve (Fed), testified at the US Congress and acknowledged that inflation was decreasing. Powell mentioned that eventually, the Fed would begin to implement more accommodative policies, but stressed that the central bank's decisions are reliant on data. Despite expressing confidence that inflation is gradually decreasing, Powell emphasized that there is no urgency to lower borrowing costs.
⭐️ Personal comments NOVA:
US CPI data assesses the current level of inflation.
It's time for a DOWN adjustment to create liquidity for the market
⭐️ SET UP GOLD PRICE:
🔥BUY GOLD zone: $2135 - $2137 SL $2130
TP1: $2142
TP2: $2150
TP3: $2160
BREAK OUT price range:
SELL: $2175
BUY: $2185
🔥SELL GOLD zone: $2198 - $2200 SL $2205
TP1: $2190
TP2: $2175
TP3: $2160
⭐️ Technical analysis:
Based on technical indicators EMA 34, EMA89 and support resistance areas to set up a reasonable SELL order.
⭐️ NOTE:
Note: Nova wishes traders to manage their capital well
- take the number of lots that match your capital
- Takeprofit equal to 4-6% of capital account
- Stoplose equal to 2-3% of capital account
- The winner is the one who sticks with the market the longest

#GOLD.. now supporting area ? What's next? #GOLD.. well guys market very well hold your area 2181 as we discussed in our video analysis.
And now market have his immediate supporting area is 2151
Keep close that area because next move will start below 2151 .
Good luck
Trade wisely

GOLD-Analysis and Strategy
U.S. inflation may have only gradually weakened last month, with retail sales rebounding, which may lead to the Fed not being eager to lower interest rates. The core consumer price index, a measure that excludes food and fuel to better reflect underlying inflation, is expected to rise to 0.3% in February from 0.4% at the start of the year. The Labor Department will release its CPI report on Tuesday (March 12). The price index is expected to rise 3.7% from the same period last year, which would be the smallest annual increase since April 2021. Although the annual figure is well below the peak of 6.6% reached in 2022, the recent pace of progress has been modest. This is consistent with testimony before Congress last week from Fed Chairman Jerome Powell, who said that while a rate cut may be appropriate "sometime this year," he is not ready yet. The unseasonally adjusted CPI annual rate announced today is expected to remain unchanged at 3.1%, which may be negative for gold.
Gold has risen for 9 days in a row. Yesterday was the only time it did not break through the high point and has maintained a narrow range. Therefore, gold is choosing a direction. Today we need to see whether the US CPI data will change the direction in which gold has been rising.
The support point of the daily unilateral moving average is 2170, and then the focus is on the low of 2156 during the non-agricultural data. Only if it falls below this position can we continue to see the downside.
My suggestion is to wait for the CPI to be released, follow the trend, or observe whether it will break through the resistance range of 2190-2195.
If you don’t know how to trade, join me and improve your trading success rate

Shorting gold on rallies, circular operation
Gold briefly rose in early trading and fell back to around 2172. The rebound at 2186 last night has lost its strength. The short-term position of No. 4 and No. 5 is still under pressure (2188 and 2195). The downward support point focuses on around 2165. In the short term, you can go short around 2183.
gold:sell2183-2188
TP:2178-2175
SLl:2195
Gavin welcomes everyone here, I will prove myself, join me, and there will be more and more family members in the future

Gold trend analysis or bearish
Friends, under the influence of the negative CPI data, gold fell sharply as I expected, and once fell below the 2160 position. According to the current trend pattern, the gold pattern is developing in the short direction, while the bull pattern is no longer strong. Therefore, in this kind of market, we must pay special attention to the trading rhythm. Relatively speaking, I prefer to wait for gold to rebound to the 2170-2175 area before continuing to short gold.
I will share trading strategies and trading ideas every day. Listen to my signal and advocate seeking victory in stability and not making rash advances.
For those who want to make easy profits, follow me in the channel at the bottom of the article to get detailed trading signals. I hope that with my help, everyone can make huge profits!
GOLD- where is today support? whats next?#GOLD... market very well placed 2173 around low that was our area in our pervious idea,
keep close that area guys 2173 that will be your key level in today,
if market hold it then only that case you can expect again any kind of buying pressure from here, otherwise not..
only buying scenario expected above 2173 otherwise not at all..
good luck
trade wisely

XAUUSD (GOLD) I Let the price come down before going longWelcome back! Let me know your thoughts in the comments!
** GOLD Analysis - Listen to video!
We recommend that you keep this pair on your watchlist and enter when the entry criteria of your strategy is met.
Please support this idea with a LIKE and COMMENT if you find it useful and Click "Follow" on our profile if you'd like these trade ideas delivered straight to your email in the future.
Thanks for your continued support!

Gold analysis signals make you money easily
Hello friends!
According to the current gold trend, the gold price is now blocked at US$2182.0 and then falls. As far as the current trend is concerned, the gold price may fall at US$2160.0 as support. Pay attention to the gold price trend at any time to make the right choice.
I will share trading strategies and trading ideas every day. Listen to my signal and advocate seeking victory in stability and not making rash advances.
For those who want to make easy profits, follow me in the channel at the bottom of the article to get detailed trading signals. I hope that with my help, everyone can make huge profits!