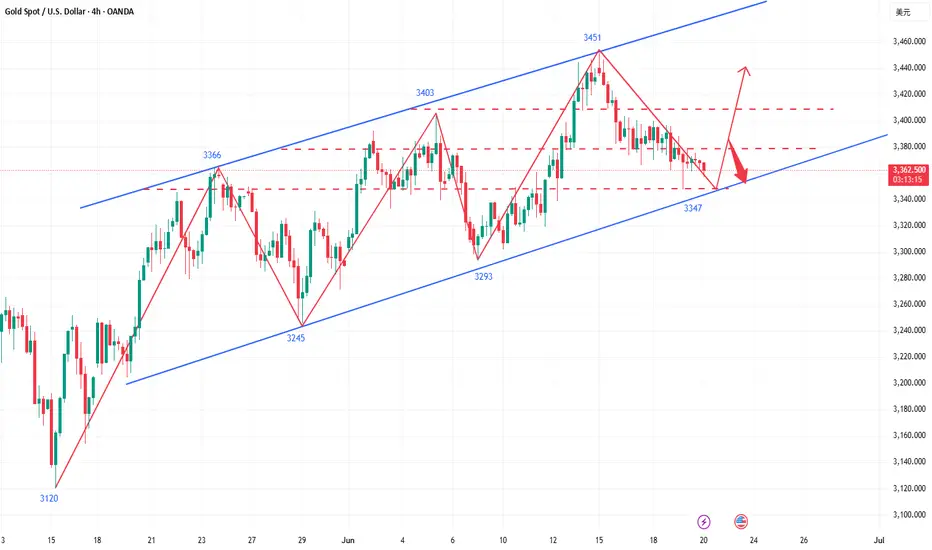
The bulls are not dead yet, it’s time to ambush at low levels!Gold only opened higher and rose on Monday this week, and then reached the highest level of 3452, and then started the road of shock and retracement this week. As of today, Friday, gold is still oscillating and adjusting in the lower range, but from the 4-hour market trend, the trend of gold is still dominated by bulls. In the short term, gold is oscillating and adjusting at a low level. Today, Friday, we will first focus on the support level of 3347-3353 below, which is also the starting point of the rebound yesterday. If this position is not broken today, Friday, we will mainly rebound and close.
From the 4-hour analysis, the support below focuses on 3347-3353, and the short-term resistance above focuses on the 3378-3385 level, with a focus on the 3408-3415 level. Continue to rely on this range to maintain the main tone of high-altitude low-multiple cycle participation unchanged, and the middle position is always more watchful and less active, cautiously chase orders, and patiently wait for key points to enter the market.
Gold operation strategy: Go long when gold falls back to 3347-3355, with a target of 3370-3380.
If you still lack direction in gold trading, you might as well try to follow my pace. The strategy is open and transparent, and the execution logic is clear and definite, which may bring new breakthroughs to your trading. The real value does not rely on verbal promises, but is verified by the market and time.
Goldtrend
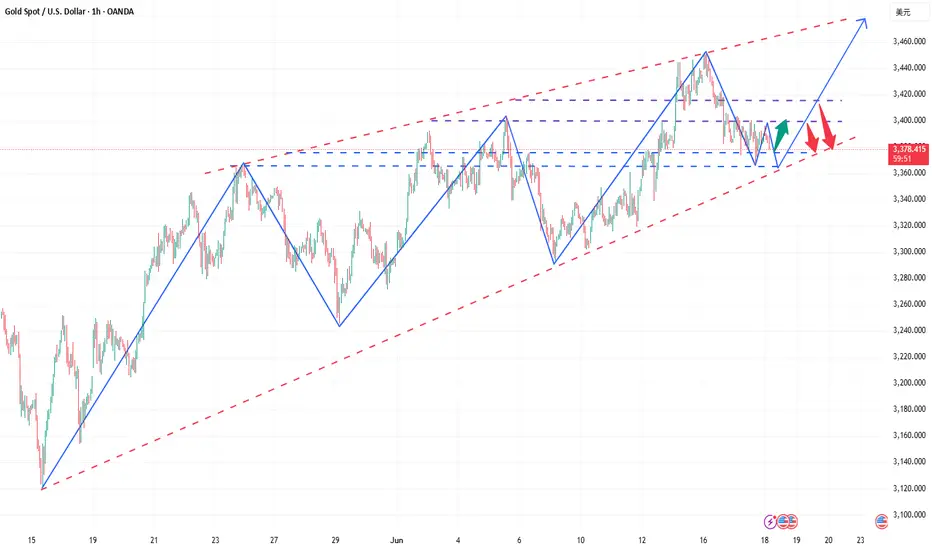
Gold continues to fluctuate, and range operations are effective!Gold opened high on Monday and then fell sharply. On Tuesday, it fluctuated and corrected with a cross-yang line. On Wednesday, the overall trend was also volatile. However, after the Fed's interest rate decision was announced on Wednesday, the price of gold fell to around 3362. The low point of this decline was just supported by the 10-day moving average. From a technical point of view, the support of the 10-day moving average at 3350 has become a key point. If this support can be effectively maintained, the gold price is expected to maintain a volatile pattern; once it breaks down, the short-selling force may continue, and then it will be necessary to look at the support of the 20-day moving average near 3350. In terms of upper resistance, the 5-day moving average is currently near 3390, which will suppress the upward movement of gold prices. Further resistance depends on the gains and losses of 3405.
There is not much change in the 4-hour chart. The lower track has not opened, and the support of 3360 is strong. It is still a bullish trend. However, it is worth noting that in the continuous rebound, the Bollinger middle track suppression point has not been broken. Relatively speaking, gold is weak and volatile in the medium term. Under the trend today, if it continues to rise, we must pay attention to the gains and losses of the dense suppression point 3405. If 3405 is broken, the trend strength will come out and we can see the high point of 3430. For intraday trading, we still maintain high-altitude and low-multiple, waiting for the trend strength to break through the space, and we are bullish above the support of 3350 during the day.
Gold operation strategy: It is recommended to short at the rebound of 3385-3390, with a target of 3370-3365; gold falls back to 3350-3355 and buys, with a target of 3375-3385;

Gold breaks down, short-term bears dominate the rhythmThe Fed's June resolution kept interest rates unchanged, but Powell's remarks (expected to slow down the pace of future rate cuts) suppressed gold prices, causing gold prices to fall from around $3,396 to $3,362; the rebound of the US dollar index put short-term pressure on gold, but gold rebounded slightly when the US dollar pulled back; the conflict between Iran and Israel continued to ferment, and the safe-haven demand partially supported the gold price, limiting the decline. After several days of volatility, gold opened slightly higher today and then fell sharply to $3,347.56 per ounce, breaking the unilateral decline in the volatile trend. The 4-hour moving average is in a short position, the Bollinger band is narrowing, and the gold price is running near the lower Bollinger band. Therefore, today's operation is to rebound and short.
Operational suggestions: Arrange short positions in batches in the 3370-3385 range, follow the trend, and control risks. Target 3350-3340.

Range oscillation, strategy remains unchanged!The Federal Reserve kept the interest rate unchanged. Gold did not break through the range we gave after all. The important support below is still at 3365-3360. Today, we continue to operate in the range and keep high and low as yesterday. Gold touched the lowest level of 3362 without breaking through, and still rebounded. The long orders of 3372 and 3363 that we arranged have successfully stopped profit at 3380, so we continue to operate in the range.
From the current analysis of gold trend, gold continues to focus on the important support of 3365-3360 below, and focuses on the short-term suppression of 3400-3415 above in the short term. The operation is mainly carried out in the range for the time being, and there is a high probability of continued volatility in the short term.
Gold operation strategy: Go long when gold falls back to 3375-3370, and cover long positions when it falls back to 3365-3360, with the target of 3380-3390-3400.

Once again, we seized a golden opportunityYesterday, gold fluctuated throughout the day and failed to break through the key range we pointed out. The current structure continues to fluctuate. During the day, we will continue to pay attention to the strong support of 3365-3360 below. This area is the key defensive position we emphasized yesterday. As long as this area is not broken, the bulls still have a chance to make a comeback. The long orders we arranged today at 3370-3375 have all been taken profit near 3387, and the short-term is perfectly realized! At present, 3400 above is the primary pressure position. We have also given a short order plan. We continue to hold it at present, and the target is to take profit when it falls back to 3380-3375.
The overall idea is to maintain the main long and auxiliary short rhythm. In terms of operation, the interval thinking is prioritized, and wait for the key points to be confirmed before taking action. If it breaks through, change the idea in time.
Operation suggestion: Gold falls back to 3375-3370 and goes long with a light position, and further falls back to 3365-3360 to cover the position. The target is 3380-3390-3400.
If you still lack direction in gold trading, you might as well try to follow my pace. The strategy is open and transparent, and the execution logic is clear and definite, which may bring new breakthroughs to your trading. The real value does not rely on verbal promises, but is verified by the market and time.

Golden opportunity comes again!Gold fluctuated all day yesterday, and finally did not break the range we gave. Today we continue to focus on the strong support range of 3365-3360, because this position is also the important key support we gave yesterday. Today we continue to look for opportunities to go long when we step back. As long as the strong support position below is not broken, there will be hope for the bulls to make a comeback.
From the current analysis of gold trends, gold continues to focus on the short-term support near 3375-3370 below, and the important support is around 3365-3360. The short-term focus is on the short-term suppression near 3400-3415 above. The operation is temporarily based on the range. There is a high probability that the short-term fluctuations will continue. Wait patiently for the key points to enter the market.
Gold operation strategy: Go long when gold steps back to 3375-3370, and cover long positions when it steps back to 3365-3360. The target is around 3380-3390-3400.
If you still lack direction in gold trading, you might as well try to follow my pace. The strategy is open and transparent, and the execution logic is clear and definite, which may bring new breakthroughs to your trading. The real value does not rely on verbal promises, but is verified by the market and time.
Have you caught up with this golden opportunity?The 4-hour K-line pattern of gold shows that the upward trend remains intact, focusing on the strong support range of 3360-3365 (technical resonance with the 5-week moving average). Before the price effectively breaks below the support band, the bulls still have upward momentum, otherwise the trend may reverse. The 3365-3400 range is maintained for intraday fluctuations. The gold operation strategy recommends arranging long orders in the 3370-3375 area when the price falls back, and adding positions to long positions if the support of 3360-3365 is broken.
Operation strategy: Gold recommends going long near 3370-3375 now, and adding positions to long positions in the support area of 3360-3365 when the price breaks, with the target of 3380-3390.
If you still lack direction in gold trading, you might as well try to follow my pace. The strategy is open and transparent, and the execution logic is clear and definite, which may bring new breakthroughs to your trading. The real value does not rely on verbal promises, but is verified by the market and time.

Have you seized the golden opportunity again and again?Today, the strength of gold is very weak. It only rushed up at the opening, and quickly fell below the 3400 mark. Keeping above the key point of 3400, gold continues to be bullish. Now that it has fallen below 3400, the short-term has gone out of the small-level top, and the market is no longer so strong. For our short-term operations, the short-term correction of gold prices focuses on the daily cycle MA5 support, and the weekly MA5 support is long. The rebound focuses on the 3403-3408 resistance card. The rebound can be followed by the short-term! Although gold has fallen below 3400, the short-term direction has changed, but the general direction has not changed. It is still bullish. In the future, we still have the opportunity to look at the high point of 3500, but we have to wait for the bottom to stabilize. Now we can only follow the trend. We will do what the market does.
From a technical point of view, the current macd high dead cross in 4 hours has a large volume, and the smart indicator sto is oversold, which represents the 4-hour shock trend. The current bollinger band three-track shrinkage in 4 hours also represents the range compression. At present, the upper pressure of 4 hours is located at the adhesion point of the middle rail and the moving average MA10 at 3404-3409, while the support corresponds to the moving average MA30 and MA10 near the 3380-3363 line. From the current 4 hours, if the price is to fall directly, the rebound will not exceed the 3420-3422.5 line. The current macd dead cross of the gold 1-hour line is shrinking and sticking, and the smart indicator sto is running downward, indicating that the hourly line continues to fluctuate weakly. What we need to pay attention to now is the adhesion pressure of the upper moving average MA60 and MA30 corresponding to the 3412 line. Pay attention to the resistance of 3403 in the short term. Today's short-term operation of gold recommends rebound shorting as the main, and callback long as the auxiliary, and pay attention to the support of 3380-3370 in the short term.

Continue to be bullish after successful adjustment of low longToday, gold opened high at 3448, and fell under pressure after touching 3452. It fell after repeatedly confirming resistance at high levels. We arranged short orders in the 3445-3450 area, successfully touched the target of 3330, and realized profit-taking. Then the market fell back to around 3409 and stabilized and rebounded. We arranged long orders and stopped profit at around 3420. Then we fell back and arranged long orders of 3385 and 3395 to take profits at 3405.
Overall, gold fell slowly after opening high, and maintained sideways consolidation in the European session. The US session continued to fall due to the easing of the geopolitical situation. At present, the focus of the evening is on the support of 3390. If it does not break after the retracement, it can still go long. Pay attention to the key pressure levels of 3410 and 3422 above. The current market is still in the adjustment stage of the upward trend. After the adjustment, it is expected to continue the upward rhythm.
Operation suggestion: Go long on gold when it falls back to around 3390-3392, with the target at 3410 and 3435.
If you still lack direction in gold trading, you might as well try to follow my pace. The strategy is open and transparent, and the execution logic is clear and definite, which may bring new breakthroughs to your trading. The real value does not rely on verbal promises, but is verified by the market and time.

Adjustments do not change the trend, continue to be bullishToday, gold opened high at 3448, and fell under pressure after reaching 3452. After repeatedly confirming resistance at high levels, it went down. We arranged short orders in the 3445-3450 area, successfully reached the target of 3330, and secured profits. Then the market fell back to around 3409 and stabilized and rebounded. We arranged long orders to stop profit near 3420. The current market is still in a bullish trend after the shock and retracement. Adjustment does not change the trend. Retracement is an opportunity. The key is to find the right entry point.
From a technical perspective, the support below focuses on the 3410-3405 area, and the key support is at 3400-3390. If the daily level stabilizes in the above area, the upward structure will continue, and the short-term is still expected to test the previous high. Short orders need to strictly control risks, and the trend of low and long is still the main theme.
Gold operation strategy: Buy gold when it falls back to around 3410-3405, and consider covering positions when it falls back to 3400-3395, with the target at 3430-3440.
For more real-time strategies, I will remind you at the key points as soon as possible,🌐 remember to pay attention!
If you still lack direction in gold trading, you might as well try to follow my pace. The strategy is open and transparent, and the execution logic is clear and definite, which may bring new breakthroughs to your trading. The real value does not rely on verbal promises, but is verified by the market and time.

Short positions fall as expected, long opportunities reappearToday, gold maintained high and fluctuated repeatedly after opening, but the upper side has not been effectively broken through. After repeated pressure, the resistance signal was confirmed. We arranged short orders near 3445. The market fell back as expected and accurately hit the target position. The trend was highly consistent with the prediction, which once again confirmed the trading concept of "planning before the market, execution before emotion".
From the current trend structure, gold is still in a bullish trend as a whole, and short-term adjustments are normal. The support below focuses on the 3420-3415 area, which is the first defense position for short-term retracement; and the more critical bullish defense line is still at the 3405-3400 line. If this area stabilizes, it is still our core layout area for low-multiples with the trend.
The daily structure is still intact, and the long arrangement of the moving average system has not been destroyed. Short-term fluctuations do not affect the overall bullish logic. Therefore, the operation is still based on retracement and main longs, and following the trend is the kingly way. Short orders can only be participated in the short term, and stop when you reach the point, and do not hold against the trend. I will remind you of the specific operation strategy at the bottom, and pay attention to it in time. The key next is to pay attention to the stabilization signals below and wait for the market to provide new opportunities for momentum release.
If you still lack direction in gold trading, you might as well try to follow my pace. The strategy is open and transparent, and the execution logic is clear and definite, which may bring new breakthroughs to your trading. The real value does not rely on verbal promises, but is verified by the market and time. 🌐

The golden opportunity comes again.This week, gold showed a slow bullish upward pattern, rising repeatedly and circuitously, and finally closed positive on the weekly line. On Friday, it was blocked twice at the high level of 3445, and the closing price remained sideways. The market is expected to continue the upward trend next week. If it breaks through 3445, it is expected to further challenge the 3500 mark or even set a new high. Combined with the recent fundamentals and the continued warming of the geopolitical situation, it provides solid support for bulls. However, the current market shock sweep is still the main rhythm, and it is not advisable to blindly chase highs in operation. It is still recommended to focus on retracement and long positions. The key support of the daily line refers to the top and bottom conversion position of 3403 and the low point of 3419 on Friday. If it falls back to the above area, you can rely on the support to arrange long positions at the right time. The overall trend is still inclined to bulls, and short positions can only be tried with a light position. Remember that strict risk control is required against the trend. I will remind you of the specific operation strategy at the bottom, and pay attention to it in time.
Operation suggestion: Gold is recommended to go long near 3405-3400, with the target looking at 3445 and 3465. If it is strong, rely on the support of 3420-3415 area and choose the opportunity to go long.
If you still lack direction in gold trading, you might as well try to follow my pace. The strategy is open and transparent, and the execution logic is clear and definite, which may bring new breakthroughs to your trading. The real value does not rely on verbal promises, but is verified by the market and time. 🌐

GOLD 1H CHART ROUTE MAP UPDATE & TRADING PLAN FOR THE WEEKHey Everyone,
Please see our updated 1h chart levels and targets for the coming week.
We are seeing price play between two weighted levels with a gap above at 3340 and a gap below at 3418. We will need to see ema5 cross and lock on either weighted level to determine the next range.
We will see levels tested side by side until one of the weighted levels break and lock to confirm direction for the next range.
We will keep the above in mind when taking buys from dips. Our updated levels and weighted levels will allow us to track the movement down and then catch bounces up.
We will continue to buy dips using our support levels taking 20 to 40 pips. As stated before each of our level structures give 20 to 40 pip bounces, which is enough for a nice entry and exit. If you back test the levels we shared every week for the past 24 months, you can see how effectively they were used to trade with or against short/mid term swings and trends.
The swing range give bigger bounces then our weighted levels that's the difference between weighted levels and swing ranges.
BULLISH TARGET
3340
EMA5 CROSS AND LOCK ABOVE 3340 WILL OPEN THE FOLLOWING BULLISH TARGETS
3463
EMA5 CROSS AND LOCK ABOVE 3463 WILL OPEN THE FOLLOWING BULLISH TARGET
3483
EMA5 CROSS AND LOCK ABOVE 3483 WILL OPEN THE FOLLOWING BULLISH TARGET
3508
BEARISH TARGETS
3418
EMA5 CROSS AND LOCK BELOW 3418 WILL OPEN THE FOLLOWING BEARISH TARGET
3393
EMA5 CROSS AND LOCK BELOW 3393 WILL OPEN THE SWING RANGE
3372
3353
EMA5 CROSS AND LOCK BELOW 3393 WILL OPEN THE SECONDARY SWING RANGE
3330
3306
As always, we will keep you all updated with regular updates throughout the week and how we manage the active ideas and setups. Thank you all for your likes, comments and follows, we really appreciate it!
Mr Gold
GoldViewFX

Bulls are in control, and pullbacks are opportunities!Gold rose directly at the opening today due to risk aversion, reaching a high of around 3446.8. We successfully stopped profit twice when we went long. Subsequently, we also notified everyone to enter short positions at 3445 and exit with profit at 3425. Pay attention to the support situation at 3395-3408. Going long on pullbacks is still the main trend at present.
From the current gold trend analysis, today's gold mid-line pulled up and broke through and stood above the 3400 mark to further continue its strength. The short-term support below is around 3310-3408, and the key support below is around the recent top and bottom conversion position of 3395-3405. The intraday pullback relies on this position to continue to be bullish and the short-term bullish dividing line moves up to 3345-3350. The daily level stabilizes above this position and continues to maintain the trend of low-long rhythm. Be cautious about short orders against the trend. I will give you tips on specific operations, and pay attention in time.
Gold operation strategy: Buy gold when it falls back to around 3395-3405, and target around 3425-3440. If it is strong, continue to buy gold at the support of 3410-3408.
When operating, be sure to strictly set stop loss, strictly control risks, and respond to market fluctuations steadily.

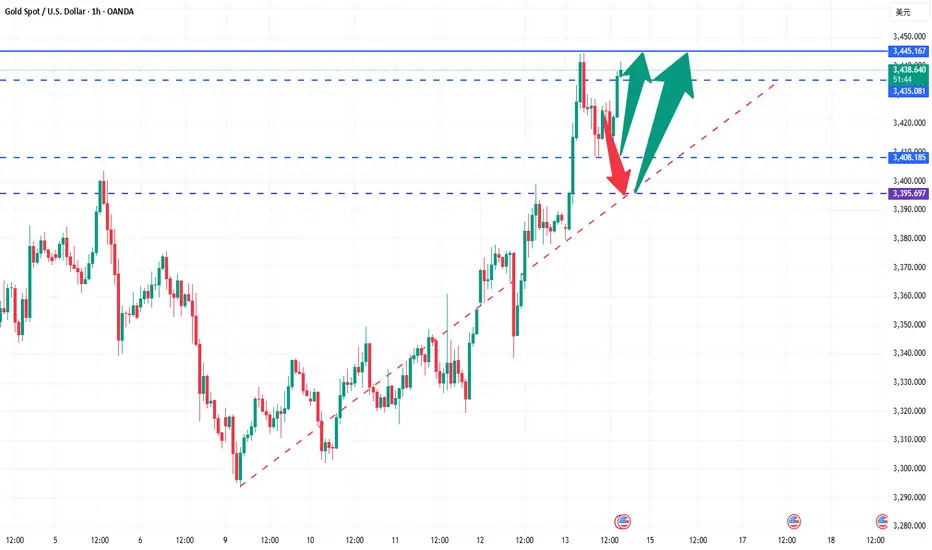
Hit the target with one strike! Gold perfectly cashed in 3435Gold closed sideways at a high level yesterday, and closed positive again overnight. It opened back to 3379 and pulled up strongly, breaking through the 3400 mark and then increasing in volume. The recent low-multiple bullish ideas have been realized. There is no doubt that it will continue to be bullish and long today. The market has turned from the previous sweeping upward to a strong unilateral trend. The upper side will first look at the previous high pressure of 3435. Continued breakthrough will further open up the upper space, or it will hit 3500 or even a new high again. The lower support focuses on the top and bottom conversion position of 3395-3405, and then pay attention to the 1H cycle support near 3410. The intraday operation is mainly long on the decline.
Operation suggestion: Go long on gold when it falls back to 3395-3345, and look at 3434 and 3450. If it is strong, continue to go long with the support of 3415-3410.
When operating, be sure to strictly set stop loss, strictly control risks, and respond to market fluctuations steadily.
The summit is just around the corner, just one final push away!Gold closed sideways at a high level yesterday, and closed positive again overnight. It opened back to 3379 and pulled up strongly, breaking through the 3400 mark and then increasing in volume. The recent low-multiple bullish ideas have been realized. Today, there is no doubt that it will continue to be bullish and long. The market has turned from the previous sweeping upward to a strong unilateral trend. The upper side will first look at the previous high pressure of 3435. Continued breakthrough will further open up the upper space, or it will hit 3500 or even a new high again. The lower support focuses on the top and bottom conversion position of 3395-3405, and then pay attention to the 1H cycle support near 3410. Intraday operations are still mainly based on falling back and long.
Operation suggestion: Go long when gold falls back to 3395-3345, and look at 3434 and 3450. If it is strong, continue to go long with the support of 3415-3410.

The gold trend is perfectly in line with expectations.The recent trend of gold is consistent with my expectations. Overall, the rebound is mainly based on fluctuating downward, and the rhythm of the oscillation between long and short positions is perfectly grasped. The upper resistance is still strong, and gold can still be shorted if the rebound is not broken.
From the current analysis of the gold trend, the lower support focuses on the area around 3315-3305. If it falls back to this position range, continue to look at the continuation of the rebound upward; the upper resistance focuses on the area around 3350-3362. The overall rhythm of the high-altitude and low-multiple range is still maintained, and the strategy is mainly to participate in the range back and forth.
1. Go long when gold falls back to 3315-3305, and the target is 3330-3340;
2. Go short when gold rebounds to 3350-3360, and the target is 3340-3330.

Gold rebound is still a short-selling opportunityFirst of all, let's take a look at why the market is still not reversing after a big rise, and there is a rapid rise and fall?
The data is bullish, and gold is rising rapidly, but we should pay attention to the sustainability of the rise, and secondly, the current trend direction. The overall trend of gold is still fluctuating downward recently, so even if the data is bullish, it is likely to just give an opportunity to "go high and short".
Although gold performed strongly after the data was released, it began to fall under pressure at the 3360 line, the trading concentration area of the last box shock, indicating that the bulls' volume is still not enough to break through the upper resistance. It is reasonable to rise and fall.
Since gold is currently in a market that is tempting to buy more, it means that the main trend is still bearish. The rebound is still dominated by short selling. The gold 1-hour cycle closed with a long upper shadow, indicating that the upward attack is weak, indicating that the area above 3350 is still a strong pressure area. This upward rush is just a short-term effort with the help of data benefits, which is a typical false breakthrough. Therefore, gold rebounded to the 3350-3360 area in the US market, and it is still dominated by high shorts.
This is the charm of the market - some people are always hesitant in the ups and downs, while others can always grasp the key turning points. The premise is to be able to see the trend clearly and follow the trend.
Don't be led by the market, but understand: Is the current fluctuation a trap or an opportunity?
If the direction is wrong, the effort will be in vain; if the direction is right, you will get twice the result with half the effort.
Don't make excuses for failure, just find ways to succeed. Have you found it?
All recent trading strategies and ideas have been realized, and the point predictions are accurate. If your current gold operation is not ideal, we hope to help you avoid detours in your investment. Welcome to communicate with us!

Today’s gold strategy: go long on support and short on pressure!Today, there is a high probability that the volatile bullish trend will continue. In terms of operation, we should seize the opportunity of short-term bullish. The key support level of the daily line is around 3350-3355. If it falls back to this level, you can arrange short-term bullish with a light position. If the market is strong and there is no obvious correction, you can enter the long position in advance at the 3370 line. Pay attention to the upper resistance level of 3400-3405. Once it breaks through effectively, wait for the opportunity to arrange short positions after the surge. In the volatile market, both long and short positions have opportunities. Don't chase the rise and sell the fall. Be sure to wait patiently for the right time to enter the market and strictly control the position.
Gold operation suggestions: short gold rebounds around 3400-3405. Go long gold when it falls back to around 3350-3360. Go long at 3370 first if it is strong and does not pull back.

The pullback did not change the bullish trendGold maintained a weak structure of shock in the Asian and European sessions, and the price slowly adjusted back, forming a secondary bottoming pattern during the day. The current trend is mainly structural consolidation. From a technical perspective, 3328 and 3335 below constitute key short-term support. If it does not break expectations, it will effectively stop the decline and stabilize, and provide a basis for a rebound.
At present, the profit space for chasing shorts is limited. The only stable idea is to wait for the gold price to fall back and stabilize before participating in the long position layout. In terms of operation, it is recommended to arrange long positions near the support level, focusing on the strength of gold's retracement in the 3325-3330 range, and confirming the stabilization of the decline.
Once it stabilizes and rebounds, the short-term long target can be seen at 3350 and 3378, and the extended target focuses on the previous high of 3392. If it breaks through strongly and stands firm at this position, it will further open up to 3400-3410 space.
Operation suggestion: If gold falls back to the 3325-3330 range, go long with a light position. If it falls to 3335 and stabilizes, you can enter long orders in advance, with targets at 3350 and 3378.

XAUUSD Monthly Outlook – May 2025"Momentum Meets Maturity: Gold Faces Its Final Trap?"
🔹 Overview:
Gold has delivered an explosive rally through Q1–Q2 2025, breaking all structural ceilings and printing a new All-Time High (ATH) at 3500 in April. May followed with aggressive bullish continuation, but failed to break that high, closing with a strong body but signs of momentum cooling. We are now trading inside a premium liquidity zone, where retracement becomes increasingly probable.
🔹 Monthly Structure & Bias
🔎 Component Status / Detail
Current Price Range 3285–3310
Market Bias Bullish, but overextended
ATH Confirmed 3500 (April 2025)
May High 3435 – did not break ATH
Structure HH + BOS above 2108 = bullish macro
EMA Trend Full EMA 5/21/50/100/200 bull lock
RSI Likely near overbought (watch June)
🔹 Refined Monthly Zones – GoldFxMinds Precision
📍 Zone Type Key Levels Explanation
🔺 Premium SELL Zone #1 3335 – 3368 First rejection layer inside premium. Previous wick reactions.
🔺 Premium SELL Zone #2 3368 – 3405 Final inducement from May. Ideal for stop hunts and traps.
🔺 ATH Trap Zone 3405 – 3500 Full liquidity cluster around ATH. Extreme caution here.
🔹 Local Monthly Support 3112 – 3098 Minor support below May’s PNL. First reaction floor.
🔹 FVG/OB Buy Zone 3060 – 3038 Valid monthly FVG + OB zone. Stronger confirmation area.
🔵 Macro Swing Support 2638 – 2612 Monthly OB and last HL before the 3000+ breakout. Solid base.
🔵 BOS Origin / HL Base 2592 – 2570 True origin of macro bullish structure. Swing trader interest.
⚫ Equilibrium Major #1 2280 – 2265 Fibonacci 50% of full macro range + EMA50. Potential macro reentry.
⚫ Equilibrium Major #2 2245 – 2212 Liquidity from past accumulation zones (2023–2024).
🔹 Fibonacci Context
Full swing: 1045 (2015 low) → 3500 (ATH April 2025)
Price is now pressing between the 1.618 and 2.0 extension zone, ideal area for macro distribution.
The 50% equilibrium of the macro range sits at ~2240, aligning with EMAs and historical demand.
🔹 Liquidity Analysis
✅ Buy-side liquidity swept at every major milestone: 2108 → 2500 → 3000 → 3300
🎯 Final liquidity pool lies above 3435 into 3500 → this is where many late buyers could be trapped.
💧 Sell-side liquidity sits cleanly around 3110 → 2590 → 2240 — these are the likely draw targets if correction begins.
🔹 Macroeconomic Context (May–June 2025)
📰 Federal Reserve: Markets expect a possible rate cut in Q3, which still supports gold, but with less surprise.
🌍 Geopolitical Risks: Persistent global instability continues to back the gold rally.
🧮 Equity Overextension: Rotation from risk assets to safety could fuel one more push — or trigger a sharp correction.
💹 Inflation Outlook: Any spike in CPI may trigger further bullish flows — but positioning is already saturated.
🔚 Summary – What's Next?
✅ Trend: Still bullish, but at the final stages of maturity
⚠️ Risk: Sharp rejection likely near 3435–3500
📌 Scenarios to watch:
Push into 3435–3500: Final inducement → possible sharp rejection
Break below 3110: Opens path to 3038 or even 2630
Major swing buys only valid around 2638 or 2240, if macro retracement triggers
🧠 GoldFxMinds Final Word:
The monthly chart shows strength, but we are now deep inside premium, under the shadow of a freshly printed ATH. If June opens with a wick or false breakout above 3435, expect a high-probability retracement toward 3110 or deeper.
This is not the time to chase buys blindly — but rather to position smartly at real OBs and FVGs, where structure confirms.

GoldFxMinds – XAUUSD Battle Plan for May 30, 2025Hello, GoldMinds snipers!
Big news day ahead — Core PCE ). This is the kind of day where one news candle can change the whole game! Let’s get our sniper zones ready for both bullish rallies and bearish reversals.
⚡️ Macro & News Context
Core PCE is a Fed favorite: high-impact, high-volatility.
Gold just closed near 3317, high in premium territory — but market structure is coiled, not committed.
Any PCE surprise can send us flying… or dumping.
📈 If Price Stays Bullish / News is Dovish
3325–3335: First resistance, the "fortress wall."
If price clears and HOLDS above, next upside targets activate.
3348–3360: Next sniper zone above — historical supply, D1 OB, liquidity magnets.
A strong close above 3335 = bulls control. Watch for quick tests of this upper block.
If price breaks above 3360:
The next “wild zone” is 3378–3388 — untapped liquidity above all previous swings. Only super strong rallies reach here, so trail your stops tight if you’re long.
📉 If Price Reverses / News is Hawkish
3315–3305: Trap zone, choppy — avoid entries here.
3285–3295: Key H1 demand, look for bounce or structure reclaim.
3250–3260: Deep discount sniper zone.
Only buy if you see real reversal; if this breaks, expect panic to 3220 or even 3200.
🧠 Bias, Playbook, and Caution
Bias: Neutral but flexible.
Above 3335, bulls have momentum — look for breakouts.
Below 3285, sellers control the show.
Do not rush the first move after PCE.
Real direction comes after the volatility traps.
🏹 Battle Plan
Long only above 3335, with a confirmed breakout and volume.
Short only at supply zones (3325–3335 or 3348–3360) if you see strong rejection.
Never chase the spike. Wait for M5/M15 structure to confirm.
Trap zone (3305–3315): Sit on your hands. Let the bots fight.
🔥 Final Word
This is a two-way battle:
If gold rockets above, follow the flow — but don’t forget, every hero rally can be a trap!
If the bears win, be ready to strike on the drop.
Comment your bias (🚀 or 🔻), hit follow for the post-news recap, and trade like a sniper, not a gambler.
— GoldFxMinds 🟡🚨

Gold at a Psychological Level Gold has now risen to 100 times its previously fixed price of $35 per ounce.
Is this a psychological milestone signaling a correction ahead, or is there still more upside potential?
Under the Gold Reserve Act of 1934, gold was officially priced at $35, a rate maintained until 1971, when President Nixon suspended the dollar’s convertibility into gold, effectively ending the gold standard. This historic move, known as the “Nixon Shock,” allowed gold to trade freely in the market. By December the same year, the market price had already climbed to around $43–44 per ounce.
So why has gold risen from $35 to $3,500?
Gold is widely recognized as a hedge against inflation—but in reality, it has proven to be more than that.
Let’s consider this:
If inflation had compounded at the target rate of 2% per year since 1971, gold should be priced at $102 today.
But at $3,500, the also implied that the compounded annual growth rate is around 8.9%.
So, what explains this outperformance?
One key driver is the expansion of the money supply, especially through debt, and more critically, debt financed by money printing.
Periods of high inflation are can be preceded by an unjustified increase in the money supply, not backed by corresponding income or production output.
In 2018, we saw the beginning of Trump’s Tariff 1.0. Since the anticipation of Trump’s Tariff 2.0, I’ve incorporated a framework I call the QTD Matrix—which stands for Quantitative Easing, Tariffs, and Debt—to track the trajectory of gold prices.
As long as we continue to see:
• Central banks deploying Quantitative Easing during crises,
• Ongoing or escalating Tariff wars, and
• Persistent growth in national Debt,
It is reasonable to expect gold to remain firm and potentially break into new highs.
Historical Observations:
• Let’s start with Gold vs QE. Each major wave of QE has triggered a significant rally in gold—from Japan’s QE in 2001, to US QE1, QE2, and QE3 following the 2008 crisis, and the massive Covid-era QE in 2020.
• Next Gold vs Tariffs. When Trump’s Tariff 1.0 was announced in August 2018, gold pivoted on that very day and began trending higher.
In October 2022, Biden’s export controls on advanced chips acted as a tariff-equivalent event, once again prompting gold to rise.
After Trump's re-election in November last year, markets began pricing in Tariff 2.0, and gold responded by trending upward once more.
• Finally Gold vs Debt. Gold has also moved in close tandem with the rising US debt over the years.
As of now, I believe that QE (Q), Tariffs (T), and Debt (D) will remain in play.
Hence, it's reasonable to expect:
• The cost of living to remain elevated,
• Inflationary pressures to persist, and
• Gold prices to continue their long-term uptrend.
That said, I’m also noticing technical and psychological resistance in the mid-term after it reached $3,500.
This is a quarterly chart, once I have identified its primary uptrend line, I would like to mirror it to its significant peak (going back way back the 1980s, a period of high inflation), which appears to intersect around the psychological level of $3,500.
With the trade war currently on pause, gold may temporarily take a breather. But as long as QTD remains intact, it may just be a matter of time before gold tests its recent resistance—and, if broken, continues its upward trajectory.
We should also ask:
Is there any possibility that the Q, T, or D could shift in the opposite direction?
If so, that could be a positive sign for equity markets.
Micro Gold Futures & Options
Ticker: MGC
Minimum fluctuation:
0.10 per troy ounce = $1.00
Disclaimer:
• What presented here is not a recommendation, please consult your licensed broker.
• Our mission is to create lateral thinking skills for every investor and trader, knowing when to take a calculated risk with market uncertainty and a bolder risk when opportunity arises.
CME Real-time Market Data help identify trading set-ups in real-time and express my market views. If you have futures in your trading portfolio, you can check out on CME Group data plans available that suit your trading needs www.tradingview.com
Trading the Micro: www.cmegroup.com
www.cmegroup.com
