XAU/USD 14 July 2025 Intraday AnalysisH4 Analysis:
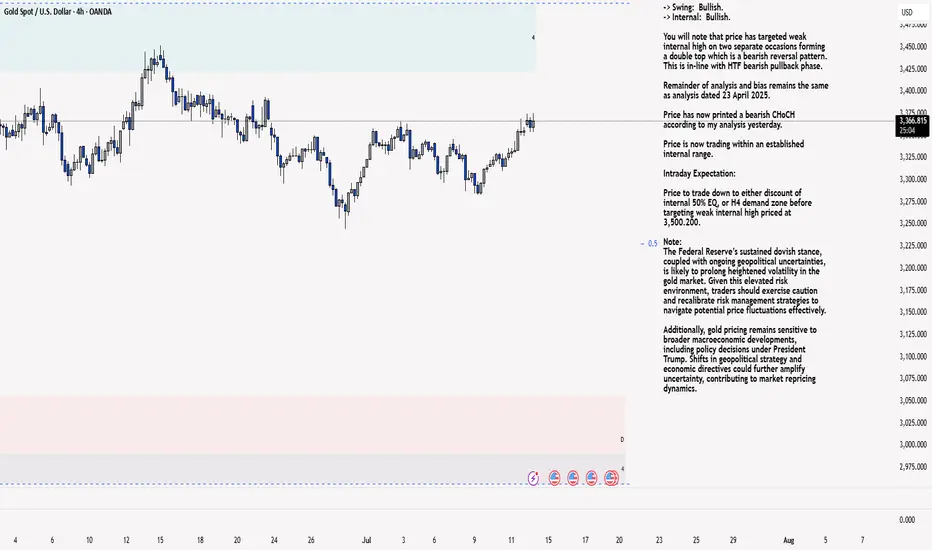
-> Swing: Bullish.
-> Internal: Bullish.
You will note that price has targeted weak internal high on two separate occasions forming a double top which is a bearish reversal pattern. This is in-line with HTF bearish pullback phase.
Remainder of analysis and bias remains the same as analysis dated 23 April 2025.
Price has now printed a bearish CHoCH according to my analysis yesterday.
Price is now trading within an established internal range.
Intraday Expectation:
Price to trade down to either discount of internal 50% EQ, or H4 demand zone before targeting weak internal high priced at 3,500.200.
Note:
The Federal Reserve’s sustained dovish stance, coupled with ongoing geopolitical uncertainties, is likely to prolong heightened volatility in the gold market. Given this elevated risk environment, traders should exercise caution and recalibrate risk management strategies to navigate potential price fluctuations effectively.
Additionally, gold pricing remains sensitive to broader macroeconomic developments, including policy decisions under President Trump. Shifts in geopolitical strategy and economic directives could further amplify uncertainty, contributing to market repricing dynamics.
H4 Chart:
M15 Analysis:
-> Swing: Bullish.
-> Internal: Bullish.
H4 Timeframe - Price has failed to target weak internal high, therefore, it would not be unrealistic if price printed a bearish iBOS.
The remainder of my analysis shall remain the same as analysis dated 13 June 2025, apart from target price.
As per my analysis dated 22 May 2025 whereby I mentioned price can be seen to be reacting at discount of 50% EQ on H4 timeframe, therefore, it is a viable alternative that price could potentially print a bullish iBOS on M15 timeframe despite internal structure being bearish.
Price has printed a bullish iBOS followed by a bearish CHoCH, which indicates, but does not confirm, bearish pullback phase initiation. I will however continue to monitor, with respect to depth of pullback.
Intraday Expectation:
Price to continue bearish, react at either M15 supply zone, or discount of 50% internal EQ before targeting weak internal high priced at 3,451.375.
Note:
Gold remains highly volatile amid the Federal Reserve's continued dovish stance, persistent and escalating geopolitical uncertainties. Traders should implement robust risk management strategies and remain vigilant, as price swings may become more pronounced in this elevated volatility environment.
Additionally, President Trump’s recent tariff announcements are expected to further amplify market turbulence, potentially triggering sharp price fluctuations and whipsaws.
M15 Chart:
Goldupdates
XAUUSD - Emotional Scalping on Gold Leads to Blown Accounts📔 “I’ll just scalp Gold on the 1-minute” — said the future blown account
Gold doesn’t care about your emotions.
It doesn’t care that you think you can catch a move before it happens.
And it definitely doesn’t care about your $50 dream from a 20-pip scalp.
Real Gold traders don’t come for 20 pips.
They come for precision, for structure, and for 80–100 pip setups backed by real confluence.
If you’re pressing buttons on the 1-minute because you “feel it,”
you’re not trading Gold — you’re feeding it.
And it will eat you alive.
⭐1. Gold is Not a Currency Pair — It’s a Metal with a Temper
You’re not trading EURUSD.
You’re trading a metal — one of the most reactive and manipulated instruments in the market.
Gold doesn’t respond like a normal pair.
It reacts like a sensor. A trigger.
🔸 Geopolitical tension? It spikes.
🔸 USD news? CPI, NFP, FOMC — massive moves.
🔸 Imbalances and inducement zones? It respects them with surgical precision.
🔸 Thin liquidity or Asian session? Expect the unexpected.
Last night, due to a political situation Gold didn’t hesitate.
It exploded — hundreds of pips — while other pairs just twitched.
And here’s the truth:
🔱 Gold is the most loved asset on the planet.
• It’s wealth.
• It’s power.
• It’s culture.
• It’s fear and greed — in physical form.
That’s why it dominates the market.
That’s why it’s unpredictable.
And that’s why you need to approach it with respect — not emotion.
⏱️ 2. The 1-Minute Trap: Why You’re Always Late
On M1, there is no structure — only speed.
By the time you “see a pattern,” you’re already the exit liquidity.
Order blocks? FVGs? Choch?BOS?
They’re there… but barely readable in real time unless you’re hyper-trained.
You’re not early.
You’re late — many, many times.
And Gold punishes late entries without mercy.
So what should you do instead?
🧭 Zoom out. Reset. Re-anchor.
Start with D1-H12-H4-H1. Mark the structure.
Drop to M30/15/5 to refine your zones.
Then — and only then — use M1 as a trigger, not a chart to trade blindly on.
M1 is for confirmation — not discovery.
It shows behavior, not bias.
And if you treat it like a full chart, it will bury your account one candle at a time.
🤓3. If You're New — Respect the Timeframes
If you’ve been trading Gold for less than 6 months,
you don’t need more entries. You need more patience.
Work with:
✅ 1H
✅ 30m
✅ 15m
That’s where the story unfolds — clean, structured, readable.
Yes, study the lower timeframes.
Flip through M1, M3, M5, M7, M10…
Zoom in, zoom out. Train your eye.
And slowly, you’ll start to recognize the way Gold breathes — how it baits, spikes, pauses, and traps.
But execution?
Execution stays clean, until your structure reads faster than your fear.
🚨4. Gold Doesn’t Just Move Fast — It Gets You Hooked
Gold isn’t just volatile — it’s addictive.
You win once… you feel unstoppable.
Twice… now you think you’re the chosen winner.
And just like that, you’re hooked.
You start ignoring your loss, because those two wins gave you more dopamine than a full week of consistency.
You don’t even notice you’re in a loop:
→ Two wins
→ Five losses
→ One clean trade
→ Three more losses
→ Still confident… because of one high
You’re not trading structure.
You’re chasing a chemical high — and Gold is your dealer.
That’s why M1 destroys accounts.
Because the more you “almost catch it,” the more obsessed you get.
You don’t need a new setup.
You need to break the loop.
Walk away, breathe, come back and trade less.
😶🌫️ 5. If Your Mind is Not Calm — Stay Off the Chart
Gold will test your technicals — but it’ll destroy your psychology if you’re not stable.
Had a bad day at work? Argued with someone? Feeling off?
Do. Not. Trade. Gold!!
This metal feeds on instability.
It senses when you’re not focused.
And it will punish you faster than you can say “SL hit.”
💬 “You trade what you feel. So if you’re a mess inside, your chart becomes chaos too.”
🔚 Bottom Line: You Don’t Need More Trades. You Need Better Vision.
Scalping Gold on M1 sounds smart.
Feels efficient. Looks exciting.
Until you’re left with a blown account and a broken mindset.
🫶 Want to stop gambling and start dominating?
Start with patience. Stick to timeframes. Learn the rhythm.
Gold is not for the impulsive — it’s for the precise.
If this lesson helped you today and brought you more clarity:
Drop a 🚀 and follow us✅ for more published ideas.
XAUUSD | Sniper Entry Zones Ready – Eyes on 3145 & 3086 Reactio🔍 Daily Bias: Neutral with Bearish Intraday Tilt
Price is reacting to a previously unmitigated zone and potentially retesting a premium area, suggesting sell-side interest may return before any bullish continuation.
🧠 Key Context from Your Marked Chart
✅ Marked Sell/Retest Zone @ 3135–3145:
Clearly defined premium zone with imbalance and prior bearish reaction — confluence with OB + FVG, potential sniper entry for shorts.
✅ Unmitigated OB @ 3086–3095:
Valid demand zone where price bounced aggressively — still active liquidity + FVG.
✅ Major Imbalance Below @ 3054–3040 & 3040–3029:
Heavy drawdown target area. If price breaks 3086, expect it to fill imbalance and potentially bounce at 3040 or deeper around 3029.
🔽 Sell Scenarios
🟥 Sell #1 — Retest of Supply Sniper Entry
Entry Zone: 3135–3145
Confluences: Valid OB, FVG, Premium, Bearish PA from last touch
Target: 3086, then 3054–3040 imbalance zone
RSI: Check for overbought on M15–H1
🎯 "Classic sniper setup — get in, get out. No overthinking required."
🟥 Sell #2 — Break and Retest Below 3086
Trigger: Bearish close below 3086 + BOS on M15
Retest Entry: 3086 zone from below
Target: 3054 (first FVG), then 3029
EMAs: 5/21/50 flip short on M15 for confirmation
🟩 Buy Scenarios
🟩 Buy #1 — Bounce from 3086–3095 (Unmitigated OB)
Entry: Clean reaction + bullish PA in zone
Target: 3135 retest, partials at 3114
Sniper Confluence: BOS on M5/M15 + RSI divergence
🟩 Buy #2 — Deep Bounce from 3040 or 3029 Imbalance Zone
Entry: Only on strong PA confirmation (no early knives)
Target: 3086 first, 3135 secondary
RSI + EMA: Look for EMA 100–200 confluence, bullish divergence on RSI M15/M30
🧾 Technical Confluences Summary
✅ SMC: BOS + CHoCH present across M15–H1
✅ FVG: 3135–3145 (upper), 3054–3040 (lower)
✅ GAPS: Visible in 3054–3029 zone
✅ LIQUIDITY: Above 3145 + below 3029
✅ OB VALID: 3086–3095 still unmitigated
✅ RSI: Overbought earlier, neutral now. Watch intraday shifts.
✅ EMA Clusters:
EMA 5/21 flat after rebound
EMA 50/100 just below 3100
EMA 200 near 3050–3040 (high confluence for bounce)
⚠️ News & Fundamentals
Trump conference added USD volatility, but gold didn’t rally — watch for Fed speakers & JOLTS data tomorrow.
If dollar strengthens intraday again → watch sell setups more closely.
🧨 TradingView Title Suggestion:
“🎯 XAUUSD | Sniper Entry Zones Ready – Eyes on 3145 & 3086 Reactions!”

XAU/USD 18 March 2025 Intraday AnalysisH4 Analysis:
-> Swing: Bullish.
-> Internal: Bullish.
Price has printed a bullish iBOS, however, I will apply discretion and not classify as a bullish iBOS due to very insignificant pullback which would distort internal range. Therefore, I have marked the iBOS in red.
Intraday Expectation:
Await for price to indicate pullback phase initiation by printing bearish CHoCH. ChOCH positioning is denoted with a blue dotted line.
Note:
With the Federal Reserve's dovish stance and persisting geopolitical uncertainties, heightened volatility in Gold is expected to continue. Traders should proceed with caution and adjust risk management strategies in this high-volatility environment.
Price could also be driven by President Trump's policies, geopolitical moves and economic decisions which are sparking uncertainty.
H4 Chart:
M15 Analysis:
-> Swing: Bullish.
-> Internal: Bullish.
Since yesterday's analysis, price has continued to surge to new all time highs, largely fuelled by geopolitical tensions. Gold is solidifying itself as a safe haven asset.
Whilst price has not pulled back to discount of 50% I am happy to classify as a bullish iBOS due to time spent.
Price has printed a bullish iBOS followed by a bearish CHoCH to confirm internal structure. I will however continue to monitor price.
Intraday Expectation:
Price to continue bearish to complete it's bearish pullback phase to either discount of internal 50% EQ or M15 demand zone before targeting weak internal high, priced at
Note:
With the Federal Reserve maintaining a dovish stance and ongoing geopolitical tensions, volatility in Gold prices is expected to remain elevated. Traders should exercise caution, adjust risk management strategies, and stay prepared for potential price whipsaws in this high-volatility environment.
M15 Chart:

GOLD 4H CHART ROUTE MAP AND TRADING PLAN FOR THE WEEK4H Trading Analysis
Hi Everyone,
Here’s our updated 4H chart analysis and key levels for the upcoming week.
Market Overview
As seen on the chart, after successfully reaching TP2, the candle body failed to close above this level, and the EMA5 also did not cross and lock above it. Currently, Gold is trading within three weighted levels, with a gap above 2,800 and a gap below 2,788.
What’s Next for GOLD?
The 4H candle was unable to close above TP2 (2,815), and EMA5 was rejected at this level. This indicates a potential short-term reversal.
📉 Key Levels
Support Zones: Strong support is expected at the FVG zone and Gold Turn Levels at 2,788, 2,762, 2,745, and 2,705 (Retracement Range).
Downside Risks
If EMA5 crosses and holds below 2,788, the next target is 2,762.
If EMA5 crosses and holds below 2,762, the downside extends to 2,745.
A further break below 2,762 could drive prices down to 2,705.
📈 Bullish Scenario
A bounce from support levels could trigger a retest of TP1 (2,788), with potential upside towards TP2 (2,815) and TP3 (2,841).
Trading Strategy
🔹 Short-Term Trades:
Utilize 1H and 4H timeframes to capitalize on pullbacks at Gold Turn Levels.
Target 30–40 pips per trade while focusing on shorter positions in this range-bound market.
🔹 Long-Term Outlook:
Our bullish bias remains intact, viewing pullbacks as buying opportunities.
Buying dips from key levels offers better risk management rather than chasing tops.
Final Thoughts
Trade with confidence and discipline—our precise analysis keeps you well-prepared to navigate market movements. Stay tuned for daily updates and multi-timeframe insights.
Best regards,
📉💰 The Quantum Trading Mastery

XAU/USD 09 September 2024 Intraday AnalysisH4 Analysis:
Intraday expectation, analysis and bias remains the same as analysis dated 23 August 2024.
-> Swing: Bullish.
-> Internal: Bullish.
Price has printed a bullish iBOS.
After an iBOS (Internal Break of Structure) we expect a bearish pullback.
Price has printed bearish CHoCH which indicates, but not confirms bearish pullback phase initiation
Intraday expectation: Whilst price did continue bearish as part of bearish pullback phase, I am concerned that price has not, as yet, pulled back deep enough into either H4 demand zone or discount of 50% EQ, therefore, it is my view that price will seek further liquidity before a sustained bullish move to target weak internal high.
H4 Chart:
M15 Analysis:
Intraday expectation, analysis and bias remains the same as analysis dated 05 September 2024.
-> Swing: Bullish.
-> Internal: Bearish.
Due to several factors such as geopolitical tensions and many macroeconomic factors XAU continues to surge.
Nonetheless, I will continue with systematic rules of analysis.
Technically price should target weak internal low, therefore, my bias will remain unchanged until M15 candle break and close above swing high.
Price has targeted weak internal low but the move was not sustained which indicates that price may be seeking further liquidity.
We are seeing a secondary reaction to previous M15 supply zone.
Intraday expectation: Price is in premium of internal 50% EQ. Price to target weak internal low. My bias will remain unchanged until and unless M15 candle close above strong swing high.
M15 Chart:

XAU/USD 02 August 2024 Intraday AnalysisH4 Analysis:
Intraday expectation, analysis and bias remains the same as analysis dated 23 August 2024.
-> Swing: Bullish.
-> Internal: Bullish.
Price has printed a bullish iBOS.
After an iBOS (Internal Break of Structure) we expect a bearish pullback.
Price has printed bearish CHoCH which indicates, but not confirms bearish pullback phase initiation
Intraday expectation: Whilst price did continue bearish as part of bearish pullback phase, I am concerned that price has not, as yet, pulled back deep enough into either H4 demand zone or discount of 50% EQ, therefore, it is my view that price will seek further liquidity before a sustained bullish move to target weak internal high.
H4 Chart:
M15 Analysis:
Intraday expectation, analysis and bias remains the same as analysis dated 27 August 2024.
-> Swing: Bullish.
-> Internal: Bearish.
As mentioned in previous analysis whereby we needed to be mindful that H4, following bullish iBOS, has yet to initiate bearish pullback, therefore, it would not be unexpected if strong internal low was to be targeted. This is exactly what price printed, printing a bearish iBOS.
Price has printed bullish CHoCH indicating bullish pullback phase initiation.
Intraday expectation: Price is in premium of internal 50% EQ with strong high remaining protected. Price to target weak internal low.
M15 Chart:https://www.tradingview.com/x/JBvjXAlC/

XAU/USD 12 August 2024 Intraday AnalysisH4 Analysis:
Analysis/Bias remains the same as yesterdays analysis dated 11 August 2024
-> Swing: Bullish.
-> Internal: Bullish.
Following price printing bullish BOS price pulled back to discount of 50% EQ before targeting weak internal high.
As previously mentioned, bullish momentum and pro swing/internal structure was unable to break and close above weak internal high, which could be an early indication that bearish pullback phase is incomplete and price will seek further liquidity before targeting weak internal high. This is what price printed according to my analysis.
Intraday expectation: Price has reacted at an H4 demand level, therefore, price to target weak internal high.
H4 Chart:
M15 Analysis:
I will keep my analysis/bias the same as dated 06 August 2024 in order to demonstrate alternative scenario and how the HTF's will always hold more weight over LTF's.
-> Swing: Bullish.
-> Internal: Bearish.
Yesterday's intraday expectation was met, assisted by dovish US economic news.
Price has printed a further bearish iBOS followed by a bullish CHoCH indicating bullish pullback phase initiation.
Indication of pullback initiation started by reaction at H4 demand level.
Price is currently hovering around 50% EQ printing low volume rangebound price action.
Intraday expectation: Price to react at premium of 50% internal EQ or M15 supply zone before targeting weak internal low.
Alternative scenario: Whilst intraday expectation is technically correct, we need to bear in mind that internal H4 structure is bullish with bearish pullback phase currently underway and could potentially be complete after reacting at H4 demand level.
M15 Chart:

XAU/USD 07 August 2024 Intraday AnalysisH4 Analysis:
Bias/Analysis remains the same as analysis dated 04 August 2024.
-> Swing: Bullish.
-> Internal: Bullish.
Following price printing bullish BOS price pulled back to discount of 50% EQ before targeting weak internal high.
However, bullish momentum and pro swing/internal structure was unable to break and close above weak internal high, which, much like the daily TF, could be an early indication that bearish pullback phase is incomplete and price will seek further liquidity before targeting weak internal high.
Intraday expectation: Technically, price should target weak internal high, however, price has made one failed attempt, therefore, price could continue bullish, react at H4 supply level, print bearish price action, react at H4 demand level before targeting weak internal high.
H4 Chart:
M15 Analysis:
Analysis/Bias remains the same as yesterday's analysis dated 06 August 2024.
-> Swing: Bullish.
-> Internal: Bearish.
Yesterday's intraday expectation was met, assisted by dovish US economic news.
Price has printed a further bearish iBOS followed by a bullish CHoCH indicating bullish pullback phase initiation.
Indication of pullback initiation started by reaction at H4 demand level.
Price is currently hovering around 50% EQ printing low volume rangebound price action.
Intraday expectation: Price to react at premium of 50% internal EQ or M15 supply zone before targeting weak internal low.
Alternative scenario: Whilst intraday expectation is technically correct, we need to bear in mind that internal H4 structure is bullish with bearish pullback phase currently underway and could potentially be complete after reacting at H4 demand level.
M15 Chart:

XAU/USD 31 July 2024 Intraday AnalysisH4 Analysis:
-> Swing: Bullish.
-> Internal: Bullish.
Price has printed a swing BOS, printing an all time high.
After BOS/iBOS price is expected to pullback.
Last analysis and intraday expectation was for price to pull back into discount of 50% EQ or H4 demand zone before targeting weak internal high which currently seems underway, therefore, intraday expectation remains the same.
H4 Chart:
M15 Analysis:
-> Swing: Bullish.
-> Internal: Bullish.
Price has printed a bullish iBOS
After iBOS we expect price to pull back, therefore, for an early indication that pullback has initiated we need to see price print a bullish CHoCH.
Bearish CHoCH has been printed which indicates bearish pullback phase initiation and internal range.
Intraday expectation: Price to trade down to either discount of 50% EQ or M15 demand zone before targeting weak internal high.
M15 Chart:

XAU/USD 19 July 2024 Intraday AnalysisH4 Analysis:
-> Swing: Bullish.
-> Internal: Bullish.
Price has printed a swing BOS, printing an all time high.
After BOS/iBOS price is expected to pullback.
Intraday expectation: Price to pull back into discount of 50% EQ or H4 demand zone before targeting weak internal high.
H4 Chart:
M15 Analysis:
-> Swing: Bullish.
-> Internal: Bearish.
Price has printed a bearish iBOS which confirms swing pullback phase initiation.
After iBOS we expect price to pull back, therefore, for an early indication that pullback has initiated we need to see price print a bullish CHoCH.
CHoCH positioning is denoted with a blue dotted line on the inside bar candle.
We are currently trading within an internal high and fractal low.
Intraday expectation: Price to print bullish CHoCH to indicate bullish pullback phase initiation. Price to trade up to premium of 50% EQ or react at M15 POI before targeting weak internal low.
Alternative scenario: Price to print a lower low which would reposition CHoCH positioning closer to more recent price action.
M15 Chart:

GOLD next week I will be looking for sell GOLD next week I will be looking for sell
My Weekly bias is sell DXY will be strong in upcoming weeks so my eyes on GOLD will be selling I suggest you look for sell only gold is already overpriced
Good luck for the next week Traders

GOLD M45, Key level, see why ... 📈Hello Traders!
I'm coming up with updates related to GOLD M45.
As you can see, GOld took the liquidity level mentioned in the previous post, I consider it an important level to execute a LONG TRADE.
Also, on the chart, we can recognize the level of accumulation , for now, we are in the manipulation stage, and I expect a distribution until the 2060 level.
Follow, like, and comment to see the daily/weekly content.💯
www.tradingview.com
