Google - Bearish Doji Star & Toppy RSITitle is self-explanatory.
A bearish doji-looking candlestick formation.
Combined with very toppy RSI metrics.
All taking place on the weekly chart.
Google (Alphabet)

Market OverviewApple, Facebook, Google, S&P 500, and Nasdaq lost their support!
They all crossing below 50 EMA which used to be important support levels.
AAPL
NASDAQ:FB
GOOG
Question:
what are the signs of reversal?
Is more correction possible or not?

The Magical 50 days Exponential Moving Average (50EMA)In 2021, we should take the price reaction to 50EMA very seriously! Especially if you like to buy the dips!
I believe it could be single best tool to help you find the best entry and exit point in many tickers..!
Let's review few examples:
1- NASDAQ:NVDA
2- NASDAQ:MSFT
3- NASDAQ:AAPL
4- NASDAQ:GOOG
5- NASDAQ:FB
6- NYSE:CRM
7- NASDAQ:CSCO
8- NYSE:SNOW
9- NYSE:BAC
10- NYSE:XOM
and major indexes:
SP:SPX
TVC:NDX
TVC:DJI
What is Price Action?
Price action is the movement of a security's price plotted over time. Price action forms the basis for all technical analysis of a stock, commodity, or other asset charts. Many short-term traders rely exclusively on price action and the formations and trends extrapolated from it to make trading decisions. Technical analysis as a practice is a derivative of price action since it uses past prices in calculations that can then be used to inform trading decisions.
Price action generally refers to the up and down movement of a security's price when it is plotted over time.
Different looks can be applied to a chart to make trends in price action more obvious for traders.
Technical analysis formations and chart patterns are derived from price action. Technical analysis tools like moving averages are calculated from price action and projected into the future to inform trades.
How to Use Price Action
Price action is not generally seen as a trading tool like an indicator, but rather the data source off which all the tools are built. Swing traders and trend traders tend to work most closely with price action, eschewing any fundamental analysis in favor of focusing solely on support and resistance levels to predict breakouts and consolidation. Even these traders must pay some attention to additional factors beyond the current price, as the volume of trading and the time periods being used to establish levels all have an impact on the likelihood of their interpretations being accurate.
Limitations of Price Action
Interpreting price action is very subjective. It's common for two traders to arrive at different conclusions when analyzing the same price action. One trader may see a bearish downtrend and another might believe that the price action shows a potential near-term turnaround. Of course, the time period being used also has a huge influence on what traders see as a stock can have many intraday downtrends while maintaining a month-over-month uptrend. The important thing to remember is that trading predictions made using price action on any time scale are speculative. The more tools you can apply to your trading prediction to confirm it, the better. In the end, however, the past price action of a security is no guarantee of future price action. High probability trades are still speculative trades, which means traders take on the risks to get access to the potential rewards.
Conclusion:
Monitor asset reaction to 50EMA and define your entry and exit strategy based on this simple tool!
Reference Article::
www.investopedia.com

Be an inquirer, Not a Believer..!Words cannot express how much my followers mean to me.
I’m eternally grateful for all the support and kindness I have received in the past few months from my followers on this platform.
I came across an interesting story written by Friedrich Nietzsche, so I decided to share it here. I believe it will give you a clear pathway on how to follow others in life and trading as a part of your life.
The Bestowing Virtue
Zarathustra—a sage who is also the central character of the book—tells his followers to stop following him. He says, “I now go alone, my disciples! You too go now, alone! Thus I want it. I advise you: depart from me, and guard yourselves against Zarathustra! And better still: be ashamed of him! Perhaps he has deceived you.”
A young student (S) spent years searching for enlightenment. He traveled across many countries and lived among various groups of ascetics, but after searching for years, he found his quest to be fruitless. Finally, he gave up and decided to work on a farm. The farmer (F) he worked with was a simple man. He didn’t talk much, but when he did, he enjoyed a good philosophical debate with the student. At first, the student was open to debate, doubting much of what the farmer said, thinking he was similar to the other ascetics the student had met in the past. But after some time, the young student sensed an immense wisdom and tranquility inside the farmer. He started to agree with the farmer more and more. The students desire for enlightenment had returned, and so the student worked with the farmer for months, absorbing his knowledge. Eventually, the farmer noticed that the student had stopped debating with him, and the following conversation ensued.
F: I think it’s time for you to leave me.
S: Leave? Why?
F: Listen, when you first arrived here, we had many things to teach one another. We grew together and learned from each other. Your mind was inquisitive. But recently, you’ve begun to believe everything I say. You’ve gone from an inquirer to a believer, and I won’t let you do that to yourself or to me. We’re both better off if you leave.
S: But I came seeking the truth, and I found it in you.
F: The truth! You’re lost kid.
S: Why would you send me away like this? How can you do that to me?
F: Let me show you something. Take a look at this map. What do you see?
S: I see our farm, the river nearby, and the mountains.
F: No, you see /an image/ of our farm, the river nearby, and the mountains—not the things themselves. Now tell me, what can you learn from this map?
S: I can learn where the farm and the river are, the height of the mountain, where the berry trees are, where we plant our carrots…
F: No you can’t. Give it a few millennia. The river will dry up, the mountains will move, and this farm may be a city. You can’t learn anything about the farm as it is, you can only see an image of it as it was at some point in time. See, a man’s memory is like this map. It can capture a shadow of reality, and he can share that with you, but he can never give you the reality itself. A man can give you his memories of the truth, but he can never give you the truth itself. He can tell you where the farm was, but you’d still have to verify it for yourself. If you want the truth as you say, there can be no intermediaries, no middlemen. If there’s a middleman, then he is the one you are following, not the truth.
S: But what’s wrong with following you?
F: If you follow me, you’ll live according to /my/ memories. You’ll live according to /my/ map, and you’ll never learn to construct your own. What if my map is wrong? Then you’ll be lost with me, and you won’t be able to correct me because you never learned to navigate on your own. And if you can’t correct me, then we’re no longer able to help each other. But if you learn to see for yourself, if you learn to construct your own map of reality, then we can come together as friends and individuals. We can compare our maps and help one another see reality as it really is. And when we both see reality as it is, we can journey through it together, as equals.
S: I guess you’re right. I’ll start packing my things.
I believe if you change some words in this conversation and read it again it would be nice:
Farmer: Analyst
Student: Trader
Map: Analysis
Farm: Market
River: Trend
Mountain: price pattern
...
Nothing would be better than to finish my post number 1111 than expressing my gratitude once again:
I am more grateful to you than you’ll ever know.
Best,
Moshkelgosha
Reference:
freedominthought.com


GOOGLE First buy signal within the Channel Up.Pattern: Channel Up on 1D.
Signal: Buy (1/2 position) as the price hit and rebounded on the 4H MA50 (red trend-line). Second buy on the 1D MA50 (blue trend-line). This buy pattern has been holding for the majority of 2021.
Target: 3000 (just over the 1.5 Fibonacci extension, which is the extension target on all MA50 bounces).
Most recent Google signal:
** Please support this idea with your likes and comments, it is the best way to keep it relevant and support me. **
--------------------------------------------------------------------------------------------------------
!! Donations via TradingView coins also help me a great deal at posting more free trading content and signals here !!
🎉 👍 Shout-out to TradingShot's 💰 top TradingView Coin donor 💰 this week ==> Vergnes
--------------------------------------------------------------------------------------------------------

Google Shares Can Fall From Parabolic MoveTraders,
Google (Alphabet) had one the best runs since covid-19 crash last year. The move has just been nothing short of the best parabolic one in any stock in recent times. However it may be about to change. For the first time, Google price action has started to show sign of a correction.
And we know that when a parabolic moves corrects it usually is a quick one too. 😃
Both charts and algos are telling the same story. So this is something I will be watching next week as it may start a new domino effect and lead us into a great profitable short opportunities.
Rules:
1. Never trade too much
2. Never trade without a confirmation
3. Never rely on signals, do your own analysis and research too
✅ If you found this idea useful, hit the like button, subscribe and share it in other trading forums.
✅ Follow me for future ideas, trade set ups and the updates of this analysis
✅ Don't hesitate to share your ideas, comments, opinions and questions.
Take care and trade well
-Vik
____________________________________________________
📌 DISCLAIMER
The content on this analysis is subject to change at any time without notice, and is provided for the sole purpose of education only.
Not a financial advice or signal. Please make your own independent investment decisions.
____________________________________________________

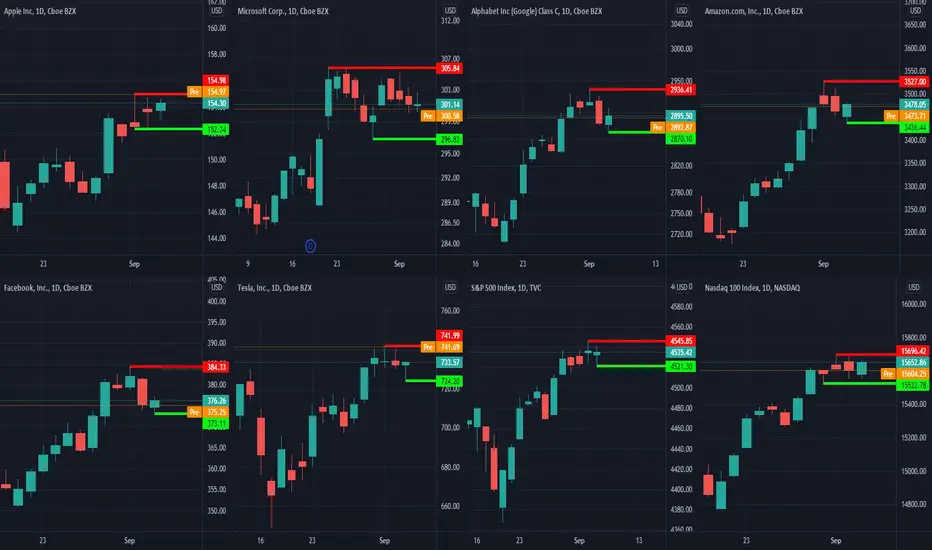
Market became Less "Inefficient" in the past few days!Looking at the price pattern of the biggest companies in the market (AAPL, MSFT, GOOG, AMZN, FB, TSLA) and the major indexes (S&P500 and NASDAQ 100) clearly shows Bulls and Bears power is reaching a new equilibrium.
after a Bullish rally that pushes prices higher in August 2021, we see multiple candles with small bodies(Doji) in the charts and prices went sideways in the past few days.
In a situation like this, the best decision could be being patient and waiting for breakouts.
Red lines: show the most important resistance levels, closing above these levels will enhance higher prices.
Green lines: show the most important support levels, closing below these levels will enhance lower prices.
Please be careful, crossing above or below these levels could be what we call a "Trap" in price patterns.
“This company looks cheap, that company looks cheap, but the overall economy could completely screw it up. The key is to wait. Sometimes the hardest thing to do is to do nothing.” David Tepper
GOOG cool-off coming?Looking to establish a LONG position in Google.
Couple of great value zones marked on the shorter and longer timeframes.
Very good chance GOOG just keeps pushing on - but prepared for either scenario as per TA.
** NOT FINANCIAL ADVICE **

MSFT - Clear Distribution by InstitutionsMicrosoft continues its Sell.
NVDA as well.
FB, Ditto.
GOOG, yep.
FANGS being sold is a large indication.

GOOG - Institutional SELLINGGOOG is being Sold.
Not much more to suggest here other than it is
the leading indicator for Alphabets... the FANGS.
FB is suffering the same fate.
Puts Bought, Shares sold.

GOOGLE / GOOGThe Google stock will start in a downtrend from the area shown on the chart
first target 2394
second target 2122

Potential Breakout in FANG Towards 8800Trend Analysis
The main view of this trade idea is on the 4-Hour Chart. The index FANG (FNG1!) has been in a rangebound price movement after hitting resistance around the 7400 price level in mid February 2021. FANG held support at 6050 and made a second attempt to break above 7400 in mid July. After that failure the index quickly found some support around 6800 and is heading towards that 7400 resistance level. Expectations are for a break higher in FANG, with that target being 8800.
Technical Indicators
FANG is currently above its short (25-MA), medium (75-MA) and long (200-MA) fractal moving averages. The RSI is above 50 with the KST in a positive zone. Also over multiple other timeframes, the technical indicators are signaling a buy.
Recommendation
The recommendation will be to go long at market. Stop loss will be set around the 6000 price level and a target of 8800. This produces a risk-reward ratio of 1.36.
Disclaimer
The views expressed are mine and do not represent the views of my employers and business partners. Persons acting on these recommendations are doing so at their own risk. These recommendations are not a solicitation to buy or to sell but are for purely discussion purposes. At the time publishing, I have a position in FNG1!.

The S&P 500 $SPX signaling strong divergenceThis probable next correction is very odd. As the index price action is showing strong negative divergence with de ADL and the MACD (one confirming the other), there is no euforia. Is like everyone is expecting this to happen. It may be just lack of interest of the market or that is summer time.
The Fear & Greed Index is in extreme fear, that almost never happens on tops. Still I can't ignore the technicals that are at least signaling that the SP:SPX is losing strength. So this is time to manage risk. I'm tightening my stops and suggesting to sell at least part of the positions we have at some of the winners like NYSE:PFE and NASDAQ:GOOG .
We opened a short position on the index but I'm still holding some stocks. Also, if the correction actually happens would be a very good opportunity to find strong stocks for the next leg up. I will be looking for strong relative strength and 52 week highs.
money.cnn.com

BTC Teethers to the real market....is there a correlation? In this first of many videos I have gone through a list of 100+ stocks and marked the placement of the teethers and the actual price point at the time I marked them. I will filter down this list to any stock I see a underlying correlation to the price action of the stock. I have used this technique to predict the bottom of bitcoin when it hit $30k and bounced. So basically finding the bottom twice with extreme accuracy. I actually believe I have some Ideas posted showing this bounce. and also some ideas showing where it would go afterwards. Being that bitcoin is above $42k I believe my 6 predictions leading up to it plus the two bounces at the bottom were all correct.
So I had a wild Idea....what if there is some correlation to the real market. A lot of companies are invested in bitcoin these days and a lot of institutional buying is also invested in bitcoin. If algos are trading bitcoin then it would be my belief that there is a correlation to the market and crypto through the algos that are being used. If a major institution is trading btc using its algo, and it is also trading the regular market, it would probably show in the price action in the same way. In just this first video, I think I prove that.
You are welcome to try and recreate what I have done here but I have acquired savant syndrome, I doubt you will see it the same way I do. There really is nothing to what I am doing that is special. I am just analyzing what I see, comparing that to the curve, wyckoff methodology, Candle stick technical analysis, Node analysis, and pattern recognition.
It takes me about 30 mins just to upload a video to Tradingview. So this will be 1 of probably 15 videos over a months time most likely an on going thing after the initial set that covers the first look. I will have to continuously adjust the list of the stocks that are showing some type of correlation to the BTC Teethers. Then Come up with an Ideology of how to interpret which lines are interacting with Price Action on each stock. If there is a Strong Correlation or a slight. Then come up with a test to really see if this stands up as a solid indicator. If anyone would like to help fund this, it would be much appreciated as it would take up 8-12 hours a day for months if not years. Finding early results would be easy but really finding out how this plays our will take months, each stock. Contact me here if you are interested in helping and I will post you in the credits plus give you first hand review of all the findings as I go through them. Thanks for watching.
by iCantw84it
08.17.2021

Best performer among Trillion dollars companiesIn the past trading year, google gained +80% and +56% in 2021 made Google the 3rd biggest company after Apple and Microsoft..!
But now, alarming sign in the chart!
Penetrating the bullish trend line..!
Closing below 2700 in the daily chart makes more corrections inevitable!

Last time this happened, SOL moved higher by 116% in 16 days!The last time this happened in SOL - it moved higher by 116% in 16 days!
This matches with my fundamental value analysis and relative value analysis that SOL is at least mispriced by half and should be double the value it is today considering the 300+ dApps it has already rolled out and the WORLD CLASS dev team they boast - probably a top 3 dev team I've seen of all projects I've studied.... maybe even the best.
Anyways, the crypto market sentiment is nearly the same today as it was the last time the CC SMA 50 turned green in SOL and SOL moved 116% higher in 16 days.
There was a lot of doubt in the markets back in December 2020 and early January 2021 about whether Bitcoin would sustain a run above $20k. I think something similar will happen here as well. The senate in all likelihood looks like they will vote for the better of the two proposed amendments - the Toomey/Wyden/ Lumis version rather than the one that ironically favors PoW mining. Ironic b/c Washington DC has been telling the world for decades that they are here to save the environment and here they are positing an amendment in a bill that would favor PoW mining!
I know the virtue signaling will get to them as callers into their office will remind them today how the bill would favor high energy intensity protocols if passed. At any rate, it's clear to me that the Senate will in the end favor the bill that is agnostic as to picking winners and losers and this could set BTC off into a mini bull run, setting the stage for SOL's next 116% gain in 16 days.
A very wonderful merger b/w technicals and fundamentals.

𝙰𝚙𝚙𝚕𝚎 𝚄𝚙𝚍𝚊𝚝𝚎: $AAPL Daily. ~25% later ...~25% later and appears to be consolidating for a test of trendlines above. Could lead $NQ_F out of its triangle on the hourly
$QQQ $NDX $MSFT $AMZN $GOOG $FB $SPY $ES_F $VIX $TNX #Trading #ElliotWave #Stocks 📈

Google Allows Crypto Ads on August 3rdThis is a change from their policy which banned it in March 2018. Starting on August 3rd, 2021 Google will allow exchanges and wallets to advertise crypto and crypto products.
This is a major turning point of the market imo - the number of people who will now casually see ads that never did before will be an order of magnitude higher.
Link to verify - straight from Google sources:
support.google.com(b)%20a%20federal%20or%20state%20chartered%20bank%20entity.

GOOG LongPrice retest from the Hourly Demand Zone Gap up, Upside Potential. Buy and Hold
4 Hour and Daily Looks Bullish

Alphabet Overbought on Hourly AHead of QuarterliesGoogle is in the bullish area on the daily chart on the left. The hourly EMAs and stochastic are in bullish mode and potentially align short-term traders with the daily. The stochastic is above 80 level and maintenance here (blue arrow) increases the chance of a successful trade. However, the RSI is overbought (blue shaded area) and a pullback may give a better risk-adjusted entry, as the oscillator normalises. Trend following indicators may be useful in this case as a potential exit tool. Stop under hourly support in conjunction with risk management techniques. Revenue is expected to be $55.95bn ($38.3 bn) and EPS is forecast at $19.19 ($10.13).

GOOGLE / GOOGThe Google stock will start in a downtrend from the area shown on the chart
first target 2394
second target 2122

All Time High, Market is fragile more than ever..!while many are happy watching all times highs, pros no any all-time high could be just one day before a major correction or starting the first phase of a crash..!
The trading value of Mega caps decreased more than 30- 50% in a week..!
This is a comparison between trading volume since 2021
AAPL
NASDAQ:MSFT
AMZN
GOOG
NASDAQ:FB
This weekend could be a perfect time to watch "The Big Short" if it is not late...
