Watch these patterns on GOOG! 👀Ok, GOOG has a head and shoulders in the 30min, and we see an advanced breakdown as well.
The RSI is not following the 4h chart as well. If GOOG triggers the head and shoulders in the 30 min, we’ll see a correction that could last for a few days. We were above the BB today too, indicating that any bearish sign trigger the pullback we are talking about.
This is not a sell sign yet, but we could see one soon! Oh, and no, I don’t believe GOOG will fail, please, but I think a correction will be very good for the stock. 😉
If you liked this trading idea, remember to click on the “Follow” button to get more trading ideas like this, and if you agree with me, click on the “Agree” button 😉.
See you soon,
Melissa.
Google (Alphabet)

GOOGLE Signals showing further growth.Pattern: Channel Up on 1D.
Signal: Buy as the price is: 1) Still on the middle of the Channel, 2) The RSI not yet on its 10 month Resistance Zone, 3) The MACD is on a Bullish Cross.
Target: 2670 medium-term (the 2.0 Fibonacci extension, which has been met on all three previous Higher High waves of the Channel Up).
Useful facts: The 1D MA50 (blue trend-line) has been supporting since January 19, 2021. The last time none of the 1D MA50/ MA100 or MA200 were above the price was in April 21, 2020!
Most recent GOOGLE signal:
** Please support this idea with your likes and comments, it is the best way to keep it relevant and support me. **
--------------------------------------------------------------------------------------------------------
!! Donations via TradingView coins also help me a great deal at posting more free trading content and signals here !!
🎉 👍 Shout-out to TradingShot's 💰 top TradingView Coin donor 💰 this week ==> CryptoSurfer007
--------------------------------------------------------------------------------------------------------

Quality matters!I believe it is good to review how functional our analysis is.
I want to share the multi-timeframe analysis I published last week for my Patrons/private subscribers, and let you judge the accuracy of the contents!
Some People think I publish my post to bait people to subscribe to my services!
I challenge them to publish their own analysis and next week we will review whose work has a higher rate of accuracy!
NASDAQ:AAPL
Multi-Timeframe Analysis:
Hourly Chart: Flat Top (Neutral)
Daily Chart: Flat Top (Neutral), rejected from 50 EMA, trading near its support level
Weekly Chart: Flat Top (Neutral) 5 red weeks in a row, last time it happened was October 2018, followed by a 30% correction ( Bearish )
Monthly Chart: Flat Top (Neutral)
Daily average trading value (YTD): Trading 32% below YTD (money outflow) ( Bearish )
Weekly average trading value: lowest since November 2020, 38% below last trading year. ( Bearish )
Monthly average trading value: lowest since February 2020. ( Bearish )
Conclusion: Wait to see if Apple can hold its support line, (be ready for closing your positions if you have the stock)
The most concerning point is :
Whenever Apple's average trading value dropped below its 12 monthly average we saw a correction to the level of 50 EMA /monthly.
NASDAQ:MSFT
Multi-Timeframe Analysis:
Hourly Chart: Ranged below the resistance level (Neutral- Bearish )
Daily Chart: At the support line since Jan 15th, 2021 (Neutral)
Weekly Chart: after 4 negative weeks in a row, slightly positive(1.85)
Daily average trading value (YTD): Trading 33% below YTD (money outflow) ( Bearish )
Weekly average trading value: Trading 24% below last trading year average. (money outflow) ( Bearish )
Monthly average trading value: Trading 14% below last trading year average. (money outflow) ( Bearish )
Conclusion: Wait for reaction to support line. The decreased trading value is seen in all levels (D/W/M) is a concerning pattern!
NASDAQ:AMZN
Multi-Timeframe Analysis:
Hourly Chart: Flat Top (Neutral)
Daily Chart: Moving toward its support line. (Neutral- Bearish )
Weekly Chart: Doji at the middle of the regression channel (Neutral)
Monthly Chart: Pure sideway between 3550-2870 in the past 9 months. (Neutral)
Daily average trading value (YTD): Trading 37% below YTD (money outflow) ( Bearish )
Weekly average trading value: Trading36% below last trading year average. (money outflow) ( Bearish )
Monthly average trading value: Trading 15% below last trading year average. (money outflow) ( Bearish )
Conclusion: Neutral to Bearish in a sideway channel
NASDAQ:GOOG
Multi-Timeframe Analysis:
Hourly Chart: double Top with signs of rejection! ( Bearish )
Daily Chart: Bearish engulfing followed by bearish harami. ( Bearish )
Weekly Chart: bullish regression channel
Monthly Chart: Dragonfly Doji .
Daily average trading value (YTD): Trading 9% below YTD (money outflow) ( Bearish )
Weekly average trading value: Trading 7% above last trading year average. (money inflow) ( Bullish )
Monthly average trading value: Trading equal to the last trading year average. (Neutral)
Conclusion: Neutral to Bearish
NASDAQ:FB
Multi-Timeframe Analysis:
Hourly Chart: Double Top ( Bearish )
Daily Chart: Double Top ( Bearish )
Weekly Chart: at the top of the regression channel ( Bearish )
Monthly Chart: Dragonfly Doji , possible reversal??? (Neutral-Bearish)
Daily average trading value (YTD): Trading 32 % below YTD (money outflow) ( Bearish )
Weekly average trading value: Trading 12% below the last trading year average. (money outflow) ( Bearish )
Monthly average trading value: Trading 5.5% below last trading year average. (money outflow) ( Bearish )
Conclusion: wait for reversal confirmation ( Neutral- Bearish )
NASDAQ:TSLA
Multi-Timeframe Analysis:
Hourly Chart: at the support level of a short-time bullish trend started 12 days ago!(Neutral)
Daily Chart: Bearish Harami and trading below 50EMA ( Bearish )
Weekly Chart: Spinning Bottom in a downward regression channel.
Monthly Chart: Flat Bottom (Neutral)
Daily average trading value (YTD): Trading 42% below YTD (money outflow) ( Bearish )
Weekly average trading value: Trading 26% below last trading year average. (money outflow) ( Bearish )
Monthly average trading value: Trading 27 % below last trading year average. (money outflow) ( Bearish )
Conclusion: Complex Correction with unpredictable moves!
what is your idea about the accuracy of these analyses???
Moshkelgosha

DOT BULLISH NEWS and BULLISH TA - June/July PT $80
DOT News on 6/1/2021
1) DOT ETP Launched in Europe on Swedish Stock Market (Grayscale is next)
cointelegraph.com
2) $USDT announces it will be first stablecoin launching on $DOT & $KSM ecosystems
tether.to
3) Westmine successful on DOT's shell parachain!
twitter.com
4) Kusama upgrading shell to Statemine!
(Same link as above)
Conclusion
Considering that the first 5 auctions on Kusama will roll out every 7 days once the schedule is announced any day - we should see DOT rolling out its first parachain in July... which is amazing considering the best estimates had this pegged at year end for PolkaDot - this is a huge shift in expectations and not many are pricing this in just yet.
Technicals
We're getting a bullish MACD daily cross and the EMA ribbons on 4H are decidedly turning bullish as the 20 is crossing the 34 4H EMA right now as we speak! .... it's especially bullish b/c this is happening the same time that we are getting a bullish cross in the daily MACD.... next up will be the 20 EMA crossing the 55 and the 34 crossing above the 55... DOT is looking more amazing every day on TA and is aligning amazingly well with fundamentals - still not too late to buy.

GOOGLE / GOOGIt is moving in an upward direction
it will correct a little
Going to the support areas shown on the chart
and then returning to complete the upward trend to the target

There is no buyer in the market..!NASDAQ:MSFT
NASDAQ:AMZN
GOOG
NASDAQ:FB
NASDAQ:TSLA
I believe there is no buyer in the market!
look at Tesla, 3 months ago at the same price trading volume was 89 million, today it is 26 million. 71% decrease..! take it seriously.

1st Series of STOCKS Buying Areas!Hi followers and other TradingView users,
My 600th post in TradingView and I need your help (activity) to start a new series. I would like to do something similar with stocks as I do with altcoins.
"Don't put your eggs in one basket." - the old saying but pretty important to achieve financial freedom. Considering that, let's find together some investment opportunities which can start to work for you as fast as possible - properly made technical analysis allows it to do!
I would like to know FIVE of your favorite stocks, criteria to get into the list:
* Name FIVE (max. nr.) of your favorite stocks, full name, and ticker. For example, Apple (AAPL), Tesla (TSLA)...or just ticker, the ticker is a must-have!
* Click the LIKE button of this post.
* Click the follow the get the update as fast as possible.
TOP10 most mentioned stocks get analyzed. I will point out some possible breakout opportunities to buy the strength and corrections to watch. Pointing out some lower levels where your alerts should be set!
I know that the bigger part of my followers has more interest in cryptocurrency but still, try to name your stocks to get into the list, and let's find buying areas for them.
If you look at my related ideas (below of this post), then over the years I have posted quite a lot of stock charts and the success rate of these ideas has been amazingly high!
So, quite an easy task to you, name five of your favorite stocks and you get the investment areas for free, areas that put your money to work for you as fast as possible!
Stay healthy,
Vaido

QQQ holding last trend lineOBV divergence signaled a potential correction, as price were making higher highs, OBV was making a lower high.
On the plus side, we are making higher lows since march lows.
There is a resistance trend line that is still holding, and is now coincident with the 61.8% Fibonacci retracement line.
A buy with a stop below the trend line has worked great the last 3 consecutive times it tested.
If we do keep selling off, I expect the next place we could pause at the $298 level, just below the 200sma.

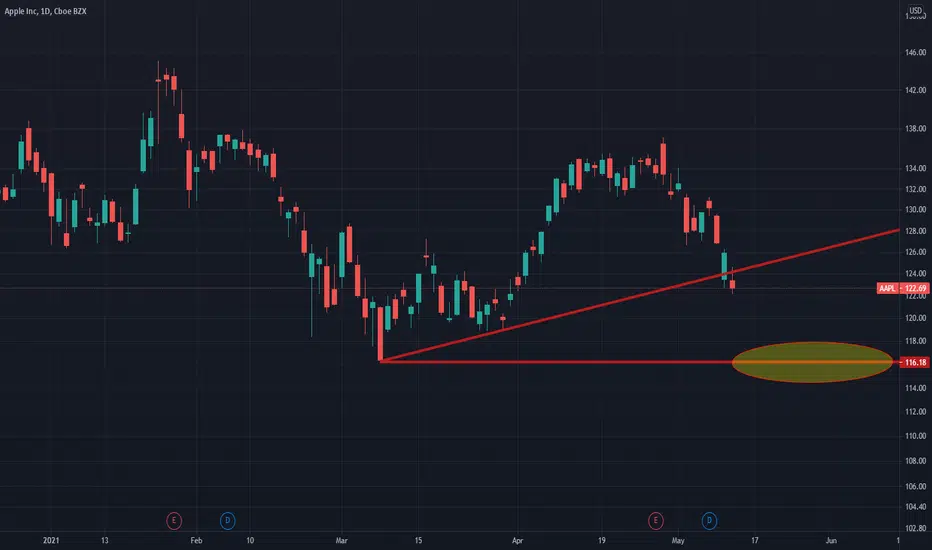
How far Apple could Slip???Those who have early access to my trading ideas have the chance to perform better.
Don't you believe it?
Check my recently private post:
Hourly Chart: Lower border of Megaphone, should be supported around 130. (Neutral)
Daily Chart: Lowest close since April 12, close below daily open in the last 5 trading sessions, and increased volume above monthly average while the price fails to close above daily open is in favor of bearish case! (Bearish)
Weekly Chart: Bearish engulfing after 2 Doji candles. (Bearish)
Monthly Chart: Failure to close above 132.49 in the last 4 months, which means Apple's return in 2021 is slightly negative so far! (Neutral)
Change in Average Dollar Value of Trades: -18% in the first 4 months of 2021 in comparison to the last 4 months of 2020. (Bearish)
Conclusion: Neutral-Bearish in May is the most probable scenario.
Educational Article:
1- Megaphone or Broadening Pattern:
www.investopedia.com
2-Bearish Engulfing:
www.investopedia.com
3-Resistance:
www.investopedia.com
4- Multi-timeframe Analysis:
www.investopedia.com
5-Dollar volume:
www.investopedia.com
If you are interested to have early access to my trading ideas, check the signature box below the post for more information.
What happened yesterday..?The key to success in this market is to know at least 3 things:
1- how retail investors behave?
2- how Algorithms Behave?
3- How big investment firms behave?
Then you can have a good analysis and act based on that:
I asked my private followers to short Tesla for the last 2 weeks and insist to do that yesterday after the Down Gap followed by the big Green candle!
Those who have early access to my trading ideas have the chance to perform better.
Don't you believe it?
Check my recently private post:
Educational Articles:
1- www.investopedia.com
2- www.investopedia.com
3- www.investopedia.com
4- www.investopedia.com
If you are interested to have early access to my trading ideas, check the signature box below the post for more information.

Do not follow ARK invest..!My private followers Just made a+50% to +100% gain by shorting Palantir when it was above 20 yesterday! (buy put 20, May 14, 2021, at 64 cents!)
I don't sell signals, I teach people how to make profits out of market opportunities.
For instance, do you know what type of Gaps were created in most Stocks yesterday, and how you should play them?
My followers know because I send them educational articles below my posts!
I spend 6 months studying the ARK investment behavior and I found most of their tricks..!
While Ark invest has had a great performance of +988% between Feb 2016 and Feb 2021, they had a -38% loss in the last 3 months!
Their best days have gone..! they are trapped in the bubble they created through social media propaganda! I warned people since mid-February 2021!

Exceptional Earning but no bullish move..!Technical review of the biggest 5 market cap companies with Tesla chart in January 2021.
1-Apple:
The good report followed by lower prices in the last 2 days!
2-MSFT:
The bearish two black gapping continuation pattern appears after a notable top in an uptrend, with a gap down that yields two black bars posting lower lows. This pattern predicts that the decline will continue to even lower lows, perhaps triggering a broader-scale downtrend. According to Bulkowski, this pattern predicts lower prices with a 68% accuracy rate.
3-Amazon: another great earning report but failed to close higher.
4-Google: exceptional performance but close 3-4% higher and create a long upper shadow.
5-Facebook:
The hanging man occurs when two main criteria are present:
The asset has been in an uptrend.
The candle has a small real body (distance between open and close) and a long lower shadow. There is little to no upper shadow.
Usually, at the end of any bullish run, prices open at higher levels but fail to close at a higher level. you can see this pattern in all of these tech giants.
If you compare these charts with Tesla's chart in January 2021, you will see the creat similar parents, although they did not experience the hype tesla experienced.
Another thing that makes it more concerning is the average weekly trading value decreased 40-50% in most of the equities in the market!
www.investopedia.com
www.investopedia.com

Google 5% jump holds Nasdaq and S&P500 positiveAs you see Microsoft numbers were better than expected but not enough to push the price higher, and the stock price drops to 20 days ago!
Gooogle outstanding report push it to the upper border of the channel but seems not enough to break above it!
Trim your positions could be the best Idea!

What Is a Bubble?A comparison between Apple, Microsoft, Amazon, Google, Facebook, and Tesla in the past decade.
Top chart: last 10 years
Bottom chart: last trading year
A bubble is an economic cycle that is characterized by the rapid escalation of market value, particularly in the price of assets. This fast inflation is followed by a quick decrease in value or a contraction, which is sometimes referred to as a "crash" or a "bubble burst."
Typically, a bubble is created by a surge in asset prices that is driven by exuberant market behavior. During a bubble, assets typically trade at a price, or within a price range, that greatly exceeds the asset's intrinsic value (the price does not align with the fundamentals of the asset).
The cause of bubbles is disputed by economists; some economists even disagree that bubbles occur at all (on the basis that asset prices frequently deviate from their intrinsic value). However, bubbles are usually only identified and studied in retrospect, after a massive drop in prices occurs.
At the end of a bubble, resources are moved again, causing prices to deflate.
(Investopedia)
How could fundamental analysis explain this phenomenon?
Tesla's stock price has approximately outperformed more than 5x of Amazon, 11x of Apple, 15x of Microsoft, 16x of Facebook, and 30x of Google in the past 10 years.
It becomes more interesting if we look at the total annual revenue and net income of these companies..!
While Tesla had 31.53 Billion revenue and 690 million net income in 2020, in the very same timeframe, Apple had 274.15 Billion in revenue (9x of Tesla) and 57.41 billion net income (83x of Tesla), Microsoft had 143.01 B in revenue and 44.28 B net income (4.5x, 64x of Tesla), Amazon had 386.06 B in revenue and 21.33 B net income (+12x, 31x of Tesla ), Google had 182.35 B in revenue and 40.27 B net income( 5.8x and 58.36 Of Tesla) and Facebook had 86 B in revenue and 29.15 B net income( 2.7x and 42x of Tesla).
Based on the information provided, you can judge if Tesla is experiencing a bubble or not??? to answer this question, you should divide Tesla's stock price behavior from 2011 to May 2019, and what happened after that.
Moshkelgosha

GOOG GOOGL GOOGLE Possible UP channel + Bearish RSI $GOOGL $GOOGPossibly reached the top a channel + A Bearish RSI divergence, correlated with a downward channel @ $AMZN

GOOGL Analysis $GOOGL | #Analysis
Price Target 2270.64 🎯
Bullish Rectangle ✅
Strong Momentum with Increasing Volume ✅
Strong Opening White Marubozu on Daily ✅
Entry on Break of 2145 with Confirmation ✅
Invalidated below 2091 ❌


𝔽𝕒𝕔𝕖𝕓𝕠𝕠𝕜 𝕌𝕡𝕕𝕒𝕥𝕖: $FB Daily. Breaking OutLoves to test the 200dma before moving. Huge triangle wave looks complete and starting a move towards long-term TL in 320-330 area
$QQQ $NDX $NQ_F $GOOG $SPY $VIX #Facebook #ElliottWave #Stocks 📈

GOOG ... We still early on this Triangle!I believe GOOG is a highly interesting setup to the upside at the moment... The pullback seen in FAANGS since the NASDAQ100 made its ATH in Mid-February has barely tickled this stock... This means the bulls are pushing it and momentum to the upside is perhaps much stronger than that of its peers... Moving on to business... Elliot Wave Analysis is my specialty... I go as deep and detailed as one can go in my wave analysis... Wedges / Triangles (you name it) are my signature setups... GOOG is carving out a very convincing Triangle that is just starting to break to the upside.
STOPS should be placed @2043… If the market breaks this level, my analysis becomes invalid… I will not go into detail as to why at the moment… I’d rather go deep in regards to the target price.
In regards to the TARGET, several things need to be pointed out… The NASDAQ100 and therefore, the FAANGS, are a bit risky to be traded to the upside at the moment… The market has been completely spooked by rising yields, which have specifically damaged the FAANGS in the investor’s community… Furthermore; there are certain times where bullish Triangles generate a very impulsive move to the upside, only to be followed by a sharp decline… One needs to remain humble on this trade… Other details could be mentioned, but it should be enough for now, so I’ll go ahead and specify the TARGET recommendation:
2320 should be the first target in upcoming days/weeks… 2400 could be reached and lastly I can see the market reaching as far as 2500… This are all Fib projections… For me personally, even 2320 is way too greedy, given the trading environment we are in… After breaking the 2153 level towards ATH, anything is possible… Perhaps booking profits early in the game, around 2200 and then trailing the stop could be the best way to go… Hope it helps and you have a solid trading.

GOOGLE SHORT IDEA 📉Strong growth without corrections? Lol, ofc no.
I see a weak bearish d.
Such a short is risky, but it is difficult to get around it.


I was BANNED on social media...The stock NASDAQ:GOOG is relevant to this video because they terminated my channel with very little reason. No warnings, strikes, or any further explanation. My heart is in my stomach and I just wanted to share my thoughts today.
I won't stop making content to help people become better traders. This is just a setback in my goal to reach people with actually useful trading ideas.
Thank you to all of my viewers on Tradingview for your good vibes sent my way. It keeps me motivated to know that folks appreciate what I am trying to do!
