𝗔𝗽𝗽𝗹𝗲 𝗨𝗽𝗱𝗮𝘁𝗲: $AAPL Daily. Corrective Move Over?What if instead of a crash like a year ago, we just completed a complex corrective pattern in a bull market? Rare to see bullish divergence on a name like this
$QQQ $NDX $NQ_F $MSFT $AMZN $GOOG $FB $SPY $ES_F $VIX $TNX #Trading #ElliotWave #Stocks
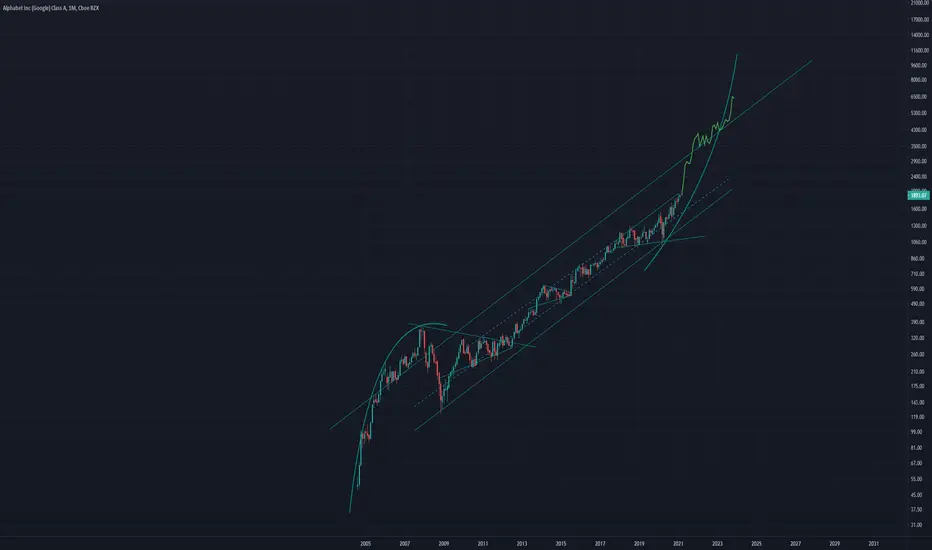
Google (Alphabet)

Correlation study between GOOG & MSFTAs you see these two behave similarly and different from other tech companies!
I believe GOOG will soon follow follow the MSFT.
Both will drop to 200 EMA, At least !!!

Google ideaWould NASDAQ:GOOG go long or short?
I think we might close the gap first and then go long.
Let's wait and see :)

A review on what happened to the Market Cap Titans in this week!WATCHING THEM ALL TOGETHER MAY HELP YOU DECIDE BETTER!
No need to say they have one thing in common, LOWER-highs & LOWER-LOWS and MOST OF THEM SLIPPED BELOW 50EMA!!!
This is the most simple Definition and Sign of the Bearish market!
any bounce back could be an EXIT opportunity.
The bigger the loss becomes, the harder it becomes to accept..!
Moshkelgosha

A Closer Look at the 6 Giant Tech..! CORRECTION phase!I believe when you compare the charts together it will help you to have a better idea of market sentiment.
In this analysis, I put the 6 Giant tech companies which have the highest market cap together, so my followers could have a better and more clear understanding of the new sentiment in the stock market.
It is crystal clear after March 2020 we had experienced an incredible market, but since Feb 2021 it seems the market entered a CORRECTION phase and it is obvious in the charts.
1- Apple: closed below: 50 EMA, closing price of 2020, and more than 10% away from its top. LOWER HIGH-LOWER LOW pattern
2- Microsoft & Alphabet: in Trendlesss Zone in the last 2 trading weeks
3- Amazon: closed below 2020 closing price, lower high pattern, and bearish ladder candle.
4- Tesla: after breaking a trendless zone from the downside experiencing lower trading volume every day. Jan 8, 2021 trading volume 75 million decreased to 18 million in the last trading day.
5- Facebook: closed below 2020 closing price, and below its 50 EMA.
* Interestingly, financial metrics in most of them improved in their last report.
** This doesn't mean we will not experience 1-3 day positive moves, be careful with options trading!
*** This analysis could be a roadmap for short-time traders, and the story could be different for long-term investors.
Please leave your comments below if you think you have evidence contradicting this article.
Moshkelgosha

GOOG (DJI) - So many gaps need to be closedHumbled, we would like to thanks for your support who has already liked, commented and followed us.
Your support, strengthens us, to help in analyzing the market.
GOOG (DJI) - So many gaps need to be closed

GOOGL Clear uptrendBreakout idea
GOOGLE is going to be a major influencer in the next generation of computing and people, as it is today
Hence the large breakout from the upward channel, and seemingly symmetry with the earlier days of google
$F #FORD NEWS pumping Google is expected to assist Ford with everything from in-car infotainment systems and remote, or over-the-air, updates to using artificial intelligence. #Ford #Google $GOOG $F
Twitter @JUANCALDERONT

𝗖𝗵𝗮𝗿𝘁 𝗼𝗳 𝘁𝗵𝗲 𝗠𝗼𝗻𝘁𝗵: $NDX Monthly. Dot Com 2.0?History doesn't repeat itself, but it often rhymes. Was last March like August '98? Have an open mind ...
$NQ_F $QQQ $SOX $ES_F $SPY $SPX $IWM $TLT $TNX $GLD $DXY $VIX #Trading #StockMarket 📈

$GOOGL - Bull Run Cometh$NFLX ripping off earnings makes me very bullish on the rest of blue chips. Want to see price retain it’s upward momentum here - if we can do so my targets are as follows:
Primary - $1858
Extended - $1925
Invalidation - $1740
Timeframe is within the next 1-2 months

FAANG RALLY SCHEDULED FOR EARNINGSVery bullish setup on FAANG which has basically gone sideways for 6 months.

The Tesla Bubble and why P/E Ratio's MatterTesla is high by any standard value or technical view.
Here I use the PE ratio as compared to TSLA, AMZN, AAPL and GOOGL and a super stock I am going to call "Amagoogle" to demonstrate just how overdone I think Tesla is.
To summarize, I will show:
How relative P/E (Price to Earnings Ratio) compare. Growth stocks typically have very high PE ratio's , mature industries like utilities and consumer staples tend to be on the lower side. For a benchmark, the S&P 500 PE right now is 37.97 with it's all time high spike at 123.73 and it's low at 5.31. The average is 15.88. Telsa's is currently 1,637 ! www.multpl.com
If Tesla had Alphabet's earnings but maintained it's current PE, it would have to trade at $84,708 PER SHARE
If Tesla had Apple's very high PE, it would be trading at $45.50 per share.
If Telsa had a double whammy of Alphabet's great EPS AND Apple's arguably very high PE, Tesla would be at $4,709 per share - but that would mean a growth in earnings of 103.58 TIMES.
Book recommendation to help avoid these scenario's: read.amazon.ca
Happy Trading!
Rob

GOOG a sharp retracement is predictedas historical trend indicates, GOOG is highly expected to retrace to the mid-line of the ascending channel or in the worst case to the bottom of the channel or the trend line.

TWTR 1 hour trendlines with bottom supportI still think we have more room to fall. Regardless of your political views, the press has been all over Twitter (and big tech) the last few days and the response hasn't been that great. We can also see that from the massive amount of selling the last 24 hours, specifically on Twitter.
Continue to play PUTS on this. Entering again tomorrow. Was in puts 01/11 but sold the same day.
$TWTR $FB $SPY $GOOG


GOOGLEThe price is heading in a downtrend, and it has completed the correction, and it will continue the decline

GOOG on the waiting list. Any ideas?2020/12/7 Sell indicator
Hope GOOG doesn't break the uptrend channel.
Any ideas?

Big Tech still underperform frm Sep (AAPL, AMZN, MSFT, FB, NFLX)Big Tech still underperforming from Sep (Apple AAPL, Amazon AMZN, Microsoft MSFT, Facebook FB, Netflix NFLX) - with the exception of Google GOOG.

AMZN consolidating; loooking for retest $3500 before march.AMZN has been trading into a consolidation pattern. Looking for bullish price action in the following weeks. PT $3500 (ATH).

Google Potential Decline to SupportIt seems that the upper resistance line is holding strong, Google bounced away from it for a fifth time now. With the bad Brexit news pouring in, I foresee that Google has more room to fall.
My target would be the lower support line, but please do your own DD.

Laggards of the Month Awards4 Big Tech in post-Biden-win periodLaggards of the Month Awards for Big Tech in the post-Biden-win period goes to: Amazon AMZN, Facebook FB and Microsoft MSFT.
Netflix NFLX, Apple AAPL and Alphabet GOOG doing ok. No need to talk about the price of Tesla TSLA stock.

GOOG/Alphabet UPTRENDI believe we will have a short-term bearish move till the trend line because of the MACD divergence.
My entry is after breakout of the purpled area which is FIB PROJECTION 0.618
