Update on Nasdaq Regression Trends, Support and ResistanceUpdating these charts for this week as the market character continues to change. If the NASDAQ is going to return to the regression mid-point lines for 1yr, 2yr, 5yr and 35yr, there is still significant drawdown to happen in the next couple months.
Over the past two weeks, the index has gone up and down, but has consistently followed bearish trend lines, even on up days.
Investors are rotating through sectors looking for safe havens that will hold up well. Real Estate was last week, Energy is this week.
Unless something changes (economic stimulus, other news), I'm still expecting a 0.5-3% drop this week (especially if China-relations further deteriorate from the TikTok stall) and 13-15% into mid-October.
Lots of others expecting these drops as well. Look at Call/Put Ratios and SQQQ Volume continues to be high.
Google (Alphabet)

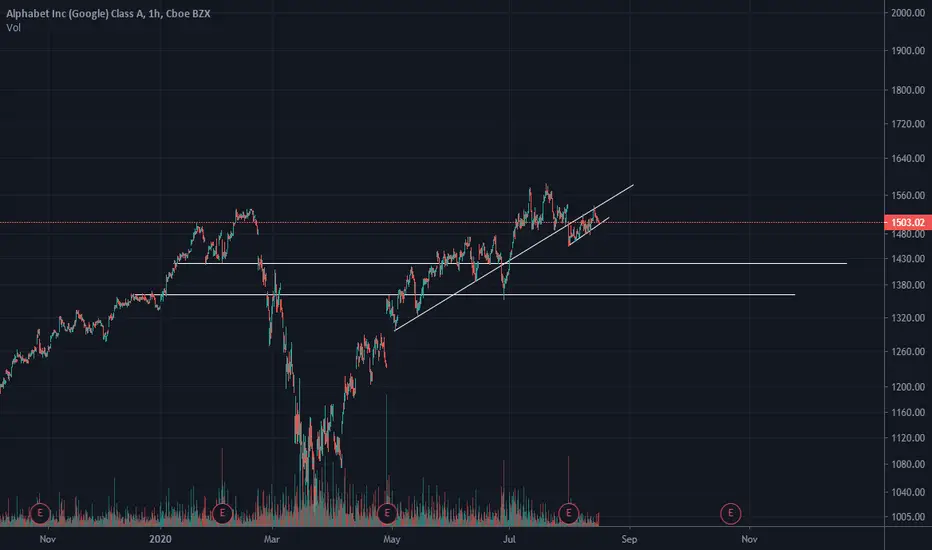
GOOGGOOG traded nicely inside an upside channel.
Had reversal pattern on the bottom of the channel. Looks like it is a good time to join.
First target 1650
Second target 1750
Stop under 1500
Enjoy!

Opening Idea:GOOG facing Difficulties to go higher (explanation)For 4 times, the stock has tested the blue line which was a support and now a resistance, and delivers some bearish signals looking at the upper shadows and the strong volumes.
- For trading: you need to wait for the breaking of the highlighted rectangle, the bearish signals are encouraging to break from below and maybe reach the lower red level of PITCHFORK.
- For investing: I'm still bullish, If you analyze the stock from the beginning of the explosion of prices till now, you will see that the chart is doing an angle of 45° approximately, so it is very difficult to go down, and very risky to go against the trend.

Regression Trends, Support and ResistanceThe broader Nasdaq Composite Index had a great reversal day, but what comes next? The top 4 market cap players were testing support and resistance lines, indicating indecision on where investors think the market will go. Having one of these make a big move either direction would certainly impact the others and the broader index.
Taking a look at overall market, there is a lot of room to move downward if that's the direction that things take. Even in the shorter term of 1 year, the market is very extended beyond the Regression Trend midpoint. There's plenty of support historically, for the market to take a large correction in the other direction to bring the average growth back to the midpoint. In fact, you can see that as 35y, 5y, 2y regression midpoints converge to nearly the same location.
These regression midpoints aren't perfect, but even adding some +/- error to the locations, it still gives the market a lot of room to move down.
Outcomes could be support near the 1y midpoint where you'd also have 200d support and the pivot point of the previous peak. That would be near a 15% decline.
Beyond that, there is not much support until you get to the bottom of the March crash. So another ~15% drop would be feasible.
2020 already claims 3 of the 20 largest percentage drops in Nasdaq history.
And it's 2020 - it wants to be the best at being the worst!


Elliott Wave View: Support Area for Alphabet (GOOGL)Alphabet (GOOGL) 45 minutes chart below shows that the stock has rallied higher from August 10 low. From that low, the stock rallied higher in wave ((iii)), which ended at 1652.79 high. The rally unfolded as a 5 waves impulsive Elliott Wave Structure. Up from wave ((ii)) low, wave (i) ended at 1536.97 high. The dip in wave (ii) ended at 1499 low. The stock then extended higher in wave (iii), which ended at 1608.78 high. Wave (iv) pullback then ended at 1575.04 low. The push higher in wave (v) ended at 1652.79 high. This completed wave ((iii)) in larger degree.
Currently, the stock is doing a pullback in wave ((iv)) to correct the cycle from August 10 low. The structure is unfolding as a double correction. Wave (w) ended at 1618.81 low. The bounce in wave (x) ended at 1647.79 high. Wave (y) lower is in progress. The 100-161.8% extension of wave (w)-(x) where (y) can potentially end is at 1592.53 – 1613.70 area, highlighted with a blue box. If reached, that area can produce 3 waves bounce at least or the stock can resume higher in wave ((v)). The 100% extension from June 29 low, where wave ((v)) could target is at 1689.


Google 2 scenariosstill in the upward channel. but short term does not look ready to brake the resistace with this RSI situation.


INTC : Unpopular opinion, Intel only go up.Unpopular opinion : Intel only go up.
You are not going to short at a mega-monthly support ,are you ?
This is where those bald-headed suits ,hedge funds managers ,and bankers steal your money.
Don't believe what their low IQ analysts says in their un-watchable media .
Intel is here and will remain here for a while .

$GOOGL $GOOGL bounced off our $1541 zone and went to our $1557.37 zone where it consolidated between our $1557.37 zone and our bullish channel resistance. Then exploded the last 2hrs of the market to our $1580 zone and closed the day at our $1576.36 zone.


Market MovesHere is my take on SP500. We are currently seeing the price move to new all-time highs approaching the level of 3393.52 from last February. The question is what will happen next?
A few points:
- The price action is showing a clear bullish layout. The trend analysis does not suggest any change from the current direction.
- If we take a look at similar movements in the past, like the one that took place from September 2018 to May 2019, we can see how the price tends to score a new ATH just before falling back to the 50 days moving average and drop below it for a specular amount.
- The average investor sentiment is overall bearish. Generally, this is a contrarian indicator therefore suggesting that the market will grow.
Taking all of this into consideration we can draw the following conclusions:
At the moment there are more indications of a bullish continuation of the trend in act. I expect the price to reach a new ATH and cause a bullish shift in sentiment which in turn will lead to fear of missing out and a quicker rate of growth. Consequently, a lot of short sellers might be stopped out creating a bullish rush.
This will be the indication of the imminent reversal that should make the price of the index fall about 10%.
I plan on keeping my long positions open until these moves develop. However, I will also increase my SLs to safeguard against a sudden drop.

GOOGL AnalysisNASDAQ:GOOGL
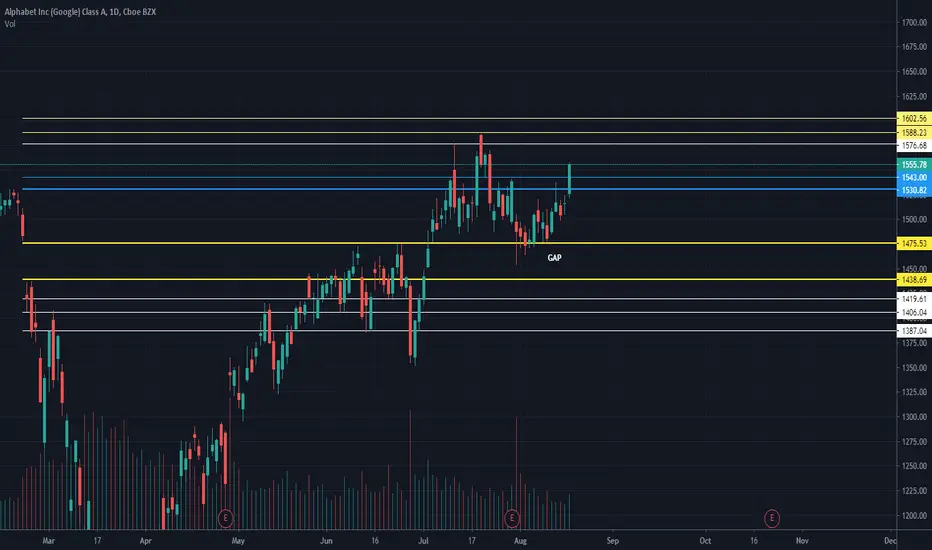
Googl has dropped below its uptrend trend line and riding the bottom of said line. I see a drop to the 1422 support this week or next before any bullish turn around can be realized.
RKT to the moon? Low IR play.Rocket mortgage embodies more of a tech play then a financial IMO. Volume, short-term interest, technicals, and market sentiment suggests this will test $26 before earnings. Volatile play... trade smart.

$TSLA Plays the "Split" Card to Draw in More from Mom and PopTSLA still laughs at us from above that $1300 level. But it's an itch that needs to be scratched -- now lined up with the 50-day and the primary trend line, to boot. But that relief will have to wait a little longer as Elon and the fellas became the second major megacap to hit the "split" button (after AAPL).
Expect a lot more splits this fall now that we are in the first "retail driven" bull market since the 1990's. Who's next? AMZN, GOOG, MSFT, NFLX, BKNG, ISRG...

Big Tech 5 candidates underperforming the NASDAQ from July 13Five Big Tech candidates (Tesla TSLA, Amazon AMZN , Microsoft MSFT , Google / Alphabet GOOG , Netflix NFLX ) underperforming the NASDAQ from July 13, 2020.

Big Tech candidates underperforming the NASDAQ frm July 13, 2020Big Tech candidates (Amazon AMZN, Microsoft MSFT, Google/Alphabet GOOG, Netflix NFLX) underperforming the NASDAQ from July 13, 2020.

Compare Nasdaq Comp to when Big Tech Buzz hit barrier frm July13Compare Nasdaq Composite here (IXIC) to when Big Tech Buzz hit the barrier - buzzing stifled from July 13, 2020 - for Tesla , Amazon, Microsoft , Google / Alphabet , Facebook , Netflix.

Looking for FPAY to test $3.00!Symmetrical triangle built on heavy support. Possible buy opportunity.

GOOG/AAPL spread reached all time lows! Correction expected!After AAPL reported strong earning; and announced the 4:1 split, incoming volume has drove share prices to all time highs. Its possible money is flowing out of certain tech(Goog,Nflx,ZM) and into this beast. This move does however look exaggerated. Looking for the spread to test $5 again, at the very least, $4.

AMZN: Want to get long here, waiting for <3050 entry. Fundenmentals speak for themselves on this one. The CEO is a monster and the company is a machine. Buying any and everything I can get below 3,000. Good luck!
