GoogleI set a curve channel for this play. IF this bounces on the base drop of the curve to make a run up this will be a good ABC run up for a higher high. This is a long play after the bounce. We still have some drops ahead possible. If this retraces this low there looks like a good upside possibility for this run up atleast to retest the previous double top before a retracement.
GOOGL

7/27/22 GOOGAlphabet Inc (Google) Class C ( NASDAQ:GOOG )
Sector: Technology Services (Internet Software/Services)
Market Capitalization: $1.493T
Current Price: $113.60
Breakout Price: $114.80
Buy Zone (Top/Bottom Range): $112.80-$105.40
Price Target: $120.20-$121.80 (1st), $126.40-$129.10 (2nd)
Estimated Duration to Target: 36-38d, 65-68d
Contract of Interest: $QQQ 9/16/22 115c, $QQQ 10/21/22 115c
Trade price as of publish date: $4.60/contract, $6.50/contract

SELL $GOOGL$GOOGL misses Q2 earnings + 75bps FED interest rate hike.
Sending $GOOGL towards $100 mark

$GOOGL we are still in a positive areaGOOGL is to keep on your portfolio.
we are very close to demand level at 105
AVWAP from covid low.

Nice 3 day move in QQQsQQQs have had a nice 3 day move clearing its downtrend line. If it consolidates here for a few sessions and holds $300 area, will then look for it to then move towards next target area of $315. Next week will be crucial with big tech earnings (AAPL, GOOGL, META, AMZN etc.) along with the Fed

GOOGL updateMake it or break it moment for GOOGL before earnings. Fall back to the diagonal trendline, although it's still increasing and also RSI is increasing, let's see if it holds. Tried to break through the resistance multiple times and still trading in a channel. Things are getting tight. Earnings next week.

GOOGL earningsI'd not be surprised to see GOOGL go lower on earnings, towards the $100 zone. Today's action after split wasn't the best considering the most growth stocks were green.

GOOGL consolidatingIn case price moves lower, i will add to the position at the bottom of the channel. This is very similar to the LCID position we traded a couple of weeks ago and gave us over 500% return.

GOOGLE - LONGGoogle appears to have bottomed at a recent support zone that has held numerous time. I know most would identify this pattern as a "bear flag". However, I think keeping an open mind is crucial. Just follow the price.
Currently: good chance Google can bounce up to the top of the zone. From thereon, IF the overall market has steam - this stock can squeeze higher.
SHORT TERM: Bullish

Now I know my ABC, next time will you sell with me?Alphabet - Short Term - We look to Sell at 2306.60 (stop at 2426.25)
The medium term bias remains bearish. The sideways consolidation continued although the market managed to post a significant low at 2037.69. Continued downward momentum from 2393 resulted in the pair posting net daily losses yesterday. Further downside is expected and we prefer to set shorts in early trade.
Our profit targets will be 2001 and 1949.50
Resistance: 2393.70 / 2457.09 / 2490.00
Support: 2114.63 / 2100.92 / 2037.69
Disclaimer – Saxo Bank Group. Please be reminded – you alone are responsible for your trading – both gains and losses. There is a very high degree of risk involved in trading. The technical analysis, like any and all indicators, strategies, columns, articles and other features accessible on/though this site (including those from Signal Centre) are for informational purposes only and should not be construed as investment advice by you. Such technical analysis are believed to be obtained from sources believed to be reliable, but not warrant their respective completeness or accuracy, or warrant any results from the use of the information. Your use of the technical analysis, as would also your use of any and all mentioned indicators, strategies, columns, articles and all other features, is entirely at your own risk and it is your sole responsibility to evaluate the accuracy, completeness and usefulness (including suitability) of the information. You should assess the risk of any trade with your financial adviser and make your own independent decision(s) regarding any tradable products which may be the subject matter of the technical analysis or any of the said indicators, strategies, columns, articles and all other features.
Please also be reminded that if despite the above, any of the said technical analysis (or any of the said indicators, strategies, columns, articles and other features accessible on/through this site) is found to be advisory or a recommendation; and not merely informational in nature, the same is in any event provided with the intention of being for general circulation and availability only. As such it is not intended to and does not form part of any offer or recommendation directed at you specifically, or have any regard to the investment objectives, financial situation or needs of yourself or any other specific person. Before committing to a trade or investment therefore, please seek advice from a financial or other professional adviser regarding the suitability of the product for you and (where available) read the relevant product offer/description documents, including the risk disclosures. If you do not wish to seek such financial advice, please still exercise your mind and consider carefully whether the product is suitable for you because you alone remain responsible for your trading – both gains and losses.

GOOGL is at an interesting spotGOOGL is compressing here and i like setups which can be traded both ways. A break of the lower trendline and fridays lows (2135) should see 2113, 2100 and 2040.
if the trendline holds, we can go long above fridays highs for a trade to 20 daily moving average (2235). 2217 can be minor resistance too.
i am looking at 2220C JUL 8 for a long and 2120P for a short.

Google Macro“Price is a creature of the market’s mood. In booms, it is set by the greediest buyer; in busts by the most fearful seller” – Benjamin Graham

Alphabet | Fundamental Analysis + NEXT TARGET | MUST READ | The countdown has begun. There are less than ten days to go before Alphabet's 20-to-1 stock split on July 15.
Many are undoubtedly contemplating buying up the tech giant's stock before the date. The idea behind such a decision is that Alphabet stock could jump if a lower price attracts an influx of small investors.
That could be a winning strategy. But here are a few reasons not to buy Alphabet stock before the split.
The need for cash in the near term
Never invest cash in a stock that you may need in the near term. The definition of "near term" may vary from person to person. However, a good rule of thumb is not to invest cash that you might need in the next five years.
The past few months have clearly demonstrated why such a cautious stance makes sense. The S&P 500 has experienced its worst first half of the year since 1970. Alphabet is performing worse than the S&P, with its stock down about 25 percent over the year.
There is no guarantee that Alphabet's impending split will serve as a positive catalyst. Amazon also had a 20-to-1 split last month. The company's stock didn't soar but instead fell. Alphabet may well suffer a similar fate.
Lack of diversification
Another straightforward reason why you shouldn't buy Alphabet stock before it splits is that your investments are not sufficiently diversified. The most obvious example of a lack of diversification, in this case, would be the fact that Alphabet already makes up the majority of your overall portfolio.
But you may also have most of your investments in other growth stocks that are highly correlated with the movement of Alphabet stock. In that case, buying Alphabet won't help improve the diversification of your portfolio.
The point of diversification is that it reduces overall risk. The old adage about not putting all your eggs in one basket is more relevant than ever.
Recession Concerns
If you fear a recession is just around the corner, you probably shouldn't buy Alphabet stock before the company does a split. The company's stock has not performed well during previous recessions.
For example, during the Great Recession of 2008 and 2009, Google stock fell more than 60 percent. During the short pandemic recession of 2020, the stock fell 23% below its previous high.
Concerns about the recession are understandable. Nearly 70% of economists surveyed by the Financial Times predict that the U.S. economy will enter a recession next year. Some investors, such as ARK Invest CEO Kathy Wood, believe we are already in a recession.
You may have noticed that none of the above reasons have anything to do with Alphabet itself. The need for cash in the near term, lack of diversification, and fears of an impending recession are legitimate reasons for not buying any stock.
Beyond that, we have not discussed the advantages of buying Alphabet before the split versus buying it after the split. No one knows what will happen next, as there are too many variables.
However, we can think of several good reasons for buying Alphabet that have nothing to do with the split. In particular, the company has an exceptionally strong business market. The likelihood that any competitor could knock Alphabet from its position seems very low.
Alphabet also has many growth drivers. Its core Google advertising business remains strong. Its Google Cloud division continues to show strong growth. And its famous "other bets" (especially Waymo's self-driving car technology business) could also contribute significantly over time.
Reasons to stay away from Alphabet focus on the short term. But for investors focused on the long term, any time could be a good time to buy the stock.

Falling Wedge + Bullish RSI convergence on FAANGAlthough I biased bearish for the past year, the markets are clearly oversold and, furthermore, appear to be showing consolidative pattersn.
FAANG index is also showing bullish consolidation.
We have a falling wedge and a strong bullish RSI convergence.
I believe the recent downturn was also an ABC move.
So, in short, although we are down a lot, we have a very bullish outline despite the bearish macro-narrative.

GOOGL time to buyafter a bearish trend and the creation of a ''Double Bottom'' pattern, we will wait for the confirmation of the breakout of the ''neckline'' after which we can take the buy position

GOOGL Gooogle Buy NowAccording to my chart analysis , GOOGL Show strong signal to buy , buy max as you can .

GOOG Alphabet Stock SplitGOOG 20-for-1 stock split is scheduled to occur on July 15.
Companies that that did stock splits statistically had outperform the market in the 12 months following the split.
I think we will se GOOG trading at $2350 ahead of the split.
Looking forward to read your opinion about it.

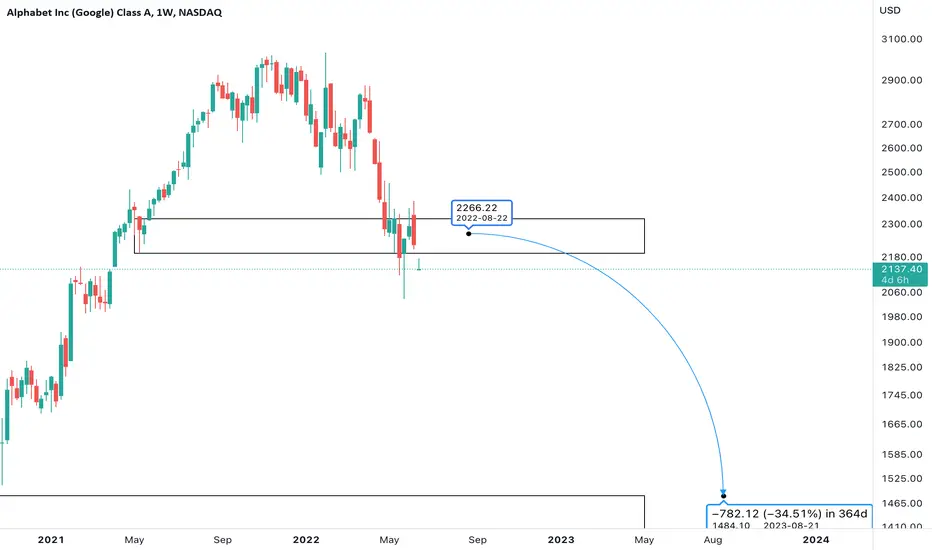
GOOGL WARNING: If 2025 is lost, 1786 will be very fastGoogle is still in a big red channel downtrend sine the ATH at 3042 failing to hold even the median line last week. The lower red channel at 2025 will be tested.
If Google loses the 0.50 Fibo retracement, there will be a totally blank space (green box) until the next Fibo 0.618 at
1786. The decline will be very very quick. This capitulation most likely to happen after some impt catalyst
event. Then a reversal will follow after 1786 holds.
BULLISH CASE: if the black VWAP from pandemic low holds (also near 2025), Google will most probably just bounce off the lower red channel making a divergence with a slightly lower low before rally.
Not trading advice

GOOGLNot financial advice.
The essence of investing & trading is the intelligent and patient preying on the greed, fear, impatience, addiction and ignorance of the majority. It's definitionally Darwinian.
GOOG time to buyafter the downtrend that we had we will see a big movement of an uptrend we can take the buy position after the confirmation of the range breakout

GOOGL dailyGreen zones are potential good area to average in shares.
+ Back over 20day SMA
+ Need to hold blue zone, confluence with 20day
+ Historically good moving average: 150 weeklySMA
- Still not above neutral
- Declining moving averages (resistance on a uptrend)
- 2 gaps remaining
- This yellow box can look like a distribution phase after a long run up, we would now need to wait a new accumulation phase to get back in

GOOGL continues to trade downToday GOOGL approached the resistance trendline, which is likely to be the selling point or a supply zone. If that is the case a new lower low should be produced within the next couple of weeks.

Beginning of an End.Have you ever asked yourself why Musk is migrating to Twitter? Tesla is gone...
A year from now and it will be trading below $200.
The channel broke today and it needs a SHARP pull-back in next 3 days to survive, will that happen? No...
