GOOGL bullish swingtradeCOULD also be a decent spot to add to some long term positions? Bouncing off of the 100 SMA. Trend looks nice! It's googl.... ALso, I like this 'bear shat' pattern ;-)
GOOGL


GOOG to be declared a monopoly soon target $742Bill is moving forward with even more support to break up Googles racket of digital advertising which accounts for 80% of income. Bill will make them sell their advertising broker division so they cant set their rates. Government says theyve been marking up as high as 42%.
If this bill passes Google gonna have a 60% drop. They still will have a monopoly on the search engine. So they will likely continue buying up more websites and manipulating results to place thiers up top. Just like they did when they invested in retailmenot and the other coupon sites.
Not financial advice but be careful


GOOG Potential Bullish Rise | 28th April 2022We are expecting price to rise from buy entry level of 2232.42 which lines up with 100% fibonacci projection and -61.8% fibonacci expansion towards the take profit level of 2385.24 in line with 61.8% fibonacci retracement and 100% fibonacci projection . Alternatively, price might break through key pivot level and trigger a dip towards the stop loss level of 2152.98 which lines up with previous horizontal pullback support.
Any opinions, news, research, analyses, prices, other information, or links to third-party sites contained on this website are provided on an "as-is" basis, as general market commentary, and do not constitute investment advice. The market commentary has not been prepared in accordance with legal requirements designed to promote the independence of investment research, and it is therefore not subject to any prohibition on dealing ahead of dissemination. Although this commentary is not produced by an independent source, FXCM takes all sufficient steps to eliminate or prevent any conflicts of interest arising out of the production and dissemination of this communication. The employees of FXCM commit to acting in the clients' best interests and represent their views without misleading, deceiving, or otherwise impairing the clients' ability to make informed investment decisions. For more information about the FXCM's internal organizational and administrative arrangements for the prevention of conflicts, please refer to the Firms' Managing Conflicts Policy. Please ensure that you read and understand our Full Disclaimer and Liability provision concerning the foregoing Information, which can be accessed on the website.

GOOGLNot financial advice.
The essence of investing & trading is the intelligent and patient preying on the greed, fear, impatience, addiction and ignorance of the majority. It's definitionally Darwinian.

GOOGL Earnings Miss | YouTube revenue disappointsYouTube has more than 2bn monthly users.
YouTube revenues rose 14% to $6.9bn, below the $7.5bn expected by analysts.
YouTube revenue disappoints on growing TikTok competition concerns and Ukraine war which impacted YouTube ads.
GOOGL 23% increase in revenue in Q1 to $68bn, but below forecasts for $68.1bn.
In 2021, revenues increased 34%.
Considering the above, future growth is not so sure.
I expect a retracement to the $2100 level.

$GOOG Key Levels, Analysis, & Targets $GOOG Key Levels, Analysis, & Targets
—-
I am not your financial advisor. Watch my setups first before you jump in… My trade set ups work very well and they are for my personal reference and if you decide to trade them you do so at your own risk. I will gladly answer questions to the best of my knowledge but ultimately the risk is on you. I will update targets as needed.
GL and happy trading.
IF you need anything analyzed Technically just comment with the Ticker and I’ll do it as soon as possible…

Google broken through key support? Alphabet
Short Term - We look to Sell at 2458.30 (stop at 2544.79)
Preferred trade is to sell into rallies. Previous support level of 2500.00 broken. Trading volume is increasing. The bias is still for lower levels and we look for any gains to be limited. Trading has been mixed and volatile. We look to set shorts in the early trade.
Our profit targets will be 2173.56 and 2014.00
Resistance: 2500.00 / 2800.00 / 3000.00
Support: 2300.00 / 2000.00 / 1800.00
Disclaimer – Saxo Bank Group. Please be reminded – you alone are responsible for your trading – both gains and losses. There is a very high degree of risk involved in trading. The technical analysis, like any and all indicators, strategies, columns, articles and other features accessible on/though this site (including those from Signal Centre) are for informational purposes only and should not be construed as investment advice by you. Such technical analysis are believed to be obtained from sources believed to be reliable, but not warrant their respective completeness or accuracy, or warrant any results from the use of the information. Your use of the technical analysis, as would also your use of any and all mentioned indicators, strategies, columns, articles and all other features, is entirely at your own risk and it is your sole responsibility to evaluate the accuracy, completeness and usefulness (including suitability) of the information. You should assess the risk of any trade with your financial adviser and make your own independent decision(s) regarding any tradable products which may be the subject matter of the technical analysis or any of the said indicators, strategies, columns, articles and all other features.
Please also be reminded that if despite the above, any of the said technical analysis (or any of the said indicators, strategies, columns, articles and other features accessible on/through this site) is found to be advisory or a recommendation; and not merely informational in nature, the same is in any event provided with the intention of being for general circulation and availability only. As such it is not intended to and does not form part of any offer or recommendation directed at you specifically, or have any regard to the investment objectives, financial situation or needs of yourself or any other specific person. Before committing to a trade or investment therefore, please seek advice from a financial or other professional adviser regarding the suitability of the product for you and (where available) read the relevant product offer/description documents, including the risk disclosures. If you do not wish to seek such financial advice, please still exercise your mind and consider carefully whether the product is suitable for you because you alone remain responsible for your trading – both gains and losses.

Google (NASDAQ: $GOOG) Just Search It, Mi Amigo! 🍕Alphabet Inc. provides various products and platforms in the United States, Europe, the Middle East, Africa, the Asia-Pacific, Canada, and Latin America. It operates through Google Services, Google Cloud, and Other Bets segments. The Google Services segment offers products and services, including ads, Android, Chrome, hardware, Gmail, Google Drive, Google Maps, Google Photos, Google Play, Search, and YouTube. It is also involved in the sale of apps and in-app purchases and digital content in the Google Play store; and Fitbit wearable devices, Google Nest home products, Pixel phones, and other devices, as well as in the provision of YouTube non-advertising services. The Google Cloud segment offers infrastructure, platform, and other services; Google Workspace that include cloud-based collaboration tools for enterprises, such as Gmail, Docs, Drive, Calendar, and Meet; and other services for enterprise customers. The Other Bets segment sells health technology and internet services. The company was founded in 1998 and is headquartered in Mountain View, California.

Breakdown in Alphabet Inc...Chart is self explanatory. Entry, Targets and Stop Loss are mentioned on the chart.
Disclaimer: This is for demonstration and educational purpose only. This is not buying or selling recommendations. Please consult your financial advisor before taking any trade.

Trade Setup For Google stockGoogle stock is likely to keep dropping for now.
Going back to 2020 Covid19 zone.

GOOGLE FORCASR- on the weekly chart : the price broke the level downward with a very big red candle
- on the daily chart : a very big candle in the last day of the week with an important volume
- personal opinion : the big red candle with the big volume under the level could indicate the sellers their profit and an equal big green candle will appear next or could also indicates the presence of the sellers that will push the price even lower
- best move : wait until we see a confirmation on the 15 min chart on monday . and that confirmation is if the price breaking the VWAP and went up then go in as buyers . but if it got broken with a brearish movment then sell

Does GOOG Give Free Money?Before you become upset that its a line chart, understand that it looks much more confusing with 2 sets of candles.
How to make Free Money In The Past: When GOOG is higher than GOOGL, short GOOG and go Long GOOGL, when they meet exit both and take the payday. There is no guarantee they ever meet again, but if either of them should be trading higher, its GOOGL not GOOG.

GOOGLE UPDATE - on the daily chart : massiive red candle put the price down but didnt hit the stop loss yet
- best move : dont do anything until today's candle form
GOOGLE UPDATE (HOLD YOUR POSITION)- on the daily chart : a very descent green candle appeard yestrday with a more important volume assuring us that the uptrend will continue
- personal opinion : the up trend will continue for the next few days
- best move : Hold your position and fill up your pockest with money

GOOGLE UPDATE (BUY/DOUBLE)- on the daily chart : google gave us a strong green candle after bouncing of the level confirming the new uptrend
- best move : buy now or double your position if you could
Google Ready to Bounce?Alphabet
Short Term - We look to Buy at 2524.87 (stop at 2472.74)
We look to buy dips. Previous support located at 2500.00. The medium term bias remains bullish. Although this gives the medium term bias a mild bearish edge, we expect intraday trading to continue to be mixed and volatile. Trading close to the psychological 2500.00 level.
Our profit targets will be 2677.46 and 2826.06
Resistance: 2700.00 / 2850.00 / 3000.00
Support: 2500.00 / 2400.00 / 2220.00
Disclaimer – Saxo Bank Group. Please be reminded – you alone are responsible for your trading – both gains and losses. There is a very high degree of risk involved in trading. The technical analysis, like any and all indicators, strategies, columns, articles and other features accessible on/though this site (including those from Signal Centre) are for informational purposes only and should not be construed as investment advice by you. Such technical analysis are believed to be obtained from sources believed to be reliable, but not warrant their respective completeness or accuracy, or warrant any results from the use of the information. Your use of the technical analysis, as would also your use of any and all mentioned indicators, strategies, columns, articles and all other features, is entirely at your own risk and it is your sole responsibility to evaluate the accuracy, completeness and usefulness (including suitability) of the information. You should assess the risk of any trade with your financial adviser and make your own independent decision(s) regarding any tradable products which may be the subject matter of the technical analysis or any of the said indicators, strategies, columns, articles and all other features.
Please also be reminded that if despite the above, any of the said technical analysis (or any of the said indicators, strategies, columns, articles and other features accessible on/through this site) is found to be advisory or a recommendation; and not merely informational in nature, the same is in any event provided with the intention of being for general circulation and availability only. As such it is not intended to and does not form part of any offer or recommendation directed at you specifically, or have any regard to the investment objectives, financial situation or needs of yourself or any other specific person. Before committing to a trade or investment therefore, please seek advice from a financial or other professional adviser regarding the suitability of the product for you and (where available) read the relevant product offer/description documents, including the risk disclosures. If you do not wish to seek such financial advice, please still exercise your mind and consider carefully whether the product is suitable for you because you alone remain responsible for your trading – both gains and losses.

GOOGLE BUY- on the weekly chart : a hard dive down in the past few weeks back to the level of resistance
- on the daily chart : the price been moving down with steady a strong movements as we can see in those red candles but as we can notice in the past 3 days , a green candle warning us about the lost of selling pressure
- on the 15 min chart : a breaking of the VWAP upwards early this morning confirm the lost of selling pressure
- personal opinion : the lost of selling pressure might be a warning that the big players are getting ready to take their profits, i give it a 85% that in the next few days the price will know a strong climb upwords
- best move : wait until we see a breaking of the VWAP on the 15 min chart tomorrow . when that happens open a position as a buyer and dont sell until it reachs the upper level
contact me if you want me to keep an eye and update you daily on a stock/crypto/forex/future.... of your choice

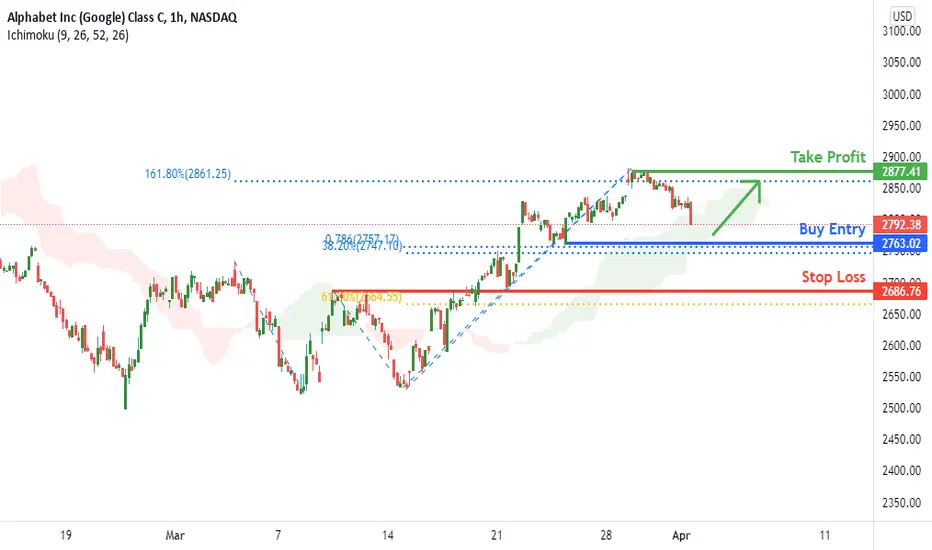
GOOG Potential for Bullish Bounce | 1st April 2022Price is near buy entry level of 2763.02 in line with 38.2% fibonacci retracement and 78.6% fibonacci projection. It can potentially bounce to the take profit level of 2877.41 in line with 161.8% fibonacci extension. Our bullish bias is supported by price trading above ichimoku cloud indicator.
Any opinions, news, research, analyses, prices, other information, or links to third-party sites contained on this website are provided on an "as-is" basis, as general market commentary, and do not constitute investment advice. The market commentary has not been prepared in accordance with legal requirements designed to promote the independence of investment research, and it is therefore not subject to any prohibition on dealing ahead of dissemination. Although this commentary is not produced by an independent source, FXCM takes all sufficient steps to eliminate or prevent any conflicts of interest arising out of the production and dissemination of this communication. The employees of FXCM commit to acting in the clients' best interests and represent their views without misleading, deceiving, or otherwise impairing the clients' ability to make informed investment decisions. For more information about the FXCM's internal organizational and administrative arrangements for the prevention of conflicts, please refer to the Firms' Managing Conflicts Policy. Please ensure that you read and understand our Full Disclaimer and Liability provision concerning the foregoing Information, which can be accessed on the website.
My HIGHEST CONVICTION trades of 2022 - Amazon and GoogleThis is the chart video for my Best of Us Investors production detailing why I put Amazon NASDAQ:AMZN and Google NASDAQ:GOOG as my highest conviction trades of 2022. The past tech stock splits of Apple NASDAQ:AAPL Tesla NASDAQ:TSLA and NVidia NASDAQ:NVDA inform my thesis going into these future splits.

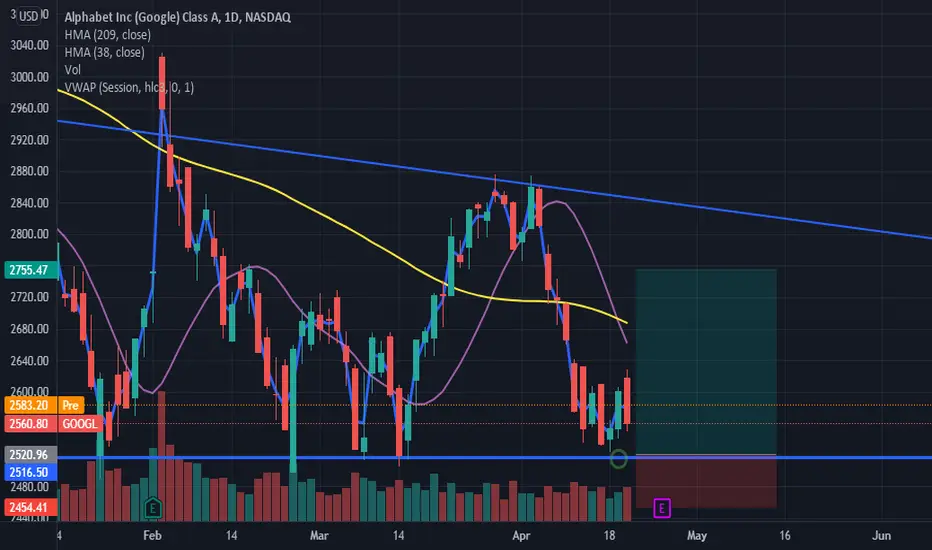
Alphabet Trend Briefing - 24th March. 2022When looking at a combination of indicators on the 15-minutes chart that best represents Alphabet's recent volatility, Mutiple kind of resistance line was found. When examining the minimum threshold for MACD and RSI, it shows strong support at the $2518 level. Using the red line as a stepping stone, stock prices are currently active around the yellow line at the $2674. Additionally, It is speculated that the first downside is not the real downside on the indicator.

Will Google's stock go down?Will Google's stock go down?
The answer is yes, according to my future view of the price, it will reverse as I specified from the entry area 2868. I do not recommend buying after this price, because it will rise a little and then go down to the 2507 retracement area.
