CMGCMG EARNINGS ARE ON WEDNESDAY AFTER CLOSE. THERE IS A 94 POINT MOVE PRICED IN.
I WOULD GO LONG OVER 1360.
LOTTO TRADE IDEA: 1400C BID/ASK: 23.10/24.00
GOOGL

My vision for the next weekOn dayli chart we can clearly see a Cup and Handle pattern with is bullish.
On the next week I can see a downtrend(Handle part of The Pattern) continuation.
Then everything depends on sentiment, news, and earning expected to come from TSLA, MSFT, FB, AAPL, TSLA, GOOGL, AMZN.
I'm staying bullish though.

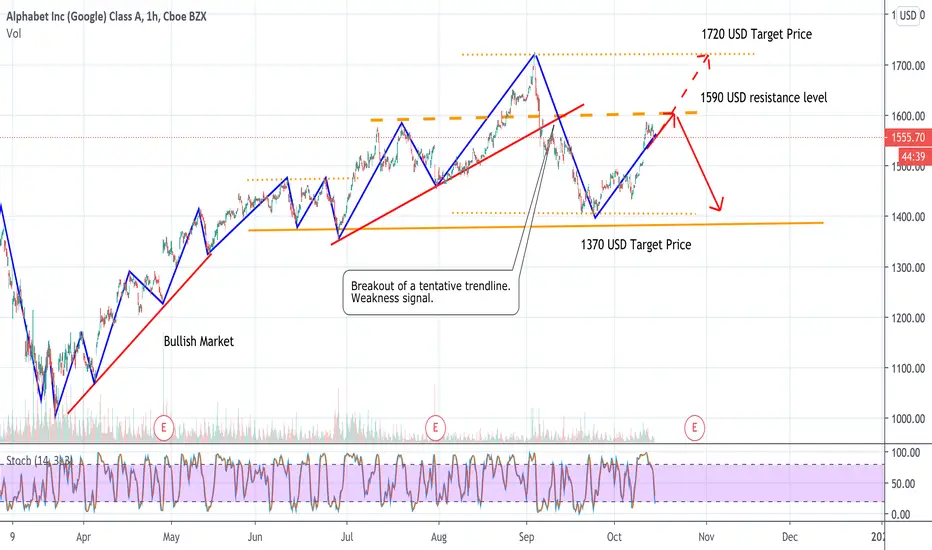
Google Stock AnalysisGoogle Stock Analysis - Google stock forecast today (week 19/09/20) - Alphabet Stock Analysis
Hold for now: If the Market in the next days/week will close above 1590 USD there might be a possibility to go long otherwise just hold.
NASDAQ:GOOGL

GOOGL possible short?Google appears to have created a 5 wave pattern and finished a possible A wave. If price action looks good in the next couple of days a short would be a good trade with a SL above the zone. We'll see how Google moves in the next couple of days and weeks. Good luck everyone.

AAPL UPDATE:
AAPL CLOSED OVER 116 ON FRIDAY. LEVELS ABOVE ARE, 119 123.
Apple event will be on Tuesday at 10 a.m. PDT.
**There was lots of call buying on Friday.

TGTTGT CAN CONTINUE HIGHER TOWARDS 168 THIS WEEK.
Target partnership with FAO Schwartz includes Barbie Dream expected to be best seller of the year.
Target will run two days of deals on Oct. 13 and 14.


Bullish engulfing on daily, 4 hour bullish as wellBullish engulfing on daily. Fibonacci levels .382 = $1520 could be resistance, Looking for earnings run up before Oct 26. Options analysis - Volume from Oct 9th. Oct 16 - 1200 $1520 calls, 1000 $1530 calls, 1800 $1550 calls. Nov 20 - Huge OI in 1500 and 1500 calls, Put/all ratio .35. Of course, any bad Trump news could flush the market. Trade safe if you are swinging in this market!

MSFT and Big Tech start the next move up? EARNINGS & ELECTIONBig Tech companies are looking really interesting, there is a lot of upside potential in the market and we could see the tech moves really help the rest of the market push up in terms of overall ETF indices. We have seen the lag of a lot of companies in the S&P 500 but this could be the return to value after the 15-20% drop in big tech.
We have seen multiple head and shoulders patterns form on tech across the board. The FAANG and MSFT. However, we are in an interesting and turbulent time right now. We are coming into a period where naturally we see increased volatility and the potential for anything to happen. However the closer we get to this debate, the more bullish it looks, the outcome of it will bring uncertainty but I feel that they may be priced into the market. It's well known that the president won't be known for weeks or months after and the market hasn't reacted poorly.
The only bearish reaction was that Trump announced no stimulus until after the election. We'll see if his hand gets forced. The Federal Reserve is also talking about perma stimulus that they will have to navigate through. Or at least high dovishness.
Meaning that big tech, for the most part and MSFT are stuck here, complacent without a real trend waiting to see what happens. There is potential for the upside as we are moving along and we are creating higher lows on all but 2 massive tech companies.
With the potential of the S&P 500 and the big tech stocks to break their most recent tops, we could see that bull side open up and all-time highs get hit. The deciding level to the downside is around each stock's 100-day moving average, most of which are well away from that now and making ground to the bull side.
We also have earnings season coming up, there are limited if any expectations for a lot of companies out there, with minimal forward guidance. Meaning any positive number looks like a beat considering last quarters' extremely negative GDP number. Even slight beats in earnings will help the upside in these companies.
This does not constitute investment advice, or trading advice this post is for educational purposes only.

GOOGLE SHORT📉 NASDAQ:GOOGL SHORT H4
🛒SELL BELOW = 1446.35
🎯Target1 = 1415.95
🎯Target2 = 1397.15
🎯Target3 = 1366.75
🛑Stop loss or cancel trade = 1495.60
🙈Recommended risk = (1%-2%)


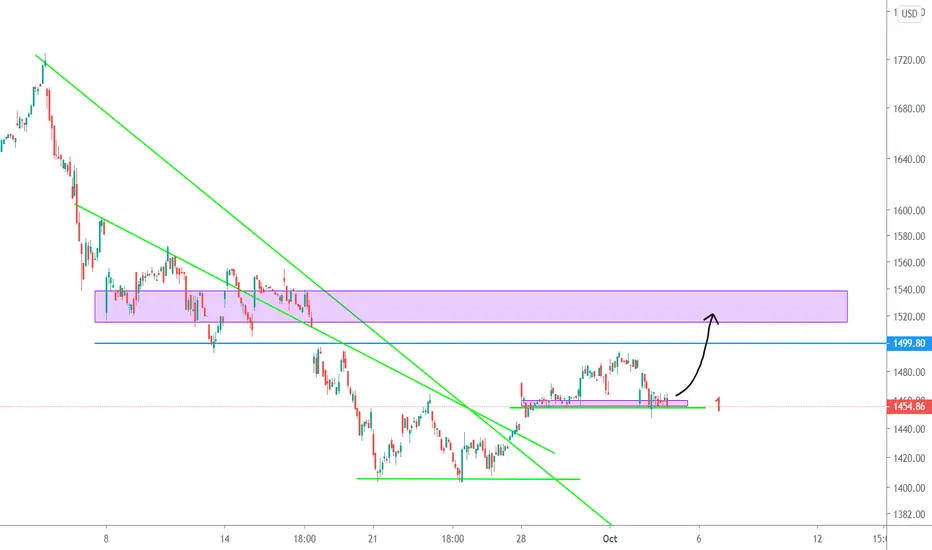
GOOGL/Alphabet is going to be bullish IF...IF the price wont break the '1' line which is located on the chart, GOOGL is going to be bullish with ease up to 1500$.

4 hourly bearish?H & S is forming.. confirmed by daily and weekly chart. I still am looking at the support as noted.


GOOG: Some scenarios to work with.Hello traders and investors! Let’s look at Google today!
The hourly chart tells us that we are in a short-term bull trend, after GOOG did a double bottom pattern at the purple line. Now it is doing higher highs/lows , a characteristic of a bull trend.
The black line at $ 1,476.10 was a pivotal point , and the previous resistance, which now is supposed to work as support. Under this line, the situation starts to get dangerous for Google, and if it loses the 21 ema, would be even worse.
But as long GOOG continues to trade above these points, it will seek the $ 1,520, attracted by the gap.
Now, let’s see the daily chart:
The problem is that Google still must face the 21 ema in the daily chart , and this is the only thing that could ruin the short-term bull trend.
The trend is quite bearish in the mid-term, but at least it is trading above the black line at $ 1,464, which is an important point for the stock. If GOOG loses it, along with the supports in the hourly chart, the target would be a retest of the purple line at $ 1,410.
The situation is not easy to analyze, but these are the scenarios we can work with GOOG now, and if this analysis helped you, please, support it ! And follow me to keep in touch with my daily analyses.
I wish you all the best of luck.

NEW PHONE COMING - GOOGLE can have high coffee time!New phone coming, and today important day for google.
Let see or the coffee time will be right at high area.

KMXI WOULD GO SHORT UNDER 92. LEVELS BELOW ARE 89, 85
GO LONG OVER 100
TRADE IDEA: 90P 10/2. BID/ASK: .65/.85

Is GOOGL/Alphabet going to bull??I believe we have a good entry point after the pullback with considering the next resistance line as TP.

Google has tested ma200 twice now. Time to go up.MACD will soon cross up and we're at the end of the bearish trend in NDX. Google seems like a good long from here.
Target :1500-1600
