These 3 Big Tech also-rans underperforming NASDAQ since Apr 2020These three Big Tech also-rans a bit limp in performance, underperforming the Nasdaq Composite Index, since April 2020 (i.e. Microsoft MSFT, Alphabet GOOG and Netflix NFLX... as opposed to Apple AAPL, Amazon AMZN and Tesla TSLA).
GOOGL


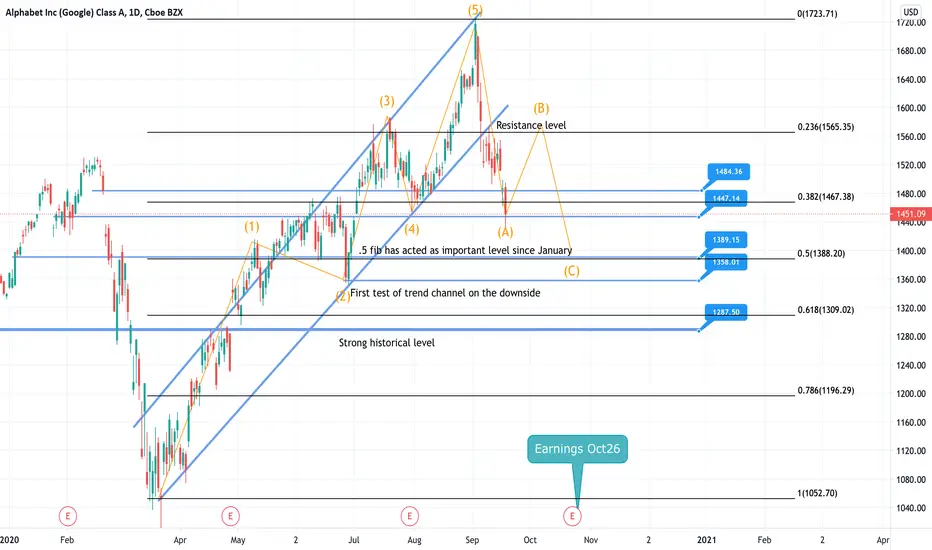
GOOGL Swing TradingNASDAQ:GOOGL has broken its trend channel and seen some major downside. Due to TikTok news and the tech slide GOOGL could possibly rally next week before facing more downside into the week of its earnings. Pictured are Elliots wave and its correction along, the thickest line was taken from the weekly chart and has proven as a key level over the years.
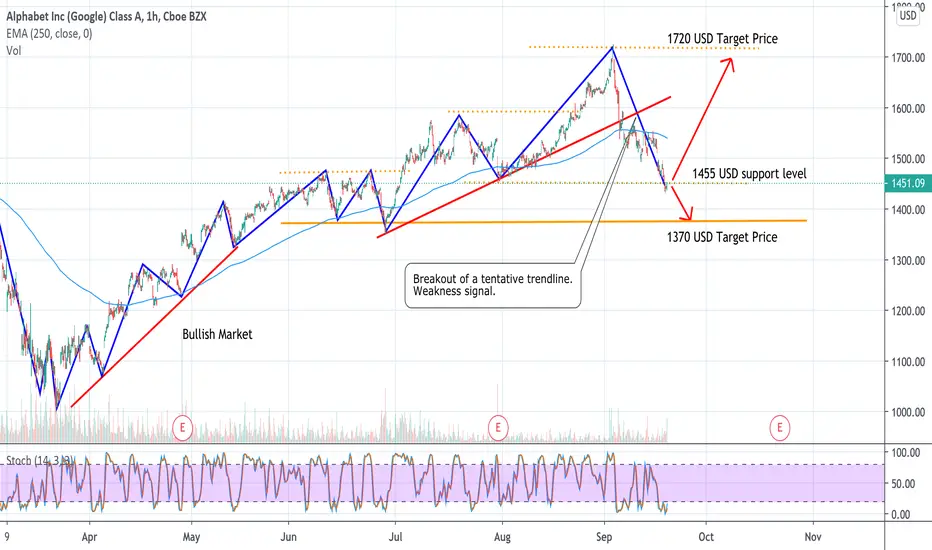
GOOGLE Stock Analysis With Technical AnalysisHold for now: If the Market on Monday and Tuesday will close above 1455 USD there might be a possibility to go long otherwise just hold.
Drop it Like its Hot.GUH.
September Short.
Convergence of Nikkei, Shanghai Composite, NDX.
Quad Witch
Rebalance
Fear
Every Rip is Sold
Big Tech AntiTrust Probes
JPMorgan, Bloomberg Trying to Crash Market.
Fed Pump of 500B of 10/14 will come too late (RIP Powell)
Potential Trade War Tensions
Corona Resurgence
Spain
Max Pain of Options is 280
Linear Regression
Election
martinshkreli.com
the only way we go up is if softbank or some big bank buys a bunch of far OTM calls for cheap to lift markets. and then stonks only go up and then we get free tendies.

GOOGGOOG traded nicely inside an upside channel.
Had reversal pattern on the bottom of the channel. Looks like it is a good time to join.
First target 1650
Second target 1750
Stop under 1500
Enjoy!

GOOGLE SHORT📉 NASDAQ:GOOGL SHORT H4
🛒SELL BELOW = 1515.70
🎯Target1 = 1478.80
🎯Target2 = 1456
🎯Target3 = 1419
🛑Stop loss or cancel trade = 1575.60
🙈Recommended risk = (2%-3%)
#GOOGL #GOOGLSHORT #SHORTGOOGL #GOOGLSELL #SELLGOOGL

Opening Idea:GOOG facing Difficulties to go higher (explanation)For 4 times, the stock has tested the blue line which was a support and now a resistance, and delivers some bearish signals looking at the upper shadows and the strong volumes.
- For trading: you need to wait for the breaking of the highlighted rectangle, the bearish signals are encouraging to break from below and maybe reach the lower red level of PITCHFORK.
- For investing: I'm still bullish, If you analyze the stock from the beginning of the explosion of prices till now, you will see that the chart is doing an angle of 45° approximately, so it is very difficult to go down, and very risky to go against the trend.

GOOGL 1D BEAR FLAGBear Flags are Ranges that are repeatable trading chart patterns.
Bear Flag chart patterns will have a directional bias depending on the previous incoming trend (short trade).
Each chart pattern will have defining trendlines of the support/resistance levels creating the pattern.
Whatever time frame you are trading this chart pattern, wait for a candle close outside of the trendline in the direction of the breakout candle. (Our time frame preference is the Daily chart).
Add volume indicator - Volume is the amount of $ that went into a particular candle or in Forex the # of trades that took place.
Add ATR indicator - Volatility is the amount of price movement that occurred. Use the ATR to measure the price movement.
When you see descending Volume bars and descending ATR line (which indicates volatility) this shows
a dis-interest in traders to invest in this pair creating consolidation which creates the chart pattern.
Trade Management after there is a breakout candle close.
1 - Position size (compare volume bar to volume ma line).
a - Breakout candle must be 100% of average volume for a full position size.
b - If 75% of average volume then ½ position size. (To find 75% of Volume
look at the charts volume settings – divide smaller # into larger # = 75%+)
2 - Enter two trades.
3 - SL for both trades will be 1.5 x ATR.
4 - 1st trade TP will be 1 x ATR.
5 - No TP on 2nd trade – letting profit run and adjusting SL to follow price.
6 - When 1st TP hit – move 2nd trade SL to breakeven.
7 - Adjust the 2nd trade SL to follow price.
*8 – After Breakout candle – if price closes back into chart pattern close trade
*9 - When breakout candle is more than 1 ATR from breakout candle open.
a - Enter 1st trade at candle close with ½ position size.
b - Enter 2nd trade with a pending limit order that is 1 ATR of breakout candle open.
c – Price should pullback to that pending limit order for 2nd trade.
d – If Price returns back into chart pattern close trade before SL is hit.


Elliott Wave View: Support Area for Alphabet (GOOGL)Alphabet (GOOGL) 45 minutes chart below shows that the stock has rallied higher from August 10 low. From that low, the stock rallied higher in wave ((iii)), which ended at 1652.79 high. The rally unfolded as a 5 waves impulsive Elliott Wave Structure. Up from wave ((ii)) low, wave (i) ended at 1536.97 high. The dip in wave (ii) ended at 1499 low. The stock then extended higher in wave (iii), which ended at 1608.78 high. Wave (iv) pullback then ended at 1575.04 low. The push higher in wave (v) ended at 1652.79 high. This completed wave ((iii)) in larger degree.
Currently, the stock is doing a pullback in wave ((iv)) to correct the cycle from August 10 low. The structure is unfolding as a double correction. Wave (w) ended at 1618.81 low. The bounce in wave (x) ended at 1647.79 high. Wave (y) lower is in progress. The 100-161.8% extension of wave (w)-(x) where (y) can potentially end is at 1592.53 – 1613.70 area, highlighted with a blue box. If reached, that area can produce 3 waves bounce at least or the stock can resume higher in wave ((v)). The 100% extension from June 29 low, where wave ((v)) could target is at 1689.

CAKE AS LONG AS CAKE CAN HOLD OVER 30.41 IT CAN MAKE A MOVER HIGHER TOWARDS 33.50.
TRADE IDEA: 35C 9/18
BID/ASK: .55/.60

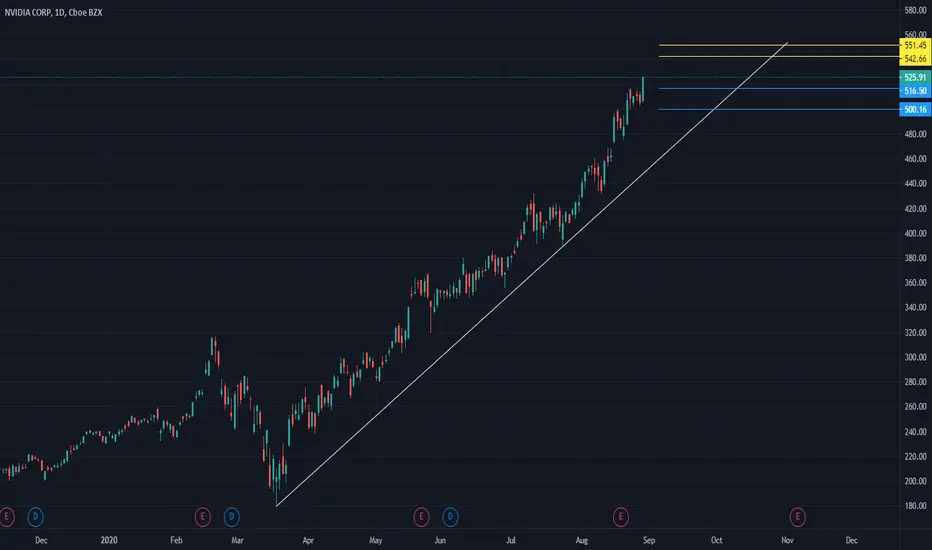
NVDANVDA CAN SEE 542, 550 NEXT. NEEDS TO HOLD ABOVE 516 TO CONTINUE MOVING HIGHER.
TRADE IDEA: 550C 9/4
bid/ask: 6.05/6.20
GOOGL SMACKED AT $1700GOOGL has a major yearly trend line resistance that coincidentally hits @~$1700. Following historical trends, google should fail and retest the bottom yearly support trend line. Depending on what happens with the election google could once again fail that line and head to the next support line. $1500 will be retested at some point.

Google 2 scenariosstill in the upward channel. but short term does not look ready to brake the resistace with this RSI situation.

GOOGL - 7.17% Profit Potential - Ascending TriangleAscending Triangle and new support confirmed multiple times in the past 3 days.
Target price set at new historical resistance line bounce.
- Historical Uptrend
- RSI and STOCH above 50
- MACD above Signal
Suggested Entry $1592.45
Suggested Stop Loss $1560.3
Target price $1710.71
Note that I tend to adjust stop losses in order to secure profits early and preserve capital. This means that the target price is going to be achieved as long as there are no strong pullbacks that trigger my new adjusted stop loss.

GOOGLE Trade SetupThis Analysis Is Done Only For Educational & Intelligence Purpose, Invest Or Trade At your Own Risk & Will.


GOOGLE LONG📈 NASDAQ:GOOGL LONG H4
🛒BUY above = 1538
🎯Target1 = 1575
🎯Target2 = 1598
🛑Stop loss or cancel trade = 1477
🙈Risk = (2%-3%)
#GOOGL #GOOGLLONG #BUYGOOGL

$GOOGL $GOOGL bounced off our $1541 zone and went to our $1557.37 zone where it consolidated between our $1557.37 zone and our bullish channel resistance. Then exploded the last 2hrs of the market to our $1580 zone and closed the day at our $1576.36 zone.

