GOOG Alphabet Stock SplitGOOG 20-for-1 stock split is scheduled to occur on July 15.
Companies that that did stock splits statistically had outperform the market in the 12 months following the split.
I think we will se GOOG trading at $2350 ahead of the split.
Looking forward to read your opinion about it.

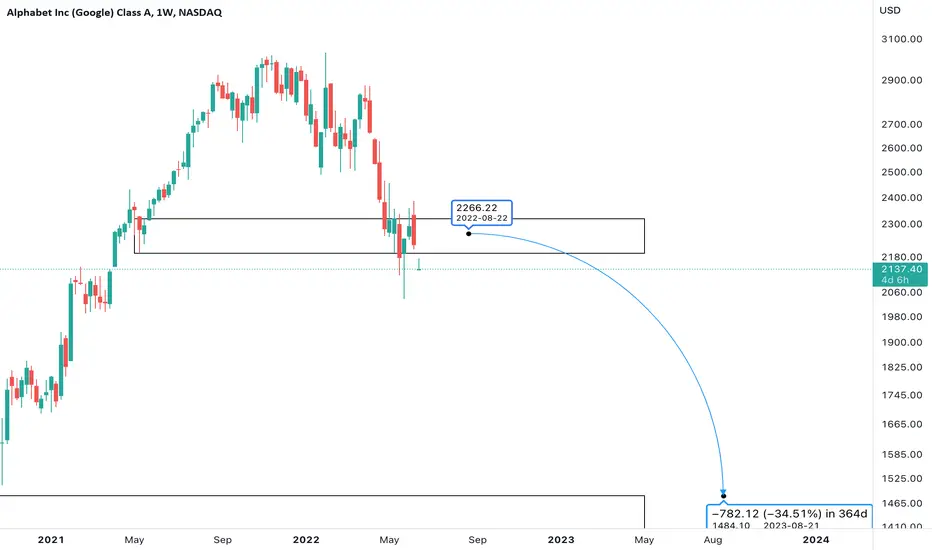
Google 50% Decline UnderwayGoogle Stock - I'm anticipating a 50% decline (minimum).
Stocks are taking a huge beating as the economy faces inflation, rate hikes, and lots more crazyiness.

Google Forecast. What do you think?I share TWO of my IDEAS!
1. First Option (1 YEAR)
Is done by looking at the Financial Health, Historical DATA and
calculating its Fair Value Today
2. Second Option is a Longterm Investment. That depends on the Market and Growth of Google
Disclaimer;
NO ADVICE TO INVEST and TRADE SAFE!

GOOGL WARNING: If 2025 is lost, 1786 will be very fastGoogle is still in a big red channel downtrend sine the ATH at 3042 failing to hold even the median line last week. The lower red channel at 2025 will be tested.
If Google loses the 0.50 Fibo retracement, there will be a totally blank space (green box) until the next Fibo 0.618 at
1786. The decline will be very very quick. This capitulation most likely to happen after some impt catalyst
event. Then a reversal will follow after 1786 holds.
BULLISH CASE: if the black VWAP from pandemic low holds (also near 2025), Google will most probably just bounce off the lower red channel making a divergence with a slightly lower low before rally.
Not trading advice

GOOGLNot financial advice.
The essence of investing & trading is the intelligent and patient preying on the greed, fear, impatience, addiction and ignorance of the majority. It's definitionally Darwinian.
ALPHABET INC (GOOGLE) GOOGFive-wave impulse, likely to be wave 1
current wave abc correction
Level 2317 is a strong price congestion axis
The price may test it or break it a little to 2300 or below to end the current correction
before going back up

Google To Reach $2450 next weekIf google break up from $2300 this could go to 2450 before the next downtrend.

Judgement Week for $SPX $SPY is Upon UsReally not sure what to expect, but the level of bearishness combined with a few gigantic stock splits ($AMZN splits Monday 6/6, $GOOGL 7/15, and $SHOP 6/22) could propel the marketing into the 4400 range. I believe that would be the MAXIMUM pain for bears, then continue down.
Reasons for my bullish short tern outlook.
1. $AMZN stock spilt on 6/6
2. Incredible amount of PUTS across the bored leading to a sense of over hedging
3. TTM Squeeze on $SPX daily looks primed to rip towards the upside
4. WeBull comments section is super bearish. lol

GOOGL dailyGreen zones are potential good area to average in shares.
+ Back over 20day SMA
+ Need to hold blue zone, confluence with 20day
+ Historically good moving average: 150 weeklySMA
- Still not above neutral
- Declining moving averages (resistance on a uptrend)
- 2 gaps remaining
- This yellow box can look like a distribution phase after a long run up, we would now need to wait a new accumulation phase to get back in

GOOGL continues to trade downToday GOOGL approached the resistance trendline, which is likely to be the selling point or a supply zone. If that is the case a new lower low should be produced within the next couple of weeks.

buy google alphabet gap fill to 2230Great daily close on google yesterday expect this to gap fill pretty quickly to 2230. Hold higher as well as looks very oversold

GOOGL Gooogle Buy NowAccording to my chart analysis , GOOGL Show strong signal to buy , buy max as you can .

Alphabet (NASDAQ: $GOOG) Is World's Top Search Engine 🍲Alphabet Inc. provides various products and platforms in the United States, Europe, the Middle East, Africa, the Asia-Pacific, Canada, and Latin America. It operates through Google Services, Google Cloud, and Other Bets segments. The Google Services segment offers products and services, including ads, Android, Chrome, hardware, Gmail, Google Drive, Google Maps, Google Photos, Google Play, Search, and YouTube. It is also involved in the sale of apps and in-app purchases and digital content in the Google Play store; and Fitbit wearable devices, Google Nest home products, Pixel phones, and other devices, as well as in the provision of YouTube non-advertising services. The Google Cloud segment offers infrastructure, platform, and other services; Google Workspace that include cloud-based collaboration tools for enterprises, such as Gmail, Docs, Drive, Calendar, and Meet; and other services for enterprise customers. The Other Bets segment sells health technology and internet services. The company was founded in 1998 and is headquartered in Mountain View, California.

GOOG BullishNot sure why no one is talking about GOOG at these levels. Such a sleeper tbh. 2333.33 is so programmed. I am full porting short terms calls on this. If it doesn't work out I will probably stop posting on tradingview because the market is totally rigged if Google keeps falling. Bless up !

Daily US Stocks Volatility Forecast 23 May 22 APPL, TSLA, MSFTApple 23 May 2022
For today, based on the last 30 days, the current implied volatility is around 2.63% movement.
So with a more than 78% chance we can estimate that the current daily channel made with 138 open candle value, is going to be:
TOP 138 + 3.6 -> aprox 141.6
BOT 138 - 3.6 -> aprox 134.4
At the same time, if we want to increase our probability, we can go for a IV of 3.94%
With this we can achieve over the last 5000+ daily candles, a 90% probability.
So in this case , our daily channel is going to be compressed within
TOP 138 + 5.4 -> aprox 143.4
BOT 138 - 5.4 -> aprox 132.6
----------------------------------------------------------------------------------------------------------------------
Microsoft 23 May 2022
For today, based on the last 30 days, the current implied volatility is around 2.63% movement.
So with a more than 78% chance we can estimate that the current daily channel made with 253 open candle value, is going to be:
TOP 253 + 6.6 -> aprox 259,6
BOT 253 - 6.6 -> aprox 246,4
At the same time, if we want to increase our probability, we can go for a IV of 3.75%
With this we can achieve over the last 5000+ daily candles, a 92% probability.
So in this case , our daily channel is going to be compressed within
TOP 253 + 9.5 -> aprox 262,5
BOT 253 - 9.5 -> aprox 243,5
----------------------------------------------------------------------------------------------------------------------
TSLA 23 May 2022
For today, based on the last 30 days, the current implied volatility is around 5.44% movement.
So with a more than 78% chance we can estimate that the current daily channel made with 665 open candle value, is going to be:
TOP 665 + 36 -> aprox 701
BOT 665 - 36 -> aprox 629
At the same time, if we want to increase our probability, we can go for a IV of 5.44%
With this we can achieve over the last 5000+ daily candles, a 90% probability.
So in this case , our daily channel is going to be compressed within
TOP 665 + 55 -> aprox 720
BOT 665 - 55 -> aprox 610
----------------------------------------------------------------------------------------------------------------------
Google 23 May 2022
For today, based on the last 30 days, the current implied volatility is around 2.7% movement.
So with a more than 78% chance we can estimate that the current daily channel made with 2180 open candle value, is going to be:
TOP 2180 + 60 -> aprox 2240
BOT 2180 - 60 -> aprox 2120
At the same time, if we want to increase our probability, we can go for a IV of 3.6%
With this we can achieve over the last 4000+daily candles, a 90% probability.
So in this case , our daily channel is going to be compressed within
TOP 2180 + 80 -> aprox 2260
BOT 2180 - 80 -> aprox 2100
----------------------------------------------------------------------------------------------------------------------

GOOGGoogle below levels are what can come as buy zones on the stock for the long term portfolio.. Anything sub 2k I really like personally, amazing tech company. 1.7k is gift

Elon Bubble.This is how much TESLA actually worths.
Market correction continues until the late this year (until TESLA returns to its pre-bubble value).
Red TESLA makes entire the market bloodbath.
ByeBye richest guy!

Beginning of an End.(Continued)Musk knows better than anybody else what's gonna happen for TESLA, run away when the CEO is walking away.
Next week <= $500.
Ps: when gas price goes up, people tend to buy EV. but affordable EVs not a $70K car. TESLA's competitors are winners of status quo.

Volatility Weekly Movements Stock, Crypto & Others16-20 MayExpected movements for 16-20 May 2022
SPY/SPX
Current volatility expected for the next week is going to be around 4.52%
So in this case for SPY with almost 90% accuracy the next top and bottom are going to be:
TOP 420
BOT 383
At the same time for SPX/ES with almost 90% accuracy as well, we have the next top and bottom
TOP 4200
BOT 3840
----------------------------------------------------------------------------------------------
QQQ/NDX
Current volatility expected for the next week is going to be around 5.57%
So in this case for QQQ with almost 85% accuracy the next top and bottom are going to be:
TOP 318.75
BOT 285
At the same time for NDX/NQ with almost 85% accuracy as well, we have the next top and bottom
TOP 13100
BOT 11700
----------------------------------------------------------------------------------------------
DIA/ Dow Jones
Current volatility expected for the next week is going to be around 3.36%
So in this case for DIA with almost 90% accuracy the next top and bottom are going to be:
TOP 330
BOT 311
At the same time for MYM/YM with almost 90% accuracy as well, we have the next top and bottom
TOP 33200
BOT 31000
----------------------------------------------------------------------------------------------
Apple
Current volatility expected for the next week is going to be around 5.76%, however we are going to imply 7.2%
So in this case for Apple with almost 90% accuracy the next top and bottom are going to be:
TOP 157.7
BOT 136.5
----------------------------------------------------------------------------------------------
Amazon
Current volatility expected for the next week is going to be around 7.46%, however we are going to imply 9.3%
So in this case for Amazon with almost 80% accuracy the next top and bottom are going to be:
TOP 2471
BOT 2050
----------------------------------------------------------------------------------------------
Google
Current volatility expected for the next week is going to be around 6.01%, however we are going to imply 7.51%
So in this case for Google with almost 90% accuracy the next top and bottom are going to be:
TOP 2495
BOT 2145
----------------------------------------------------------------------------------------------
Russel 2000/ IWM
Current volatility expected for the next week is going to be around 5.22%, however we are going to imply 6.51%
So in this case for Google with almost 95% accuracy the next top and bottom are going to be:
TOP 189.6
BOT 166.44
----------------------------------------------------------------------------------------------
IBM
Current volatility expected for the next week is going to be around 4.29%, however we are going to imply 4.29%
So in this case for IBM with almost 85% accuracy the next top and bottom are going to be:
TOP 139.3
BOT 127.87
----------------------------------------------------------------------------------------------
BITCOIN
Current volatility expected for the next week is going to be around 13.82%, however we are going to imply 15%
So in this case for BITCOIN with almost 95% accuracy the next top and bottom are going to be:
TOP 34450
BOT 25500
----------------------------------------------------------------------------------------------
GOLD
Current volatility expected for the next week is going to be around 2.17%, however we are going to imply 3.25%
So in this case for GOLD with almost 80% accuracy the next top and bottom are going to be:
TOP 1870
BOT 1750
----------------------------------------------------------------------------------------------
EURUSD
Current volatility expected for the next week is going to be around 1.6%, however we are going to imply 1.89%
So in this case for EURUSD with almost 80% accuracy the next top and bottom are going to be:
TOP 1.061
BOT 1.021

Expected Key Points Google 12 May 2022Google 12 May 2022
The current implied volatility is at 44.32%/year
So that converted into daily is 2.79%
The close of yesterday was 2272
So based on that our channel for today is going to be compressed within
TOP 2335
BOT 2208
with a probability chance of 78.2% based on the last 3007 candles
From fundamental point, today we have
PPI and initial jobless claims releases and these mark a huge volatility moment
At the same time the current values are expected to be bearish.

Update on TESLAThis is how FoxNews Fu**ed up TESLA.
Musk is going loco, he is ruining the company with his wrong and intrusive political ideas;

XLC trade for Meta and Alphabet exposureUsing XLC ETF to get exposure to Meta and Alphabet which is 40% of the fund. Taking advantage of the 61% drop from it's highs in Aug-Sep 2021, eventually the trend will change considering lower leverage of FB and GOOGL which is steady at 1.3 times it's Common Stock. FB has profit margin of 33% in 2021 which is high and has been fairly steady since 2017. Although ROE is sitting at 32% and 30% respectively for FB and GOOGL, the low leverage adds to its attractiveness. Considering we're entering a bear market, fundamentals are playing a key role in these growth stocks.

Weekly Prediction 9-13 May GoogleGoogle
9 - 13 May
The weekly VXGOG-> Volatility Index for Google
Implied = 40.95
In this we have to standard it for weekly session
40.95 / sqrt(52-> 52 weeks in a year) = 5.68%
My historical product is telling me with 1x coficient that the expected movement for this week
E Volatility = 41.19 / sqrt(52) = 5.71%
With this data, from my calculations, when EV > VIX, there were a 83.3% chance that the market
stay within the bottom and top created with the ranged from the E Vol
So for next week this range for us is going to be
TOP - 2447
BOT - 2183
