$GOOGL | TRADE IDEAGoogle gifting us with a new ATH today. All eyes on the previous ATH level of $2973. Need a daily close over this key level to confirm continuation towards my wave 3 target of $3032!

Up and UpNetflix is steadily going up. The price is moving in an uptrend and has now bounced off the resistance. Most likely, the price will consolidate to $ 646, bounce and go up to new highs: $ 700, $ 720, $ 740.

Target: $ 3055Google has been in a bullish trend for several weeks now. So far, there is no reason for a reversal. Target: $ 3055

Go to ATH and have 60%?The paper started an upward movement. Strong resistance will be near $42. A fair price for this stock is now around $50. It is possible to earn almost 60%
Fundamentally a very strong company
❤️ If you find this helpful and want more FREE forecasts in TradingView
. . . . . Please show your support back,
. . . . . . . . Hit the 👍 LIKE button,
. . . . . . . . . . . Drop some feedback below in the comment!
❤️ Your Support is very much 🙏 appreciated!❤️
💎 Want us to help you become a better Stock trader?
Now, It's your turn!
Be sure to leave a comment let us know how do you see this opportunity and forecast.

$GOOGL | WEEKLY WATCHLIST 11/1I alerted a Google long debit spread last week and those printed in the end of the week! Expiration is this Friday so please take caution. Looking to potentially roll profits into a new position depending on how price action looks early in the week. An amazing breakout and reclaim of the longer term daily channel.
Last week, I said it was KEY that we get a daily candle close above the previous ATH level of $2925.04 which we did get. Looking for continuation this week to reach my wave 3 target of $3032 before a short wave 4 retracement and 5th wave higher. Really loving this setup as this leads big tech.

10/31/21 GOOGLAlphabet Inc (Google) Class A ( NASDAQ:GOOGL )
Sector: Technology Services (Internet Software/Services)
Current Price: $2960.92
Breakout price trigger: $2925.00 (hold above)
Buy Zone (Top/Bottom Range): $2900.00-$2815.00
Price Target: $3100.00-$3122.00 (1st), $3390.00-$3425.00 (2nd)
Estimated Duration to Target: 10-11d (1st), 32-35d (2nd)
Contract of Interest: $GOOGL 11/12/21 3000c, $GOOGL 12/17/21 3200c
Trade price as of publish date: $33.50/contract, $24.90/contract

$GOOGL long with options exposure I think $GOOGL pokes its head above $3,000 in the coming days during the week of 11/1. I did add some call options right before the bell on Friday to have some exposure. As long as tech continues strong and the markets stays strong, this can happen very fast.

BKKT partnered with Mastercard to offer crypto based cards Cryptocurrency exchange Bakkt announced a partnership with Mastercard to offer crypto debit and credit cards.
Thanks to Mastercard and Bakkt, businesses and banks will be able to issue their own branded crypto debit and credit cards to consumers who want them.
How big do you think this can be?
Bakkt's also announced a separate deal with Fiserv.
Gavin Michael: “We want to provide consumer choice. We want to be able to provide the availability to use crypto currency in an everyday transaction,”
Is this the start of crypto adoption or what?
Bakkt also partnered with Google to allow its users to purchase goods and services using cryptocurrencies through the Google Pay wallet.
My call ok BKKT in the group was at 11.5usd, 15min after the market opening. Still holding to the moon. :)

3 ATHs in 1 Week - $GOOGL, $TSLA, $AMD $GOOGL, $TSLA, & $AMD all reached ATHs in 1 Week
$GOOGL - Alphabet
Reported Q3 FY21' earnings yesterday & hit an ATH of $2,925.08/share on 10/27/21
Alphabet is up 66.85% YTD
Returns since IPO in Aug 2004 - 1,670%
Decades of dominance by $GOOGL - along with their record-breaking recent Q3 FY21' earnings & updated Q4 FY21' estimates...
I continue to have a long position on $GOOGL in the long-term
$TSLA - Tesla
Reported Q3 FY21' earnings earlier this week with EPS of $1.86/share beating estimates & Revenue of $13.8B missing estimates
Reported an ATH of $1055.58/share on 10/27/21
Tesla up 47.07% TYD
Returns since IPO in June 2010 up 21,621% (yes thats correct - in 10s of thousands)
Reported 241,300 vehicle deliveries up 73.2% YoY
Plans to achieve 50% vehicle annual growth in vehicle deliveries over a multi-year horizon
Not sure my thoughts on $TLSA even as an owner of shares - with the current state of the supply chain, energy & it's rising costs, ESR movement, & clean energy it's hard for me to say "I absolutely LOVE $TSLA" or "Buy it Now!" - However, I do believe EVs are the future and am very long $TSLA for a long-term investment
$AMD - Advanced Micro Devices
Hit an ATH of $128.30/share on 10/25/21
Reported Q3 FY21' earnings earlier this week with EPS of $0.73/share beating estimates & Revenue of $4.31B beating estimates
Revenue of $4.31B +54% YoY
Advanced Micro Devices up +33.33% YTD
Returns since IPO in Oct 1979 - +3,689%
Q4 revenue estimates raised to $4.6B
Very positive outlook overall - including large raises in Q4 earnings estimates, but also a very volatile stock - given its sector, volume in number of shares traded, % almost "meme" stock status, I am long $TSLA for a long-term investment

S&P 500 index Rising wedgeS&P 500 is forming a rising wedge which will be a nasty drop in all markets if it plays out. I will be looking to buy the dip, but im going to wait till I see a proper bottom forming. With covid, all the money printing and the general boom we have seen in the market lately, a correction is due (might even see a flash crash).
This may also affect the crypto market

PRE presearch google alternative Thought ProcessPRE presearch google alternative Thought Process on Possible Price Action.
This video shows my thought process on how I think PRE will move
this is for entertainment only - not financial advice

PRE presearch google alternative Thought Process on Possible ...PRE presearch google alternative Thought Process on Possible Price Action.
This video shows my thought process on how I think PRE will move
this is for entertainment only - not financial advice

GOOG sold by ARK InvestOn October 20, ARKQ, part of the Ark invest fund lead be Cathie Wood sold 1,858 shares of GOOG, for a total value of 0.2031 of its portfolio.
Most of the time, when Ark starts a sell, it tends to continue it for multiple days.
Was this the top for Alphabet?
My price target is the 2700usd support.
I`m looking forward to read your opinion about it.

Google - Tech - 10 Year NoteVolatility in the notes (10Y @ 1.66) showed-up as a pause day for growth tech. With earnings one week away, a melt-up would benefit from resistance in the bonds.


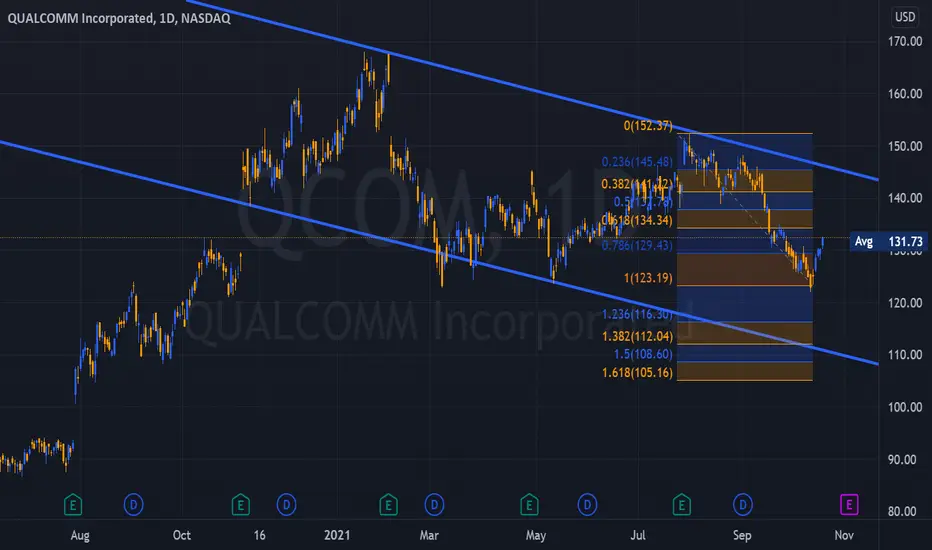
QCOM - First Apple, Now GOOGLEGoogle chose Samsung to partner in the Exynos Extension - the Tensor.
While Exynos has had its detractors over the years, with good reason, the Tensor is an
entirely new beast.
No Taiwanese Manu is required, South Korea is safer.
Another number of Nails in the QOCM coffin.
Google is going to capture large amounts of Market share from everyone - Including the iMob.
The phones are, IMHO, quite nice in appearance and performance.
Integration is the Key.
No other TECH company on the planet can match Google.
They are finally, fully committed to entering the market and their new Flagship... it is a remarkable
piece for Kit @ $899, well below its competitors.
The combination of exceptional Software and Solid, robust hardware, will provide an experience
unlike any other. Mid-Band 5G will rip as T-Mobile finally begins to integrate the Licenses from their
merger with Sprint.
The Pixel 6 is the world's first truly international Smart Phone and seamless carrier switching the
competition lacks and will for a period of time.
QCOM will continue to lose Market Share, their attempt to enter the Smart Phone Market was less
than spectacular.
Our strategy is to build a Put Calendar spread in QCOM from 140 to 150.
We believe QCOM will be moving far lower in Price as Google gains immense Market share with the
introduction of the Pixel 6 and Pixel 6 Pro.
I'm watching the Google Pixel Live Stream and am impressed with a very Non-Apple presentation.
Believe this to be a Game Changer with QCOM in the 90s once again - HK
Google - Inverse ConfirmedFound resistance above the .236 Break Target. Setting up a Doji above support as the market takes a moment to regroup.
*Correction" Earnings for Google is Tuesday October 26th.

SPX 500 analysisI posted a graph on a higher timeframe before we had a decent drop in all markets:
And I still stand by that, but on the lower timeframe, I see a falling wedge forming. The price action indicates to me that we are going to break up sooner rather than later, so this yellow arrow I have on my chart is somewhat what I expect :)

GOOG - 2nd Neckline TestMSFT catalyst, FB recovery, TSLA parabolic - - GOOG inverse set-up, earnings Nov 4th, 2021

GOOG - Neckline Back TestGOOG found support at the pattern break level and held stable after yesterday's push-up.


Google - DailyIf the 61.8% retracement holds up at the support, a good chance that this will continue upwards.
Will be watching this stock in case this does hold.
We have an interesting week next week for fundamentals / news.
