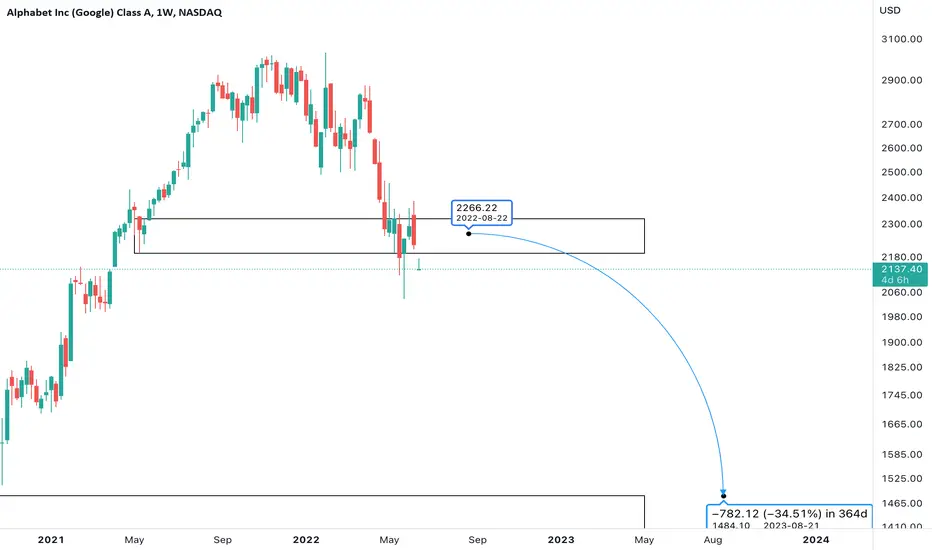
GOOG Stock to Sell from Potofolio Dear investors,
Year-To-Date Google is losing 31.38% of its value on the stock market.
In my analysis of the weekly & daily chart I expect Google to go down, even more, I recommend selling & go Short against it until the end of the year.
Googlelong

GOOGL daily RSI divergenceGOOGL daily RSI divergence. Stop loss under local pivot. Take profit to Fibonacci 50% retracement.

Google will Stay ahead in many AREASGoogle stays on Top and will be coming out with Amazing Stuff in the Next 2 Years

Google is preparing for a hearty climbGoogle is preparing for a hearty climb. The correction is formed in the form of a flat, which we are now in a branch of the C-terminal wave

Alphabet heading to support? Alphabet
Short Term
We look to Buy at 106.02 (stop at 102.75)
Preferred trade is to buy on dips. Trading within the Channel formation. Previous support located at 106.00. There is ample scope for a move higher from this important support.
Our profit targets will be 113.59 and 118.25
Resistance: 119.00 / 125.00 / 142.00
Support: 108.00 / 106.00 / 100.00
Disclaimer – Saxo Bank Group. Please be reminded – you alone are responsible for your trading – both gains and losses. There is a very high degree of risk involved in trading. The technical analysis, like any and all indicators, strategies, columns, articles and other features accessible on/though this site (including those from Signal Centre) are for informational purposes only and should not be construed as investment advice by you. Such technical analysis are believed to be obtained from sources believed to be reliable, but not warrant their respective completeness or accuracy, or warrant any results from the use of the information. Your use of the technical analysis, as would also your use of any and all mentioned indicators, strategies, columns, articles and all other features, is entirely at your own risk and it is your sole responsibility to evaluate the accuracy, completeness and usefulness (including suitability) of the information. You should assess the risk of any trade with your financial adviser and make your own independent decision(s) regarding any tradable products which may be the subject matter of the technical analysis or any of the said indicators, strategies, columns, articles and all other features.
Please also be reminded that if despite the above, any of the said technical analysis (or any of the said indicators, strategies, columns, articles and other features accessible on/through this site) is found to be advisory or a recommendation; and not merely informational in nature, the same is in any event provided with the intention of being for general circulation and availability only. As such it is not intended to and does not form part of any offer or recommendation directed at you specifically, or have any regard to the investment objectives, financial situation or needs of yourself or any other specific person. Before committing to a trade or investment therefore, please seek advice from a financial or other professional adviser regarding the suitability of the product for you and (where available) read the relevant product offer/description documents, including the risk disclosures. If you do not wish to seek such financial advice, please still exercise your mind and consider carefully whether the product is suitable for you because you alone remain responsible for your trading – both gains and losses.

GOOGL Long term investment - It doesnt fail to surprise meEvery 4 years(except 2012), google has either doubled or more than doubled in value.
Google has fallen more than 24%(from its all time high) in the last couple of month. It is a good time to stack up this stock.
Their growth is inevitable.

GOOG $ Breakout Levelwe just tested our resistant last week, now if we have a breakout from this level , we going to test 2 level of resistant, which the second resistant will give us the breakout to all time high for this year , over the 160$+.
the bottom that we should hold for this year if we want to see this movement , is holding above the 100$ support .

GOOG - ContinuationDaily chart for GOOG showing a touch above the major trend line
This touch will likely result in a bullish rejection and continuation will occur
This is indicated by the double curve arrow
Bullish


Will $GOOGL continue to play catch-up to its tech peers?$GOOGL delivered a strong report last week when it announced quarterly earnings. The stock has underperformed the tech sector this year. On Friday, it managed to clear $115 and is currently en route for a re-test of $119 if the overall tech sector remains strong. It is not as extended as some of its peers so it is definitely worth a look. The longer it holds above $113 the higher the probability it will clear $120 in the coming week.

7/27/22 GOOGAlphabet Inc (Google) Class C ( NASDAQ:GOOG )
Sector: Technology Services (Internet Software/Services)
Market Capitalization: $1.493T
Current Price: $113.60
Breakout Price: $114.80
Buy Zone (Top/Bottom Range): $112.80-$105.40
Price Target: $120.20-$121.80 (1st), $126.40-$129.10 (2nd)
Estimated Duration to Target: 36-38d, 65-68d
Contract of Interest: $QQQ 9/16/22 115c, $QQQ 10/21/22 115c
Trade price as of publish date: $4.60/contract, $6.50/contract

GOOG: Have we reached the bottom?Alphabet
Intraday - We look to Buy at 2214 (stop at 2105)
Buying pressure from 2150 resulted in prices rejecting the dip. This is positive for sentiment and the uptrend has potential to return. There is scope for mild selling at the open but losses should be limited. Prices expected to stall near trend line support. Dip buying offers good risk/reward.
Our profit targets will be 2549 and 2600
Resistance: 2555 / 2860 / 3032
Support: 2140 / 1900 / 1600
Please be advised that the information presented on TradingView is provided to Vantage (‘Vantage Global Limited’, ‘we’) by a third-party provider (‘Signal Centre’). Please be reminded that you are solely responsible for the trading decisions on your account. There is a very high degree of risk involved in trading. Any information and/or content is intended entirely for research, educational and informational purposes only and does not constitute investment or consultation advice or investment strategy. The information is not tailored to the investment needs of any specific person and therefore does not involve a consideration of any of the investment objectives, financial situation or needs of any viewer that may receive it. Kindly also note that past performance is not a reliable indicator of future results. Actual results may differ materially from those anticipated in forward-looking or past performance statements. We assume no liability as to the accuracy or completeness of any of the information and/or content provided herein and the Company cannot be held responsible for any omission, mistake nor for any loss or damage including without limitation to any loss of profit which may arise from reliance on any information supplied by Signal Centre.

$GOOGL pre-split$GOOGL posted a bottom tweezers formation on the daily chart. We continue to believe that this stock will have some sort of oversold bounce into the split this month. We are long the $2250 calls for July 22nd. The first big resistance area for this week is $2217. Reclaiming the 8&21EMAs around $2240 will be an important aim for the active bulls this week. See if it starts showing any relevant strength in order to increase your position ahead of the split. Make sure not to chase!

GOOGL time to buyafter a bearish trend and the creation of a ''Double Bottom'' pattern, we will wait for the confirmation of the breakout of the ''neckline'' after which we can take the buy position

GOOGL Gooogle Buy NowAccording to my chart analysis , GOOGL Show strong signal to buy , buy max as you can .

GOOG Alphabet Stock SplitGOOG 20-for-1 stock split is scheduled to occur on July 15.
Companies that that did stock splits statistically had outperform the market in the 12 months following the split.
I think we will se GOOG trading at $2350 ahead of the split.
Looking forward to read your opinion about it.

Google Forecast. What do you think?I share TWO of my IDEAS!
1. First Option (1 YEAR)
Is done by looking at the Financial Health, Historical DATA and
calculating its Fair Value Today
2. Second Option is a Longterm Investment. That depends on the Market and Growth of Google
Disclaimer;
NO ADVICE TO INVEST and TRADE SAFE!

GOOGLNot financial advice.
The essence of investing & trading is the intelligent and patient preying on the greed, fear, impatience, addiction and ignorance of the majority. It's definitionally Darwinian.
GOOG time to buyafter the downtrend that we had we will see a big movement of an uptrend we can take the buy position after the confirmation of the range breakout

GOOGL Gooogle Buy NowAccording to my chart analysis , GOOGL Show strong signal to buy , buy max as you can .

$GOOGL looking better$GOOGL closed the gap after $SNAP dropped the ball on Tuesday night. For today, see if it can get above $2200 for a possible rally next week. A possible strategy will be to buy some $2200 calls expiring in 2 weeks and create a spread into strength.

GOOGLNot financial advice.
The essence of investing & trading is the intelligent and patient preying on the greed, fear, impatience, addiction and ignorance of the majority. It's definitionally Darwinian.

Google Ready to Bounce?Alphabet
Short Term - We look to Buy at 2524.87 (stop at 2472.74)
We look to buy dips. Previous support located at 2500.00. The medium term bias remains bullish. Although this gives the medium term bias a mild bearish edge, we expect intraday trading to continue to be mixed and volatile. Trading close to the psychological 2500.00 level.
Our profit targets will be 2677.46 and 2826.06
Resistance: 2700.00 / 2850.00 / 3000.00
Support: 2500.00 / 2400.00 / 2220.00
Disclaimer – Saxo Bank Group. Please be reminded – you alone are responsible for your trading – both gains and losses. There is a very high degree of risk involved in trading. The technical analysis, like any and all indicators, strategies, columns, articles and other features accessible on/though this site (including those from Signal Centre) are for informational purposes only and should not be construed as investment advice by you. Such technical analysis are believed to be obtained from sources believed to be reliable, but not warrant their respective completeness or accuracy, or warrant any results from the use of the information. Your use of the technical analysis, as would also your use of any and all mentioned indicators, strategies, columns, articles and all other features, is entirely at your own risk and it is your sole responsibility to evaluate the accuracy, completeness and usefulness (including suitability) of the information. You should assess the risk of any trade with your financial adviser and make your own independent decision(s) regarding any tradable products which may be the subject matter of the technical analysis or any of the said indicators, strategies, columns, articles and all other features.
Please also be reminded that if despite the above, any of the said technical analysis (or any of the said indicators, strategies, columns, articles and other features accessible on/through this site) is found to be advisory or a recommendation; and not merely informational in nature, the same is in any event provided with the intention of being for general circulation and availability only. As such it is not intended to and does not form part of any offer or recommendation directed at you specifically, or have any regard to the investment objectives, financial situation or needs of yourself or any other specific person. Before committing to a trade or investment therefore, please seek advice from a financial or other professional adviser regarding the suitability of the product for you and (where available) read the relevant product offer/description documents, including the risk disclosures. If you do not wish to seek such financial advice, please still exercise your mind and consider carefully whether the product is suitable for you because you alone remain responsible for your trading – both gains and losses.
