Google (GOOGL) | The best area to buy🔥Hello traders, Google in daily timeframe , this analysis has been prepared in daily timeframe but has been published for a better view in 2 day timeframe.
Based on our investigations of this share, we found that the first wave 1 and 2 are over and the wave we counted is part of wave 3.
We assume that the counted wave was wave 5 of wave 3 or wave 5 of wave 3 of wave 3.
In the count we did, waves (1) and (2) are over and wave 3 microwaves are forming.
From wave 3, waves 1 and 2 are completed and now the structure of wave 3 is completed.
From this structure, a wave 4 is confirmed by the break of the trend line , which is likely to end on Fibo 0.38, and the climb for wave 5 from 3 to Fibo 2.27, ie the price of 3000, will start slightly above the current peak.
And then we have the descent for wave-4, we did not consider a field point in this analysis.
🙏If you have an idea that helps me provide a better analysis, I will be happy to write in the comments🙏
❤️Please, support this idea with a like and comment!❤️
Googleshort

GOOGLE / GOOGThe Google stock will start in a downtrend from the area shown on the chart
first target 2394
second target 2122


GOOGLE A DROP ON AVG OF 14 TO 21 % IS NEAR We are now in the seventh up month in google over the last 12 year when this has happened a sharp 1 to 2 months decline avg from 14 to 21 % drop SO I am now buying puts on the qqq as of this post for oct to dec across the tech sector
will google broke the highest resistance or return marketGoogle records the highest since inseption we have resistance if he broke it we must to records new highest but if not the market up down

Alphabet ShortChart painting from the early 21st century, artist Maxi Scalibusa. No investment advice or a recommendation to buy or sell any securities. This is entertainment. Start 2369.95 USD

GOOGLE / GOOGIt is moving in an upward direction
it will correct a little
Going to the support areas shown on the chart
and then returning to complete the upward trend to the target

I’m short at the momentOverbought, all highs, hoping for it to drop and can see it hitting either golden 61s 78s Fibonacci lines and rebounding.
(You should do your own studies)

GOOG GOOGL GOOGLE Possible UP channel + Bearish RSI $GOOGL $GOOGPossibly reached the top a channel + A Bearish RSI divergence, correlated with a downward channel @ $AMZN

GOOGLE -- It keeps getting stuckAs can be seen in the chart, there is a great squeeze in both prices and RSI. This is a bit scary of course ...
This tightness can continue up to the level of 2200$ or even 2400 $, but then we think it is very likely that we will see a big selling pressure for both the relaxation of the indicators and the completion of the technical formation formed by the prices.
We are not at the beginning of April anymore. It has been almost a year and the Nasdaq have an unstoppable rising. We wonder where will he stand ???
It contains only personal views and opinions. Does not contain legal investment advice ...

GOOGLEThe price is heading in a downtrend, and it has completed the correction, and it will continue the decline

Google (Alphabet inc.) SHORT📉 NASDAQ:GOOGL SHORT H4
🛒SELL BELOW = 1716.47
🎯Target1 = 1653.93
🎯Target2 = 1615.27
🛑Trailing Stop loss = 1817.66
❌Cancel trade and open reverse trade = 1817.66
🙈Recommended risk = 1-2%
#GOOGL #GOOGLSHORT #GOOGLSELL


GOOGLE SHORT📉 NASDAQ:GOOGL SHORT H4
🛒SELL BELOW = 1446.35
🎯Target1 = 1415.95
🎯Target2 = 1397.15
🎯Target3 = 1366.75
🛑Stop loss or cancel trade = 1495.60
🙈Recommended risk = (1%-2%)

GOOGLE SHORT📉 NASDAQ:GOOGL SHORT H4
🛒SELL BELOW = 1515.70
🎯Target1 = 1478.80
🎯Target2 = 1456
🎯Target3 = 1419
🛑Stop loss or cancel trade = 1575.60
🙈Recommended risk = (2%-3%)
#GOOGL #GOOGLSHORT #SHORTGOOGL #GOOGLSELL #SELLGOOGL

Google 2 scenariosstill in the upward channel. but short term does not look ready to brake the resistace with this RSI situation.

googlas i expect it jumped from 1500 to 1583 and it hit the resistance point and now its going short

GOOGL wave (4) PullbackGOOGL wave III completed and we’ve rallied in a complete motive impulse. Is this wave (5) of higher degree wave III. On guard for a possible top.

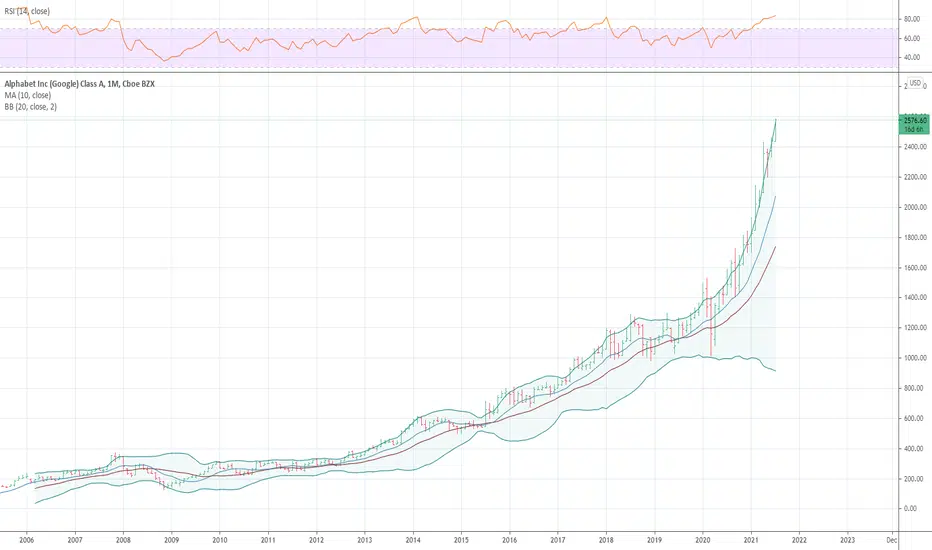
Google sell signals on D1.Google, daily timeframe: Resistance zone + Divergence + Shooting Star + Side of Bollinger bands

ANALYZE: GOOGLafter all inotice on the chart my probability the trend going up to test the resistance line


🤔 Opportunity On Google? (GOOG)💰 LET'S GET INTO SOME GOOGLE ANALYSIS!💰
1️⃣ First off SMASH that LIKE BUTTON & Give us a FOLLOW for DAILY ANALYSIS! ❤❤❤
(Overall Market Sentiment) 🐻 Bearish
- My main worry is that the longterm upward support has been broken and had a retest but looks like it could be rejecting off of it for a new Resistance and a lower low / lower high.
- I have a red engulfing crossover on the 12 hour with compression on the daily. The Crossover strategy is showing a Crossover all indicators to the downside.
- All 3 ema dots ont he bottom are red and have been red consecutively.
- I will be taking a short with a 1.5% stoploss.
Share your charts and comments down below! Would love to hear your thoughts! ❤❤❤❤
Thanks for checking out our analysis! ✌😁✌
🥇MLT | MAJOR LEAGUE TRADER

