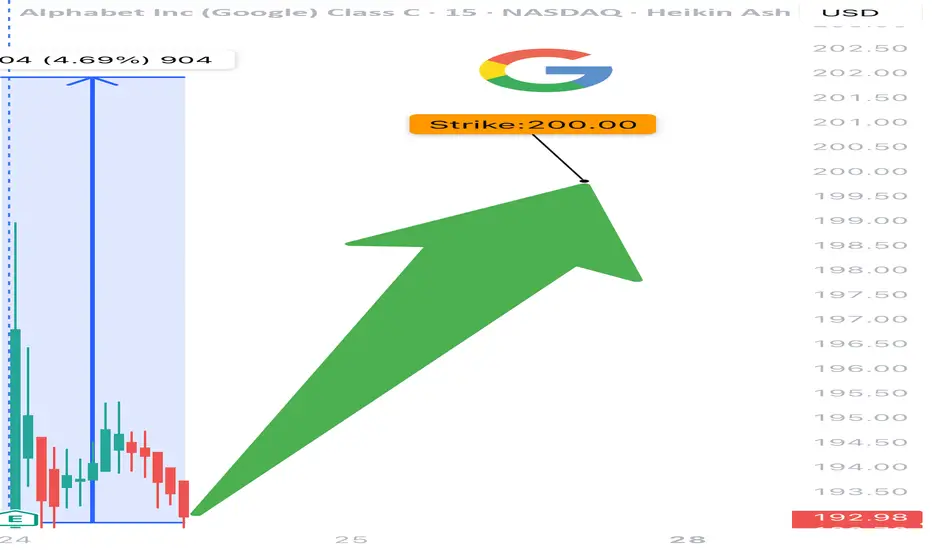
GOOGL TRADE IDEA (07/24)
🚨 GOOGL TRADE IDEA (07/24) 🚨
💥 Big institutional flow. 1 DTE. High gamma = high reward (⚠️ high risk too)
🧠 Quick Breakdown:
• Call/Put Ratio: 2.44 → ultra bullish
• Weekly RSI climbing (67.3) 📈
• Daily RSI falling from 77.5 → 🔻 short-term pullback risk
• Reports split: trade or wait? We’re in.
💥 TRADE SETUP
🟢 Buy GOOGL $200 Call exp 7/25
💰 Entry: $2.09
🎯 Target: $3.14–$4.18 (50–100%)
🛑 Stop: $1.25
📈 Confidence: 70%
⚠️ Expiry in 1 day = tight execution needed. Gamma can cut both ways. Watch it like a hawk. 👀
#GOOGL #OptionsFlow #CallOption #GammaSqueeze #TechStocks #UnusualOptionsActivity #TradingView #StockAlerts #BigMoneyMoves #DayTrading #OptionsTrading
Googlesignals
GOOGL Dips: Buy Opportunity Looms at $173.5FenzoFx—#GOOGL broke below the previous day's low at $175.68, aiming toward the $173.53 support.
This zone is backed by the anchored VWAP, which can provide a discount price to join the bull market.

GOOGLE Repeating 2024 pattern and eyes $197.00Alphabet Inc. (GOOG) has established a Channel Up pattern since the (near) 1W MA200 (orange trend-line) rebound. With the 1D MA50 (blue trend-line) now acting as a Support, this pattern resembles the Channel Up formations that emerged in 2024.
Both in terms of 1W RSI and pure price action alike, we are in a similar consolidation level as November and April 2024. Both patterns peaked after similar rallies (+40.60% and +46.23% respectively), so the minimum Target we are expecting on the medium-term is $197.00.
-------------------------------------------------------------------------------
** Please LIKE 👍, FOLLOW ✅, SHARE 🙌 and COMMENT ✍ if you enjoy this idea! Also share your ideas and charts in the comments section below! This is best way to keep it relevant, support us, keep the content here free and allow the idea to reach as many people as possible. **
-------------------------------------------------------------------------------
💸💸💸💸💸💸
👇 👇 👇 👇 👇 👇

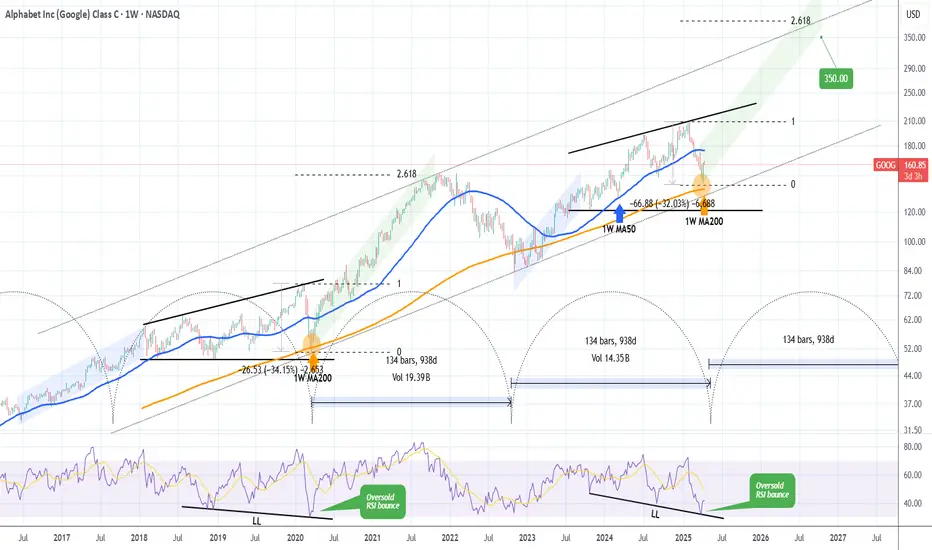
GOOGLE's generational bottom made. This is how it reaches $350.Alphabet Inc. (GOOG) almost tested last week its 1W MA200 (orange trend-line). That level has been holding for more than 2 years (since March 13 2023) and it's been the main Support of the Bull Cycle that followed the November 2022 Inflation Crisis bottom.
The pattern is almost like the Ascending Triangle that led to the March 2020 COVID crash, which was the most recent time before the late 2022 bottom that the stock made contact with the 1W MA200. As you realize, all those times have been what we call 'generational bottoms', thus extremely good long-term buy opportunities. And as you see they've been on extremely tight time symmetry, all took place roughly every 2.5 years.
If the pattern continues to repeat itself, then we may witness a rally (green Channel Up) similar to the one that peaked on November 2021 and reached the 2.618 Fibonacci extension. As a result, setting a $350 Target would be more than realistic based on this pattern.
-------------------------------------------------------------------------------
** Please LIKE 👍, FOLLOW ✅, SHARE 🙌 and COMMENT ✍ if you enjoy this idea! Also share your ideas and charts in the comments section below! This is best way to keep it relevant, support us, keep the content here free and allow the idea to reach as many people as possible. **
-------------------------------------------------------------------------------
💸💸💸💸💸💸
👇 👇 👇 👇 👇 👇
GOOGLE Bottom confirmed. Laying eyes on $220.Alphabet Inc. (GOOG) has been trading within a Channel Up since the July 10 2024 High. Last week, the Bearish Leg touched the pattern's bottom, completing a -23.92% decline from the top, which is almost symmetrical to the previous Bearish Leg (-23.32%).
At the same time the 1D RSI got oversold (<30.00) and recovered on a Bullish Divergence, while the 1D MA50 (blue trend-line) crossed below the 1D MA100 (green trend-line), forming a Bearish Cross. Last time we had this formation was September 06 2024 and 1 day later, the bottom (Higher Low of the Channel Up) was formed.
Among all this, the 1W MA100 (red trend-line) is holding, which is the market's long-term Support since July 12 2023. As a result, we expect the new Bullish Leg to start and as the previous one did, target the 1.236 Fibonacci extension at $220.00.
-------------------------------------------------------------------------------
** Please LIKE 👍, FOLLOW ✅, SHARE 🙌 and COMMENT ✍ if you enjoy this idea! Also share your ideas and charts in the comments section below! This is best way to keep it relevant, support us, keep the content here free and allow the idea to reach as many people as possible. **
-------------------------------------------------------------------------------
💸💸💸💸💸💸
👇 👇 👇 👇 👇 👇

GOOGLE Buy the earnings dip and Target $215.Alphabet Inc. (GOOG) has been trading within a Channel Up since the September 09 2024 Low. Just last Friday it formed a Bullish Cross on its 1D MACD and is rising, which inside this Channel Up pattern, has been a strong buy signal.
Given that the company's Earnings miss will force the stock to open near or at the 1D MA50 (blue trend-line), take this excellent dip opportunity to buy the technical pattern and target $215, which is the standard +15% Higher Lows rebound the Channel had on each Bullish Leg.
-------------------------------------------------------------------------------
** Please LIKE 👍, FOLLOW ✅, SHARE 🙌 and COMMENT ✍ if you enjoy this idea! Also share your ideas and charts in the comments section below! This is best way to keep it relevant, support us, keep the content here free and allow the idea to reach as many people as possible. **
-------------------------------------------------------------------------------
💸💸💸💸💸💸
👇 👇 👇 👇 👇 👇

GOOGLE Enormous upside confirmed by a 1W Bullish Cross eyes $235Alphabet Inc. (GOOG) has been trading within a 2-year Channel Up since the October 31 2022 bottom of the Inflation Crisis Bear Cycle. Having already started the new Bullish Leg of the pattern following the rebound on the 1W MA50 (blue trend-line), the price completed last week a MACD Bullish Cross on the 1W time-frame, the first since March 25 2024. That was halfway through the previous Bullish Leg.
The 2-year Channel Up has only given us another 3 such MACD Bullish Crosses, so this is in fact a strong and rare bullish signal. As you can see, so far we've had two major Bullish Legs within the Channel Up, both topped after roughly +60% price increases and both reached at least the 2.382 Fibonacci extension measured from their respective corrections.
Since the 2.382 Fib extension is this time considerably above the Channel Up, it is only natural to assume that yet again the Bullish Leg may complete a +60% rise from the September 09 bottom.
As a result, our Target towards the end of Q1 2025 is $235.00.
-------------------------------------------------------------------------------
** Please LIKE 👍, FOLLOW ✅, SHARE 🙌 and COMMENT ✍ if you enjoy this idea! Also share your ideas and charts in the comments section below! This is best way to keep it relevant, support us, keep the content here free and allow the idea to reach as many people as possible. **
-------------------------------------------------------------------------------
💸💸💸💸💸💸
👇 👇 👇 👇 👇 👇

GOOGLE (GOOGL) Breaks Out? Bullish Surge on 15m TimeframeGoogle (GOOGL) has shown a bullish breakout following the entry at 163.31, pushing through the first target (TP1) at 165.51 with significant momentum.
Key Levels
Entry: 163.31 – The entry point aligns with a breakout from a period of consolidation, supported by upward movement across key technical indicators.
Stop-Loss (SL) : 161.52 – Positioned below recent support to minimize downside risk and protect against potential pullbacks.
Take Profit 1 (TP1): 165.51 – Already achieved, confirming the initial bullish momentum.
Take Profit 2 (TP2): 169.07 – Represents the next resistance level where profit-taking may occur as the uptrend continues.
Take Profit 3 (TP3): 172.64 – Should the bullish momentum persist, this is the next key resistance level to watch.
Take Profit 4 (TP4): 174.84 – The ultimate target, signaling a strong upward movement.
Trend Analysis
GOOGL is well above the Risological dotted trendline and shorter-term moving averages, indicating a healthy uptrend.
The breakout suggests continued bullish momentum, with TP2 and TP3 likely in focus if the uptrend sustains.
The bullish momentum in GOOGL is evident, with the price moving swiftly past TP1. With solid support from moving averages and strong buying pressure, the next targets at 169.07 and 172.64 are in sight.

Coffee Is Brewing!!!I don't know folks... again, I ain't nothing but a tier below an amateur beginning options player. There is a lot of learning still to do but I'm ready to be transparent with my thoughts and what I see a bit more often. So here with go with a previous fan favorite of Coffee Is Brewing!
Coffee Is Brewing Idea #2
NASDAQ:GOOGL has earnings coming up 10/22 and has had a little bit of price action these past few weeks with a niiiiiiiiiiice Pogo Stick bounce this past Friday and closed above the previous week... all which are bullish signals, to me! Again, from my perspective I've seen Bullish action for the past few weeks. As evidenced by my NASDAQ:GOOGL 165C options exp 10/18 that I picked up at about 1.65 that ran up just shy of 6.00 and the NASDAQ:GOOGL 170C options exp 10/18, that I'm still holding. That's enough about what I had and have in play... let's talk about what I see. That right there folks looks like a cup and handle, which ultimately gets a Coffee Is Brewing tag! The bonus green drawn lines I added, some might consider a Bull Flag is starting to be established. I see another couple weeks of good runs with this AMEX:SPY small fry playa that's part of The Mag 7!
I don't know about what y'all see but if you see something else, please drop a comment. If you like what you see, give ya boy a BOOST, a Follow, or a comment. I appreciate y'all for taking the time to look and we'll talk soon.

GOOGLE You can still catch this BUY to based on these indicatorsAlphabet Inc. (GOOG) is in the process of forming a bottom following the July and early August correction. Technically it has already priced the new Higher Low (green Arc) on the 20-month Channel Up but is underperforming relative to the rest of the tech sector.
This is why it hasn't yet broken above the 1D MA100 (green trend-line) but this isn't at all discouraging. Every break within this long-term Channel Up below the 1D MA100 and subsequent recovery above it, confirmed the start of its new Bullish Leg. This has only taken place when the 1D MACD formed a Bullish Cross below the 0.0 mark, which last took place on August 16.
The above occurrences indicate that it is not late to catch this unique long-term buy on Google. Following the October 27 2023 Low, the first High it made was after a +28.14% rise. As a result our first long-term Target is $200.
-------------------------------------------------------------------------------
** Please LIKE 👍, FOLLOW ✅, SHARE 🙌 and COMMENT ✍ if you enjoy this idea! Also share your ideas and charts in the comments section below! This is best way to keep it relevant, support us, keep the content here free and allow the idea to reach as many people as possible. **
-------------------------------------------------------------------------------
💸💸💸💸💸💸
👇 👇 👇 👇 👇 👇

GOOGLE Correction completed. Buying again for a $210 Target.Last time we made a call on Alphabet Inc. (GOOG) on July 11 (see chart below), we caught the most optimal sell entry, right at the top of the 21-month Channel Up:
The price not only broke below the 1D MA50 (blue trend-line) for the first time since March 15, but today almost touched the 1D MA100 (green trend-line), which is holding since March 12.
This correction is consistent with the mid Bullish Leg pull-back that bottomed on July 11 2023 and then moved on to complete a +37.69% rise from the previous Higher Low. As a result, we think this is the best level to buy again and target $210.00 (+37.69% rise from the April 25 Higher Low.
-------------------------------------------------------------------------------
** Please LIKE 👍, FOLLOW ✅, SHARE 🙌 and COMMENT ✍ if you enjoy this idea! Also share your ideas and charts in the comments section below! This is best way to keep it relevant, support us, keep the content here free and allow the idea to reach as many people as possible. **
-------------------------------------------------------------------------------
💸💸💸💸💸💸
👇 👇 👇 👇 👇 👇

GOOGLE Top of the Channel makes pull-back likely. Buy the dip.Alphabet Inc. (GOOG) has been trading within a Channel Up since the November 03 2022 market bottom and on our last analysis (April 16, see chart below), it gave us an excellent buy entry, hitting eventually our 175.00 Target:
Right now the price is more than half-way on the new Bullish Leg but has come very close to the Channel's top (Higher Highs trend-line). Based on the June 07 2023 Top and the previous major Bullish Leg, we might get a pull-back towards the 1D MA50 (blue trend-line), before going for the final Higher High.
As as result, we are now willing to buy only after a 1D MA50 contact and Target $210.00, which will represent a +37.60% rise from the recent Higher Low, similar to the Bullish Leg of 2023.
-------------------------------------------------------------------------------
** Please LIKE 👍, FOLLOW ✅, SHARE 🙌 and COMMENT ✍ if you enjoy this idea! Also share your ideas and charts in the comments section below! This is best way to keep it relevant, support us, keep the content here free and allow the idea to reach as many people as possible. **
-------------------------------------------------------------------------------
💸💸💸💸💸💸
👇 👇 👇 👇 👇 👇

GOOGLE Short-term correction is another longterm buy opportunityLast time we looked at Alphabet Inc (Google/ GOOG) almost two months ago (February 27, see chart below) we caught an excellent buy entry and even tough the price dipped some more after, it is approaching our 168.00 Target:
Yesterday's strong bearish 1D candle serves as an early signal that the stock can pull-back to its 1D MA50 (blue trend-line) again on the short-term before resuming the long-term bullish trend. After all this is not unfamiliar to Google's 15-month Channel Up pattern, which had a similar 1D MA50 pull-back on numerous occasions, the shortest of which has been -10.45%.
Due to the fair symmetrical attributes of the Higher Highs as well, we revise our Target and place it even higher at 175.00 (+22.18% projection from the expected Low).
-------------------------------------------------------------------------------
** Please LIKE 👍, FOLLOW ✅, SHARE 🙌 and COMMENT ✍ if you enjoy this idea! Also share your ideas and charts in the comments section below! This is best way to keep it relevant, support us, keep the content here free and allow the idea to reach as many people as possible. **
-------------------------------------------------------------------------------
💸💸💸💸💸💸
👇 👇 👇 👇 👇 👇

GOOGLE Is this sell-off a buy opportunity?Alphabet Inc. (Google/ GOOG) got rejected today on the 1D MA50 (blue trend-line) and it dipped the lowest it has below it since the October 27 2023 Low. That was a Higher Low at the bottom of the 1-year Channel Up pattern.
Technically this decline is following the same pull-back sequence as the June 07 - July 10 2023 pattern. As long as the Channel Up holds or as a measure of last resort, the 1D MA200 (orange trend-line), we will treat this sell-off as a buy opportunity, targeting the 2.236 Fibonacci extension at $168.00, which is where the previous Higher High was priced.
Also keep an eye on the 1D RSI which is piercing the 39.50 symmetrical Support. A break below it means that the stock will be a buy opportunity on the 30.00 oversold RSI barrier regardless.
-------------------------------------------------------------------------------
** Please LIKE 👍, FOLLOW ✅, SHARE 🙌 and COMMENT ✍ if you enjoy this idea! Also share your ideas and charts in the comments section below! This is best way to keep it relevant, support us, keep the content here free and allow the idea to reach as many people as possible. **
-------------------------------------------------------------------------------
💸💸💸💸💸💸
👇 👇 👇 👇 👇 👇

GOOGLE Will it get sold after the Earnings?Alphabet Inc. (Google/ GOOG) is reporting Earnings today and the focus is whether or not they can keep fueling this strong multi-weak rally or cause a correction. Last time we looked into this stock (November 27 2023, see chart below), we gave a pull-back buy signal, which easily hit the 145.00 target:
The price is still on the latest Bullish Leg of the 1-year Channel Up pattern, but is getting very close to its top (Higher Highs trend-line). Having a vastly overbought RSI on the 1D time-frame, which in fact is about to reach 80.00, the level which formed the May 22 2023 RSI top, is starting to call for a medium-term sell.
What we are basically looking for is for a 1D RSI Bearish Divergence like the one in late May 2023. More specifically, if the RSI gets rejected now around 80.00, we will wait for it to form a Lower High and short it, if the price remains on Higher Highs, which was what happened on June 06 2023 and was a 1D RSI Bearish Divergence. Ideally we would prefer the price to be above the 1.786 Fibonacci extension level by then. The sell's Target will be $148.50, preferably marginally below the 1D MA50 (blue trend-line).
-------------------------------------------------------------------------------
** Please LIKE 👍, FOLLOW ✅, SHARE 🙌 and COMMENT ✍ if you enjoy this idea! Also share your ideas and charts in the comments section below! This is best way to keep it relevant, support us, keep the content here free and allow the idea to reach as many people as possible. **
-------------------------------------------------------------------------------
💸💸💸💸💸💸
👇 👇 👇 👇 👇 👇

GOOGLE Buy the pull-back for a $145 Santa's rally.Alphabet Inc (GOOG) gave us a great +20% pre-earnings bullish signal last time we looked at it (July 25) that hit the $140.00 target before pulling back (see chart below):
Right now the price is above the 1D MA50 (blue trend-line), within two Channel Up patterns, with the latter being the (diverging) dotted one. With the 1D RSI hitting its Lower Highs trend-line that has caused technical pull-backs since July 28, we expect a short-term correction near the 1D MA50 and then rebound to price the Channel Up Higher High at $145.00. That will complete a +20% rise from October's bottom, which has been the average % rise for a bullish sequence within 2023.
-------------------------------------------------------------------------------
** Please LIKE 👍, FOLLOW ✅, SHARE 🙌 and COMMENT ✍ if you enjoy this idea! Also share your ideas and charts in the comments section below! This is best way to keep it relevant, support us, keep the content here free and allow the idea to reach as many people as possible. **
-------------------------------------------------------------------------------
💸💸💸💸💸💸
👇 👇 👇 👇 👇 👇

GOOGL with a strong upward breakthrough this weekGOOGL with a strong upward breakthrough this week
This chart shows the weekly candle chart of Google stock over the past year. The graph overlays the bottom to top golden section at the end of 2022. As shown in the figure, Google stock tested the bottom of the chart against the 2.618 position of the golden section three times in July and last week, with a strong upward breakthrough this week! The recent pressure level of Google stock is the 3.000 level at the bottom of the graph above the golden section, which is likely to suppress the market's rise! Google stock is likely to significantly retreat in the future, at least testing the 2.000 position of the golden section in the chart!

Recent high point of Google stock at 2.382 on the Golden Divide!Recent high point of Google stock at 2.382 on the Golden Divide!
This chart shows the weekly candle chart of Google stock over the past year. The graph overlays the low point at the end of 2022 against the golden section. As shown in the figure, the recent high point of Google stock happens to be at 2.382 on the Golden Divide! In the past six weeks, Google stock has been vying for long and short positions around the 2.000 position on the golden section in the chart, but has not effectively touched the strong support below, which is the 1.618 position on the golden section! In the future, Google's stock is likely to strengthen again after hitting the 1.618 or 1.382 positions in the golden section of the chart!

GOOGLE How is it looking before the earnings?It has been very long since we last looked into Google (GOOG) but last time we did (November 07 2022) we gave a massive buy signal (see chart below) at the market's absolute bottom:
The stock price rose +49% since then, giving us one of the most successful low risk trades of the year. With the company reporting its Earnings today though, we shift back to the 1D time-frame where the stock has been trading within a clear Channel Up throughout this recovery phase. Based on the 1D MACD Bearish into Bullish Cross sequence, we may be at a Higher Low leg as on March 13.
As long as the price is trading within the Channel Up and the (dotted) Channel Down, we remain bullish, aiming at a +21% rise (standard inside the Channel Up) and a price target of $140.00. If the price breaks below the Channels' bottoms, we will sell, targeting the 1D MA200 (orange trend-line) at $106.50.
-------------------------------------------------------------------------------
** Please LIKE 👍, FOLLOW ✅, SHARE 🙌 and COMMENT ✍ if you enjoy this idea! Also share your ideas and charts in the comments section below! **
-------------------------------------------------------------------------------
💸💸💸💸💸💸
👇 👇 👇 👇 👇 👇

GOOGLE Ahead of a 1D Golden CrossAlphabet Inc (GOOGL) is about to form a Golden Cross on the 1D time-frame, which is when the 1D MA50 (blue trend-line) crosses above the 1D MA200 (orange trend-line). This is a very bullish pattern, that can be enough to break above the Channel up pattern that the stock has been trading in since the November 03 2022 market bottom. In that case we will target Resistance 1 at 122.50.
If however we get a candle close below the 1D MA200, we will sell towards the bottom of the Channel Up and then buy for a 115.00 Higher High target.
-------------------------------------------------------------------------------
** Please LIKE 👍, FOLLOW ✅, SHARE 🙌 and COMMENT ✍ if you enjoy this idea! Also share your ideas and charts in the comments section below! **
-------------------------------------------------------------------------------
💸💸💸💸💸💸
👇 👇 👇 👇 👇 👇

Google Analysis 22.01.2023Hello Traders,
welcome to this free and educational analysis.
I am going to explain where I think this asset is going to go over the next few days and weeks and where I would look for trading opportunities.
If you have any questions or suggestions which asset I should analyse tomorrow, please leave a comment below.
I will personally reply to every single comment!
If you enjoyed this analysis, I would definitely appreciate it, if you smash that like button and maybe consider following my channel.
Thank you for watching and I will see you tomorrow!

GOOGLE A very bullish 2023 and this chart shows why.Alphabet Inc. (GOOG) broke two weeks ago below its 1W MA200 (orange trend-line) for the first time since the March 2020 COVID crash. The next Support level is the 1W MA300 (red trend-line). Since its IPO, the stock has had very symmetric Cycles which with the help of the Sine Waves can show tops and bottoms for consistent sells and buys.
On this pattern, the price level is not as important as the timing. As you see even the latest (All Time) High was fairly accurately predicted by the Sine Waves. The next bottom is projected to be by the first week of January the latest. As a result, on a multi-year scale investment strategy, the time to buy Google comes closer and closer.
Based on the Fibonacci extension levels involved, every Cycle High is at least +0.5 Fib higher than the previous one (basically only one has been +0.5, the rest have been at least +1.0 Fib). As a result, the High of the next Cycle should be at least on the 4.5 Fibonacci extension, around $198.00!
Can 2023 be such a bullish year for the tech giant amidst the Bear Market of rising inflation?
-------------------------------------------------------------------------------
** Please LIKE 👍, SUBSCRIBE ✅, SHARE 🙌 and COMMENT ✍ if you enjoy this idea! Also share your ideas and charts in the comments section below! This is best way to keep it relevant, support me, keep the content here free and allow the idea to reach as many people as possible. **
-------------------------------------------------------------------------------
You may also TELL ME 🙋♀️🙋♂️ in the comments section which symbol you want me to analyze next and on which time-frame. The one with the most posts will be published tomorrow! 👏🎁
-------------------------------------------------------------------------------
👇 👇 👇 👇 👇 👇
💸💸💸💸💸💸
👇 👇 👇 👇 👇 👇

Google Trade Setup idea 19-september-2022Since the 102 levels for Google has been tested twice it is not holding up, Google's support levels are around 92.
Google's next level of resistance is around 110.
My Plan:
Sold a 93 Put for October 14th Expiry pocketing $110. I'm fine if I google for 93.
