Alphabet (GOOGL) Stock Chart Analysis Following Earnings ReleaseAlphabet (GOOGL) Stock Chart Analysis Following Earnings Release
Earlier this week, we highlighted the prevailing bullish sentiment in the market ahead of Alphabet’s (GOOGL) earnings report, noting that:
→ an ascending channel had formed;
→ the psychological resistance level at $200 was of particular importance.
The earnings release confirmed the market’s optimism, as the company reported better-than-expected profits, driven by strong performance in both its advertising and cloud segments.
In his statement, CEO Sundar Pichai noted that AI is positively impacting all areas of the business, delivering strong momentum.
The company is expected to allocate $75 billion this year to expand its AI capabilities.
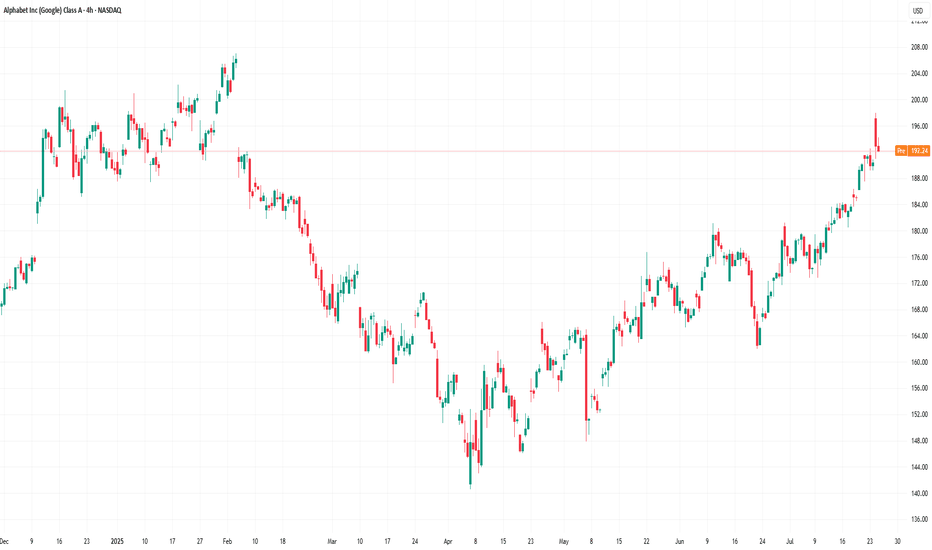
As a result, Alphabet (GOOGL) opened yesterday’s trading session with a bullish gap (as indicated by the arrow). However, as the session progressed, the price declined significantly, fully closing the gap.
This suggests that:
→ the bulls failed to consolidate their gains, allowing the bears to seize the initiative;
→ the ascending channel remains valid, with yesterday’s peak testing its upper boundary;
→ such price action near the $200 level reinforces expectations that this psychological mark will continue to act as resistance.
It is possible that the positive sentiment following the earnings report may weaken in the near term. Accordingly, traders may consider a scenario in which Alphabet’s (GOOGL) share price retraces deeper into the existing ascending channel. In this case, the former resistance levels at $180 and $184 may serve as a support zone.
This article represents the opinion of the Companies operating under the FXOpen brand only. It is not to be construed as an offer, solicitation, or recommendation with respect to products and services provided by the Companies operating under the FXOpen brand, nor is it to be considered financial advice.
Googletrading
GOOGL TRADE IDEA (07/24)
🚨 GOOGL TRADE IDEA (07/24) 🚨
💥 Big institutional flow. 1 DTE. High gamma = high reward (⚠️ high risk too)
🧠 Quick Breakdown:
• Call/Put Ratio: 2.44 → ultra bullish
• Weekly RSI climbing (67.3) 📈
• Daily RSI falling from 77.5 → 🔻 short-term pullback risk
• Reports split: trade or wait? We’re in.
💥 TRADE SETUP
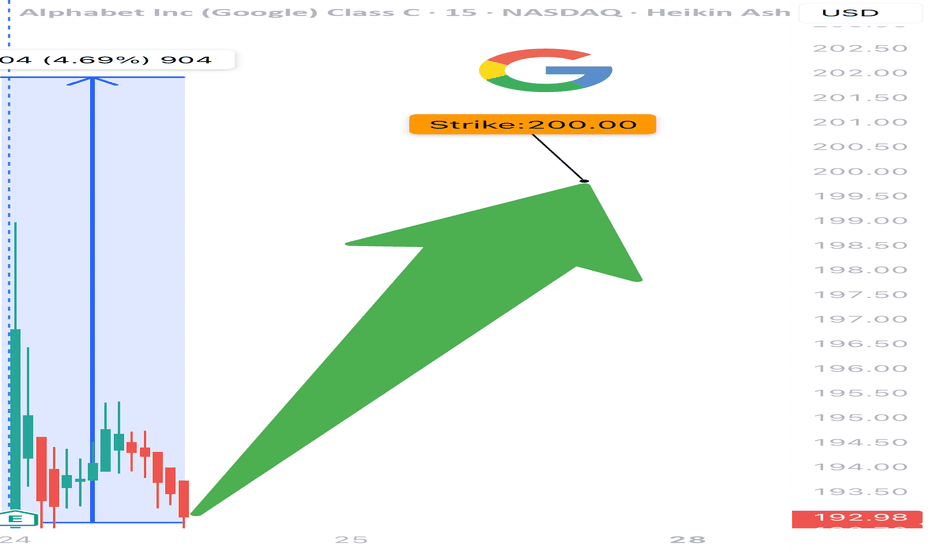
🟢 Buy GOOGL $200 Call exp 7/25
💰 Entry: $2.09
🎯 Target: $3.14–$4.18 (50–100%)
🛑 Stop: $1.25
📈 Confidence: 70%
⚠️ Expiry in 1 day = tight execution needed. Gamma can cut both ways. Watch it like a hawk. 👀
#GOOGL #OptionsFlow #CallOption #GammaSqueeze #TechStocks #UnusualOptionsActivity #TradingView #StockAlerts #BigMoneyMoves #DayTrading #OptionsTrading
GOOG Earnings Setup (2025-07-23)
📈 GOOG Earnings Setup (2025-07-23) 🚀
🔥 STRONG BULLISH BIAS – 85% Confidence
Alphabet (GOOG) is set to report after market close. Here’s why this setup is 🔥:
⸻
📊 Fundamental Highlights:
• 💸 TTM Revenue Growth: +12.0%
• 🧾 Profit Margin: 30.9%
• 💯 Earnings Beat Rate: 8/8 last quarters
• 📈 EPS Est: $8.95
• 🎯 Forward P/E: Attractive in the AI-dominant market
👉 Score: 9/10
⸻
🔍 Options Market Flow:
• 🚀 Heavy Call buying at $195 strike
• 💰 Implied Move: ±5.12%
• 🛡️ Light Put hedging at $190 shows cautious optimism
• 📉 IV Rank: 0.75 (Elevated but tradable)
👉 Score: 8/10
⸻
🧭 Technicals:
• 🔺 RSI: 73.32 (strong momentum)
• 🔼 Above 50/200 MA
• 🔵 Support: $190.00
• 🔴 Resistance: $200.00
👉 Score: 8/10
⸻
🌍 Macro/Sector Tailwinds:
• 🌐 AI & Ads tailwind still fueling growth
• 📡 Sector leadership + resilient biz model
👉 Score: 9/10
⸻
🛠️ Trade Idea (High Conviction)
🔹 Ticker: NASDAQ:GOOG
🔹 Direction: CALL
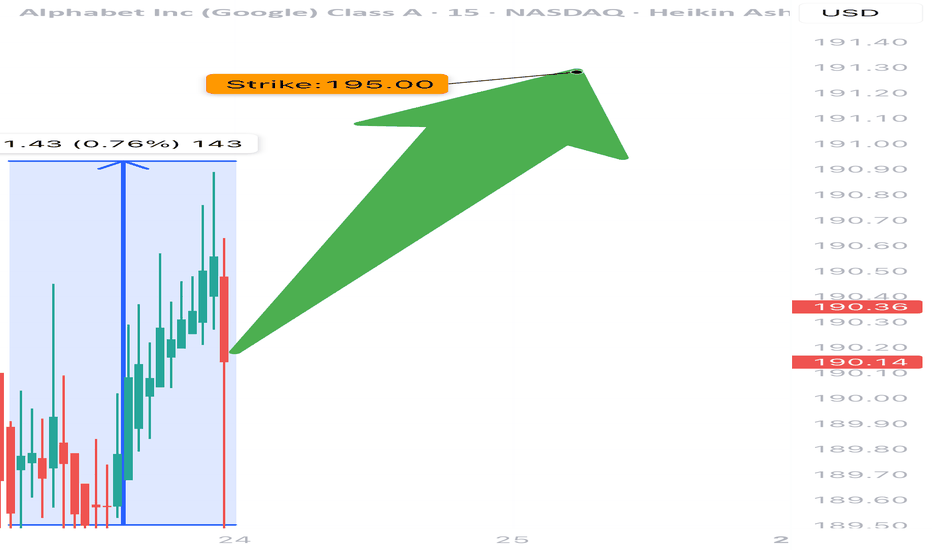
🔹 Strike: $195.00
🔹 Expiry: 07/25/2025
💵 Entry Premium: $3.95
🎯 Target Premium: $11.85 (200%)
🛑 Stop: $1.98 (50%)
📅 Entry: Before 07/23 Close (Pre-Earnings)
⸻
📌 Risk-Reward
• Max Loss: $395 per contract
• Target Gain: $1,190 per contract
• Break-even: $198.95
• ⏳ Time-sensitive: Close post-earnings if flat (avoid IV crush)
⸻
🚨 Summary
💥 GOOG looks primed for an upside breakout. Strong fundamentals + bullish technicals + aggressive options flow make this a top-tier earnings play.
🔔 Watch $195–$200 zone post-earnings.
💬 Drop your thoughts 👇 — are you playing GOOG this earnings?
Alphabet (GOOGL) Stock Approaches $200 Ahead of Earnings ReleaseAlphabet (GOOGL) Stock Approaches $200 Ahead of Earnings Release
According to the Alphabet (GOOGL) stock chart, the share price rose by more than 2.5% yesterday. Notably:
→ the price reached its highest level since early February 2025;
→ the stock ranked among the top 10 performers in the S&P 500 by the end of the day.
The positive sentiment is driven by expectations surrounding the upcoming quarterly earnings report, scheduled for release tomorrow, 23 July.
What to Know Ahead of Alphabet’s (GOOGL) Earnings Release
According to media reports, Wall Street analysts forecast Alphabet’s Q2 revenue to grow by approximately 11% year-on-year, with expected earnings per share (EPS) of around $2.17 — up from $1.89 a year earlier. Notably, the company has consistently outperformed estimates for nine consecutive quarters, setting a positive tone ahead of the announcement.
Despite the optimism, investors are closely monitoring two key areas:
→ Cloud computing competition , where Google Cloud contends with Microsoft Azure and Amazon AWS;
→ Growing competition in the search sector , linked to the rise of AI-based platforms such as ChatGPT.
In response, Alphabet is significantly increasing its capital expenditure on AI infrastructure, planning to spend around $75 billion in 2025. These investments are aimed at both defending its core search business and advancing the Gemini AI model, while also strengthening Google Cloud’s market position.
Technical Analysis of Alphabet (GOOGL) Stock
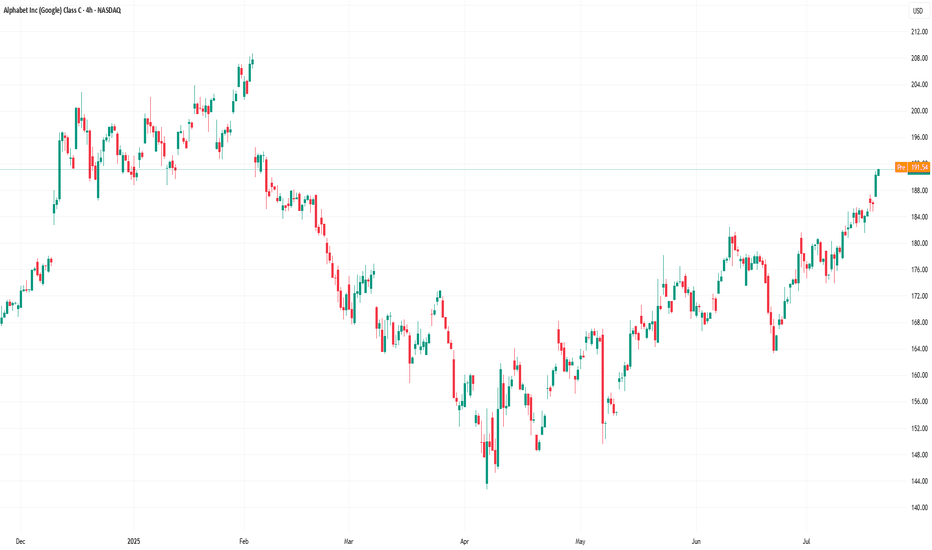
Since April, GOOGL price fluctuations have formed an ascending channel (marked in blue).
From a bullish perspective:
→ the June resistance level at $180 has been breached and may soon act as support;
→ previous bearish reversals (marked with red arrows) failed to gain momentum, suggesting sustained demand is pushing the price higher.
From a bearish standpoint, the price is approaching:
→ the psychological level of $200, which has acted as a major resistance since late 2024;
→ this barrier may be reinforced by a bearish gap formed in early February.
Strong results from the previous quarter, combined with optimistic forward guidance from Alphabet’s management, could provide bulls with the confidence needed to challenge the $200 level.
This article represents the opinion of the Companies operating under the FXOpen brand only. It is not to be construed as an offer, solicitation, or recommendation with respect to products and services provided by the Companies operating under the FXOpen brand, nor is it to be considered financial advice.
Alphabet - The textbook break and retest!📧Alphabet ( NASDAQ:GOOGL ) will head much higher:
🔎Analysis summary:
If we look at the chart of Alphabet we can basically only see green lines. And despite the recent correction of about -30%, Alphabet remains in a very bullish market. Looking at the recent all time high break and retest, there is a chance that we will see new all time highs soon.
📝Levels to watch:
$200
🙏🏻#LONGTERMVISION
Philip - Swing Trader
$GOOGL primed for a BIG MOVE!NASDAQ:GOOGL primed for a BIG MOVE! 🚀
Heading into earnings, this stock’s valuation has been overlooked—but strong results could flip the narrative fast! 💨
✅ Bounced off 2021 highs
✅ RSI at its lowest since COVID
✅ Major indicators curling upward
✅ Volume shelf launch incoming
✅ Wr% pendulum swinging
Momentum is building—are you ready? 👀
Not financial advice
Alphabet (GOOGL) Shares Hover Near Psychological LevelAlphabet (GOOGL) Shares Hover Near Psychological Level Ahead of Earnings Report
On 31 March, we noted that bearish sentiment could push Alphabet’s (GOOGL) share price towards the psychological level of $150. As the current price chart suggests, GOOGL is now trading close to that very level.
Moreover, the price is approximately equidistant from the recent highs and lows (marked A and B), which may be interpreted as a sign of balanced supply and demand — and a wait-and-see stance from market participants ahead of Alphabet’s Q1 earnings release (scheduled for tomorrow, 24 April).
Awaiting the GOOGL Earnings Report
With the Nasdaq 100 index (US Tech 100 mini on FXOpen) having fallen by around 13.5% since the beginning of the year, investors are approaching tech earnings with caution. According to Barron’s, three key themes are expected to dominate the narrative:
→ management forecasts amid continued uncertainty around the White House’s tariff policy;
→ plans for major capital investment in AI-related infrastructure;
→ signs of softening consumer demand.
Given the current climate of uncertainty, Alphabet’s earnings report could prove particularly influential — serving as a benchmark for shaping market expectations ahead of other major tech company reports.
Technical Analysis of Alphabet (GOOGL)
The $150 level has served as key support throughout 2024, and over the coming days it may act as a springboard for a new price movement, potentially driven by the earnings results.
From a bearish perspective, the market remains in a downward trend (indicated in red) following a breakout below the lower boundary of a previously active rising channel (marked in purple) that had held since last autumn. However, if Alphabet’s management maintains an upbeat outlook for 2025, this could give the bulls the confidence to challenge the upper limit of the red channel.
This article represents the opinion of the Companies operating under the FXOpen brand only. It is not to be construed as an offer, solicitation, or recommendation with respect to products and services provided by the Companies operating under the FXOpen brand, nor is it to be considered financial advice.
GOOGLE Long PlanSo here is our plan for entering a Google long position. And you know what the old saying is "plan your trade, and trade your plan".
We will be looking long and hard at the volume profile when we reach that area.
Our last Google trade that we posted it all the Take Profit points, and was great.
So mark this on your chart and set alerts.
GOOGLE: Patiently wait for this level to buy.Google is marginally bullish on its 1D technical outlook (RSI = 57.689, MACD = 5.220, ADX = 40.687) as it has been practically consolidating for the past 2 weeks, having formed a HH (Dec 17th) at the top of the Channel Up. The 1D RSI bearish divergence suggests that this is a top like Nov 7th was. The trend didn't turn into a buy again before hitting the 1D MA50 after a 0.5 Fibonacci pullback and this would be the most optimal level for buying again. Beyond that, since both bullish waves so far have been approximately +23.90%, we expect another such rise to take place. Our target is the 1.5 Fibonacci extension (TP = 225.00).
See how our prior idea has worked out:
## If you like our free content follow our profile to get more daily ideas. ##
## Comments and likes are greatly appreciated. ##
Google I Potential positive growth in the ascending channel Welcome back! Let me know your thoughts in the comments!
** Google Analysis - Listen to video!
We recommend that you keep this pair on your watchlist and enter when the entry criteria of your strategy is met.
Please support this idea with a LIKE and COMMENT if you find it useful and Click "Follow" on our profile if you'd like these trade ideas delivered straight to your email in the future.
Thanks for your continued support!Welcome back! Let me know your thoughts in the comments!
THE STOCK GAUNTLET HAS BEGUN! GOOGLE 1/17⚔️🛡️ THE STOCK GAUNTLET HAS BEGUN! ⚔️🛡️
STOCK/TRADE UPDATE: 1/17
1⃣ NASDAQ:GOOG NASDAQ:GOOGL
Show some love: ❤️
LIKE | FOLLOW | SHARE | BOOKMARK IT
🔔 Hit the bell to be notified when each video drops!
NFA #tradingstrategy #HIGHFIVESETUP
NASDAQ:GOOG NASDAQ:GOOGL
$GOOG $GOOGL IS A GIFT RIGHT NOW. YOU WILL SEE! NASDAQ:GOOG NASDAQ:GOOGL
IS A GIFT. YOU WILL SEE!👀
1.) High Five Setup
2.) Inverse H&S Breakout/will retest and fill earnings GAP then head to the Measure Move (MM) of $193.
3.) They just demolished earnings and everyone was bullish until the market decided to pull back. Everyone just forgot about the ones who reported first out the MAG7.
What do you think? Is this the easiest trade you've ever seen? IMO it's definitely one of them haha
"BE GREEDY WHEN OTHERS ARE FEARFUL"-WB
NFA
GOOGLE Rockets! 15-Min Surge Hits All Targets – What's Fueling?ALPHABET (GOOGLE) Analysis:
Alphabet Inc. (GOOGL) experienced a powerful upward movement in the 15-minute timeframe, achieving all set profit targets with ease using the Risological Swing Trader.
The momentum from a strong earnings report has aligned with a positive risk sentiment across US equity indexes, sparking increased buying interest in tech giants like Alphabet.
Here’s a breakdown of the trade and supporting market context:
Entry : $164.75
Targets Achieved:
TP1: $167.07
TP2: $170.81
TP3: $174.56
TP4: $176.88
Stop Loss (SL): $162.87
Market Sentiment:
Recent quarterly earnings reports have fortified investor confidence, with broader equity indexes advancing. Alphabet's strong fundamentals and growth projections contributed to the bullish sentiment, encouraging traders to follow through on this aggressive buying trend.
With all targets hit in a single session, this upward momentum for Alphabet highlights robust institutional interest and solid fundamentals. Keep an eye on further tech earnings, which may continue to impact Alphabet's trajectory in the upcoming sessions.
GOOGLE (GOOGL) Breaks Out? Bullish Surge on 15m TimeframeGoogle (GOOGL) has shown a bullish breakout following the entry at 163.31, pushing through the first target (TP1) at 165.51 with significant momentum.
Key Levels
Entry: 163.31 – The entry point aligns with a breakout from a period of consolidation, supported by upward movement across key technical indicators.
Stop-Loss (SL) : 161.52 – Positioned below recent support to minimize downside risk and protect against potential pullbacks.
Take Profit 1 (TP1): 165.51 – Already achieved, confirming the initial bullish momentum.
Take Profit 2 (TP2): 169.07 – Represents the next resistance level where profit-taking may occur as the uptrend continues.
Take Profit 3 (TP3): 172.64 – Should the bullish momentum persist, this is the next key resistance level to watch.
Take Profit 4 (TP4): 174.84 – The ultimate target, signaling a strong upward movement.
Trend Analysis
GOOGL is well above the Risological dotted trendline and shorter-term moving averages, indicating a healthy uptrend.
The breakout suggests continued bullish momentum, with TP2 and TP3 likely in focus if the uptrend sustains.
The bullish momentum in GOOGL is evident, with the price moving swiftly past TP1. With solid support from moving averages and strong buying pressure, the next targets at 169.07 and 172.64 are in sight.
GOOGLE: The 3rd major bullish wave begins.Google is just turning from bearish to neutral today on the 1D time-frame (RSI = 44.178, MACD = -4.950, ADX = 38.408), same situation also on its 1W outlook, as the stock recovers from the 1W MA50 breach last week. The green weekly close today is positive as it restored the price back inside the 2year Channel Up. A second straight green candle next week, will validate the start of Google's new 250day bullish wave, with the two before it rising by approximately +60% each.
If you are a long term investor, wait for next week's candle close and if green, buy (TP = 230.00).
See how our prior idea has worked out:
## If you like our free content follow our profile to get more daily ideas. ##
## Comments and likes are greatly appreciated. ##
GOOGLE SHORT TIMING? reached important resistance level?
we could see that it is rebounding from an overall downtrend market.
And it's closed to the resistance area of previous lows, which shares the same level with the downtrend line, double confirmed the importance of this resistance area.
So if it be rejected by this area, and start to showing sell signals like bearish engulfing pattern etc, the price may continue to drop.
Google Takes Flight: Soaring Valuation, Strong Earnings, and RewAlphabet Inc., Google's parent company, is experiencing a period of phenomenal growth. The tech giant is on the cusp of a historic milestone – a market capitalization approaching $2 trillion. This achievement comes alongside impressive quarterly earnings that surpassed analyst expectations, solidifying investor confidence. Further sweetening the deal for shareholders, Alphabet recently distributed its first-ever dividend and announced a substantial $70 billion stock buyback plan.
The meteoric rise in market value reflects investor optimism about Google's future. The company's core advertising business remains robust, fueled by the ever-increasing reliance on digital marketing. Google's dominance in search and its expansive network of online properties continue to generate significant advertising revenue. But Google's ambitions extend far beyond traditional advertising.
The company is at the forefront of artificial intelligence (AI) development. Its investments in AI research and applications are paying off, with innovations like Google Assistant and DeepMind showcasing the transformative potential of this technology. AI is being integrated across various Google products, enhancing user experiences and driving new revenue streams.
Another key driver of growth is Google Cloud. This segment, often overshadowed by the advertising juggernaut, is steadily gaining traction. Cloud computing is a rapidly expanding market, and Google Cloud is well-positioned to capture a significant share. With its robust infrastructure, suite of cloud services, and focus on security, Google Cloud is attracting major corporations looking for reliable and scalable solutions.
The recent surge in stock price also reflects the success of Alphabet's first-ever dividend payout. This move signals a shift in the company's strategy, acknowledging the growing base of long-term investors seeking regular returns. The dividend, coupled with the sizable stock buyback program, demonstrates Alphabet's commitment to rewarding shareholders and returning value. The buyback plan will reduce the number of outstanding shares, potentially driving up the stock price further.
However, Google's path to continued dominance isn't without challenges. Regulatory scrutiny over data privacy and antitrust concerns remain significant hurdles. The company faces intense competition from other tech giants like Apple and Amazon, all vying for dominance in the digital landscape. Additionally, the broader market environment could impact Google's performance. Economic downturns or fluctuations in interest rates could dampen investor confidence and affect advertising spending.
Despite these challenges, Google's future appears bright. The company has a proven track record of innovation, a diversified business model, and a strong financial position. With its recent stellar earnings report, soaring market value, and commitment to rewarding shareholders, Google is well-positioned to maintain its position as a tech leader for years to come.
GOOGL : Target 200$ based on Fib ProjectionGOOGL : Target 200$ based on Fib Projection
Previous High of 153$ to 154$ made during Jan end 2024 is overtaken and a new high is made. With this, it looks attractive to target the Fib Projection of 1.78 at 200$
Daily TF :
for understanding the smaller TF than weekly


