GBPUSD – DAILY FORECAST Q3 | W31 | D29 | Y25📊 GBPUSD – DAILY FORECAST
Q3 | W31 | D29 | Y25
Daily Forecast 🔍📅
Here’s a short diagnosis of the current chart setup 🧠📈
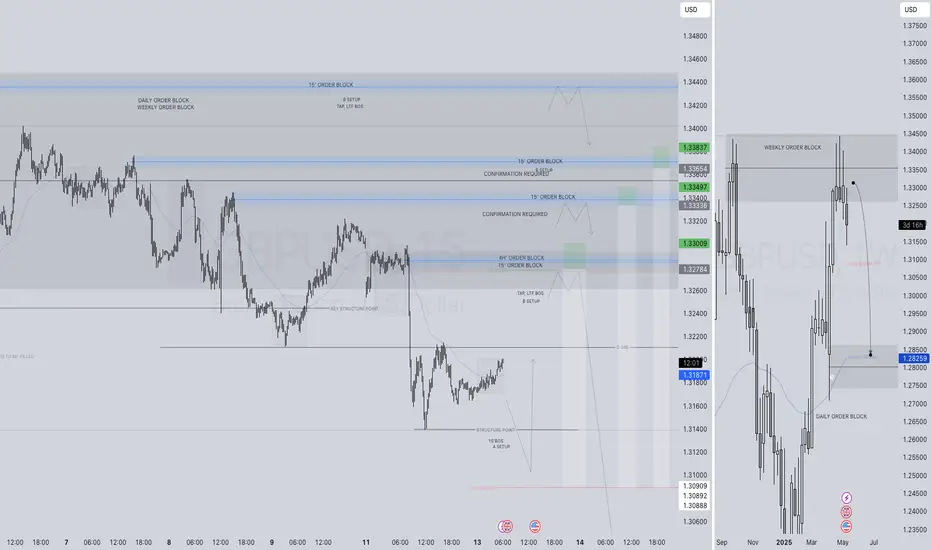
Higher time frame order blocks have been identified — these are our patient points of interest 🎯🧭.
It’s crucial to wait for a confirmed break of structure 🧱✅ before forming a directional bias.
This keeps us disciplined and aligned with what price action is truly telling us.
📈 Risk Management Protocols
🔑 Core principles:
Max 1% risk per trade
Only execute at pre-identified levels
Use alerts, not emotion
Stick to your RR plan — minimum 1:2
🧠 You’re not paid for how many trades you take, you’re paid for how well you manage risk.
🧠 Weekly FRGNT Insight
"Trade what the market gives, not what your ego wants."
Stay mechanical. Stay focused. Let the probabilities work.
FX:GBPUSD
Gpbusd

GBPUSD SHORT FORECAST Q2 W20 D13 Y25GBPUSD SHORT FORECAST Q2 W20 D13 Y25
Professional Risk Managers👋
Welcome back to another FRGNT chart update📈
Diving into some Forex setups using predominantly higher time frame order blocks alongside confirmation breaks of structure.
Let’s see what price action is telling us today!
💡Here are some trade confluences📝
✅Weekly order block rejection
✅Daily order block rejection
✅Intraday 15' order blocks
✅Tokyo ranges to be filled
🔑 Remember, to participate in trading comes always with a degree of risk, therefore as professional risk managers it remains vital that we stick to our risk management plan as well as our trading strategies.
📈The rest, we leave to the balance of probabilities.
💡Fail to plan. Plan to fail.
🏆It has always been that simple.
❤️Good luck with your trading journey, I shall see you at the very top.
🎯Trade consistent, FRGNT X
GBPUSD needs to fill an imbalance at the upsideGBPUSD has had it's short term retracement after a rally to the upside. It is now looking like a reversal back bullish at least to the last unfilled imbalance at the 1.3365 area. It may also break though it and continue to go up due to the dollar weakening.

$GBIRYY - U.K CPI (March/2025)ECONOMICS:GBIRYY 2.6%
March/2025
source: Office for National Statistics
- The annual inflation rate in the UK slowed to 2.6% in March 2025 from 2.8% in February and below market and the BoE's forecasts of 2.7%.
The largest downward contributions came from recreation and culture (2.4% vs 3.4%), mainly games, toys and hobbies (-4.2%) and data processing equipment (-5.1%). Transport also contributed to the slowdown (1.2% vs 1.8%), largely due to a 5.3% fall in motor fuel prices.
In addition, prices rose less for restaurants and hotels (3%, the lowest since July 2021 vs 3.4%), mostly accommodation services (-0.6%); housing and utilities (1.8% vs 1.9%); and food and non-alcoholic beverages (3% vs 3.3%).
In contrast, the most significant upward contribution came from clothing and footwear (1.1% vs -0.6%), with prices usually rising in March as spring fashions continue to enter the shops.
Compared to the previous month, the CPI edged up 0.3%, slightly below both the previous month’s increase and expectations of 0.4%.
Annual core inflation slowed to 3.4% from 3.5%.

GBPUSD SHORT FORECAST Q2 W15 Y25 MONDAY 7TH APRIL 2024GBPUSD SHORT FORECAST Q2 W15 Y25 MONDAY 7TH APRIL 2024
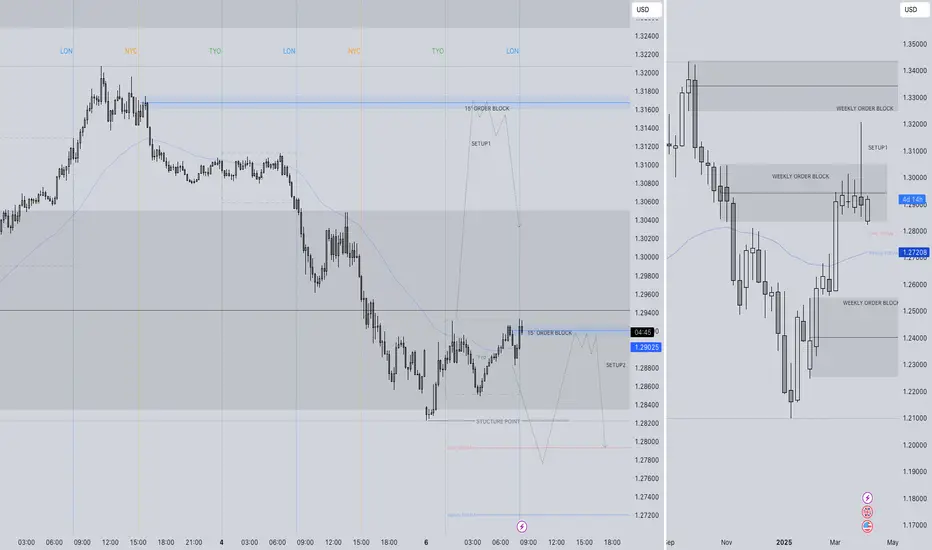
First and full most, It looks good! However, it's important to approach with caution... much like always.
Pay attention to the previous weekly closure. Yes is it showing a rejection BUT in terms of us always expecting a wick fill prior trading in the opposing direction, Would an immediate short make sense?
We need to see clear price action showing us that it is not interesting in retracting the previous weekly wick with clear bearish movement.
More on the set up descriptions later in terms of text but I trust the chart analysis speaks 1000 words.
FRGNT X
SHORT ON GBPUSDGBPUSD has reached a key supply area and has given a change of character from up to down on the hour timeframe.
There is plenty imbalance/fvgs to the downside that I expect price to go and fill.
The Dollar Index is currently shifting to up from down, this should aid in this pair falling.
I will be selling GBPUSD to the next demand level for 300 pips.

GBP/USD Bullish Setup with EMA Cross & Strong SupportGBPUSD TRADE ALERT : TRADE LONG
Trade Setup
Entry: Buy at 1.26000
Stop Loss: 1.25500 (-50 pips)
Take Profit Targets:
TP1: 1.26350 (+35 pips)
TP2: 1.26700 (+70 pips)
TP3: 1.27000 (+100 pips)
Technical Confirmation
EMA7 Crosses Above EMA21 & EMA50 → Short-term bullish signal
EMA21 Crosses Above EMA50 → Stronger uptrend confirmation
Support Level at 1.25750 → A key level to watch for price holding
Risk Management
Risk-to-Reward Ratio (RRR):
TP1: 0.7:1 (not ideal)
TP2: 1.4:1 (acceptable)
TP3: 2:1 (good)
Position Sizing: Ensure you risk only 1-2% of your account per trade.
Additional Considerations
Watch for price action signals around the support at 1.25750.
If price struggles at TP1 (1.26350), consider moving SL to breakeven.
Keep an eye on news events (e.g., NFP, CPI, FOMC) that can impact GBP/USD.

Fundamental Market Analysis for March 3, 2025 GBPUSDThe US Dollar Index (DXY), which tracks the dollar against a basket of currencies, started the new week on a weak note and has already cancelled out most of Friday's gains to more than a one-week high.
The British Pound (GBP), on the other hand, continues to post relative gains amid expectations of a less aggressive easing policy from the Bank of England (BoE). That said, concerns over US President Donald Trump's retaliatory tariffs and their impact on the UK economy may keep GBP bulls away from new bets. In addition, geopolitical risks could limit deeper USD losses and limit GBP/USD gains.
Meanwhile, signs that the disinflation process in the US has stalled, reinforcing the case for the Fed to take a wait-and-see approach to future interest rate cuts, could also serve as a tailwind for the USD. This could help to further contain GBP/USD and warrant some caution before positioning for a resumption of the recent uptrend from levels below 1.2100, or the yearly low reached on 13 January.
The main focus will be on the closely watched monthly US employment data on Friday. The widely-reported Nonfarm Payrolls (NFP) figure will shape expectations on the path of the Fed rate cut and drive demand for the dollar in the near term.
Trading recommendation: BUY 1.2610, SL 1.2560, TP 1.2690

EURUSD GOING UPEUR/USD: Why It’s Heading Higher
Technical Analysis:
The EUR/USD is showing bullish momentum, breaking above key resistance levels. The pair is trading above its 50-day and 200-day moving averages, confirming an uptrend. A bullish crossover in the MACD and rising RSI suggest further upside potential. Key resistance is at 1.10, with support holding strong at 1.085. A breakout above 1.10 could open the path toward 1.12.
Fundamental Analysis:
The Euro is supported by robust economic data, including better-than-expected PMI figures and hawkish signals from the ECB. Meanwhile, the USD is under pressure as the Fed signals a pause in rate hikes amid cooling inflation. Diverging monetary policies and improving sentiment in the Eurozone favor further EUR/USD gains.
Keep an eye on upcoming ECB speeches and U.S. employment data for potential volatility.

GOLD MICRO ANALYSISAnd this is what the micro view looks like. If you've not seen our precedent post on the macro view, you should check it out so you get the global scheme of the move.
The red line has to be reached at some point over the next few weeks, maybe even days, because Gold has a "desert area" to cross : this is the area where there's no blue lines, which are basic KL.
What we believe is that when there 's no or not enought KL, the price moves way faster, hence the green drawing.

Sell, Sell, Sell GBP/USD from 1.26341Using both HTF and LTF analysis and comparing this to the Dollar we can see that the pound will drop this week.
From market open we can expect price to either take the ASH tapping into the 4H supply and continue in the downtrend from last week taking the ASL and further breaking structure to the downside.
However, there is also an ASH above so it is possible price may push up slightly in order to grab liquidity and continue pushing down. With the extreme bearish euphoric price movement price may have already taken enough liquidity in order to respect the ASH and just move to the downside with no point of entry.
Regardless of the way price decides to move when the markets open and asian session is in play, I expect price to push down as we have seen a heavy downtrend.

EURUSD strategic outlook: BEARS will target 1.0500🔸Hello guys, today let's review H8 price chart for eurusd. Previously
recommended buying low near 1.0650, TP hit +400 pips, congrats
if you followed. you can review original setup via link below.
🔸Range lows defined at 0650 , range highs set at 1050/1100.
This is the active trading range for EURUSD since early 2023 it's
well-defined and it's very unlikely that price will exit this range
any time soon (not until 2026).
🔸Currently we got a strong rejection near range highs at 1100
and this resistance is too strong for the bulls to break atm,
price was already rejected multiple times from this level.
there are no bullish catalysts in euro zone to break 1.10/1.11 S/R.
🔸Recommended strategy position traders: bears focus on short selling rips/rallies, targeting range lows at 0500/0550. Bears will take over from
here, so there is no valid setup for bulls on buy side. Keep in mind
that this is a swing trade setup and provided low volatiliy in EURUSD
it may take a while to hit the targets (multiple weeks).
🎁Please hit the like button and
🎁Leave a comment to support our team!
RISK DISCLAIMER:
Trading Futures , Forex, CFDs and Stocks involves a risk of loss.
Please consider carefully if such trading is appropriate for you.
Past performance is not indicative of future results.
Always limit your leverage and use tight stop loss.

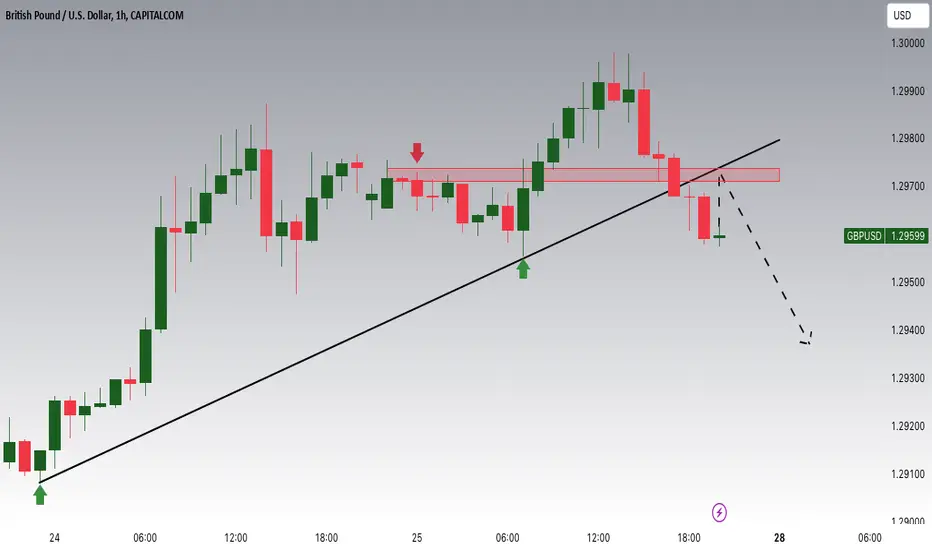
GBPUSD Breakout And Potential RetraceHey Traders, in today's trading session we are monitoring GBPUSD for a selling opportunity around 1.29750 zone, GBPUSD was trading in an uptrend and successfully managed to break it out. Currently is in a correction phase in which it is approaching the retrace area at 1.29750 support and resistance area.
Trade safe, Joe.
GBPUSD SELL ANALYSIS RISING WEDGE PATTERNSell Gbpusd when then the price to 1.30690 on 4hrs timeframe take profit target should be like 1.25379 . use money management

WEEKLY FOREX FORECAST SEPT 16-20 USD EUR GBP AUD NZD CAD CHF JPYThis is Part 2 of the Weekly Forex Forecast for SEPT 16-20th.
In this video, we will cover:
USD Index, EURUSD, GBPUSD, AUDUSD, NZDUSD, USDCAD, USDCHF, USDJPY
Enjoy!
May profits be upon you.
Leave any questions or comments in the comment section.
I appreciate any feedback from my viewers!
Like and/or subscribe if you want more accurate analysis.
Thank you so much!
Disclaimer:
I do not provide personal investment advice and I am not a qualified licensed investment advisor.
All information found here, including any ideas, opinions, views, predictions, forecasts, commentaries, suggestions, expressed or implied herein, are for informational, entertainment or educational purposes only and should not be construed as personal investment advice. While the information provided is believed to be accurate, it may include errors or inaccuracies.
I will not and cannot be held liable for any actions you take as a result of anything you read here.
Conduct your own due diligence, or consult a licensed financial advisor or broker before making any and all investment decisions. Any investments, trades, speculations, or decisions made on the basis of any information found on this channel, expressed or implied herein, are committed at your own risk, financial or otherwise.

GU can go either way now. Waiting for more dataNeed to see more before standing firm on a direction. With the recent bullish breakout I want to how it reacts the next 2 days before the fed rate announcements.

Gold next move (weekly forecast)(02-06 Sep-2024)Go through the analysis carefully, and do trade accordingly.
Immediate resistance- 2520-2525
Immediate support- 2499-2504
last cluster of support area- 2490-94
Potential resistance- 2545-2550
Swing range -2460-2465
if price breaks the last cluster of support i.e. 2490-2494, then price may approach to the swing area 2460-2465.
if price breaks the immediate resistance than, then price may break the All Time High and approach to potential resistance i.e. 2545-2550
Anup 'BIAS for the week (02-06 Sep-2024)
Current price- 2503
"if Price stays above 2490-2493, then next target is 2522, 2532 and 2545 and below that 2465-2470."
Advise-
if price reject from the 2520-2525 area and approach to 2500-2505 area, that will be the good zone for buying.
-POSSIBILITY-1
Wait (as geopolitical situation are worsening )
-POSSIBILITY-2
Wait (as geopolitical situation are worsening)
Best of luck
Never risk more than 1% of principal to follow any position.
Support us by liking and sharing the post.


It will correct the previous declineThere was a decline in the previous period without any correction, so it will rise to the top

BTCUSDT Long Setup (13 Jul)Hello my friends.
I think BTCUSDT must fill FVG area.
I am waiting for retest buy zone for entry.
Note that there is a fresh nested 5M order block on 1H orderblock

🆕 GBPUSD...Curve Analysis 🆕(Based on the 1D Chart)
SLO2 @ 1.2779
SLO1 @ 1.2728
SSO @ 1.2700
TP1 @ 1.2632
TP2 @ 1.2551 (mid-pivot)
TP3 @ 1.2492
TP4 @ 1.2400
BLO1 @ 1.2378 ⏳
BLO2 @ 1.2325 ⏳ (support)
It appears that PA may want to turn to the downside from somewhere within this Resistance Range of 1.2700 to 1.2779 (see Sell Limit Orders above)
If this works out I'm anticipating a roughly +325 pip opportunity to short

FOREX FORECAST GBPUSD -13TH - 17tH MAY 2024Here on GBPUSD price still in uptrend and likely to move again after touching psychological level of 1.25000 . So is expected to wait for the price reach to another psychological level which is 1.25500 before entering another trade.

🧑🎓 XAU/USD Signals 📈 UPDATED MORE READ THE CAPTION?By Wolrd Forex Traders hello 👋
" Gold Market Analysis 💡📊👀
1H Time Frame Chart 📈🕒
_Bullish Signal 🚀👍_
We're seeing a strong long opportunity in the Gold market, with a current price of 2301. Our target is 2336, which is a key resistance level. A breakout above this level will likely lead to a significant price increase! 📈💸
_Analysis 🤔📊_
The 1H time frame chart shows a clear bullish trend, with a series of higher highs and higher lows. The Relative Strength Index (RSI) is indicating a strong bullish signal, and the Moving Averages are aligned, providing additional confirmation for a long position. 💪📈
_Trade Strategy 💰📈_
Buy: 2301 (long)
Target: 2336 (next resistance level)
Stop Loss: 2270 (bullish warning) ⚠️🚨
If the breakout occurs at 2336, the next target is 2360. 🎯
Note: This analysis is based on a 1H time frame chart and is subject to market changes and fluctuations. Always use proper risk management techniques and consult with a financial advisor if necessary. 📊💼
Follow me for more market insights and analysis! #Gold #XAUUSD #tradingview #bullish #marketanalysis #trading #finance #investing"
