GPS LONG to $70-$80Now correction ending after 3d wave. See the loading volume. Fundamentally, the company looks good. 5th wave should be 65-100% from the 1st wave so can expect a price at $70. Good time to buy
GPS


NEW POSITIONS $GPS Target 37.60 for 20.78% + DIVY$GPS Target 37.60 for 20.78%
Or double position at 24.66
OOOOh, this one has a divy too. ☀️
—
On the far right of the chart is my Average (Grey) Current Target (Green), and Next Level to add (Red) Percentage to target is from my average.
I start every position with 1% of my account and build from there as needed and as possible.
I am not your financial advisor. Watch my setups first before you jump in… My trade set ups work very well and they are for my personal reference and if you decide to trade them you do so at your own risk. I will gladly answer questions to the best of my knowledge but ultimately the risk is on you. I will update targets as needed.
GL and happy trading.

Gap before EarningsNYSE:GPS fired off a bullish signal this morning at a support level that fit my rules for a long trade entry. I'll be watching this closely through the week as the stock has Earnings on 5/27 which can be a maker or breaker of a great trade.


GPS - Getting ready to break out of a 20 year base ?!I'm late to the party here but we have clean price action and wave count, we can therefore take advantage of the smaller mouvements not only the bigger ones.
In this case, I'm waiting for the orange wave iv pullback to start initiating some longs that could yield some 20%-25% without much risk.
Red wave iv will be the more interesting move afterwards.
Btw this stock has been consolidating since 2000 and could get ready to breakout !
And you know the saying, the bigger the base, the bigger the breakout !
So, definitely keep this one on your watchlist and even think about putting it on your longer term portfolio.
Another very interesting aspect is that Dividends could come back soon!

Long | GPSNYSE:GPS
Possible Scenario: LONG
Evidence: Price Action
This is my idea and could be wrong 100%.


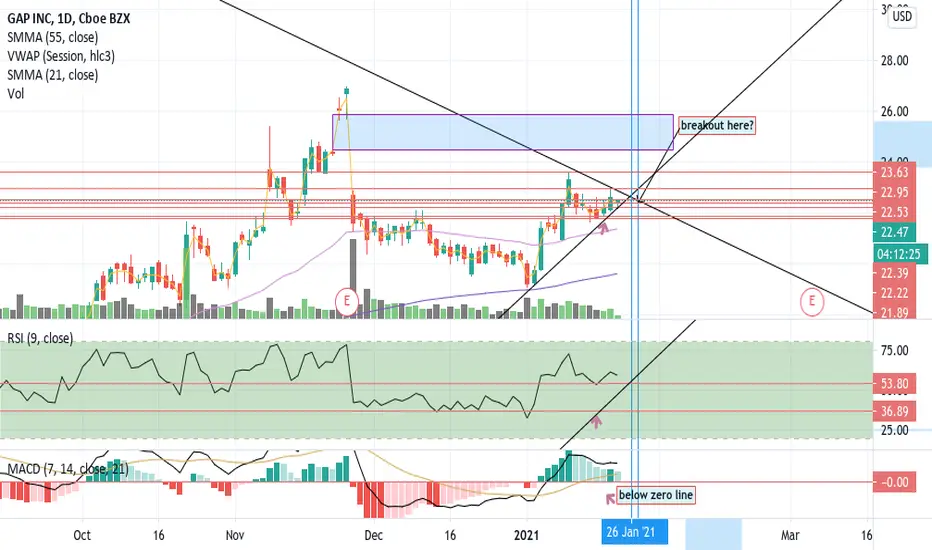

THE WEEK AHEAD: GPS EARNINGS; KRE, XLE, EWZ, IWM/RUTEARNINGS:
Only one underlying makes my cut for a earnings announcement volatility contraction play: GPS (25/70/14.9%),* which announces on Tuesday after market close, so look to put on a play in the waning hours of Tuesday's session.
To me, it's small enough to short straddle, with the pictured setup paying 3.72 (.93 at 25% max). Alternatively, go short strangle: the December 18th 22/29 was paying 1.25 (.62 at 50% max).
Of a defined risk bent? Go iron fly with the December 18th 20/25/25/30 and get better than risk one to make metrics, with the setup paying 3.00 even as of Friday close (.75 at 25% max).
EXCHANGE-TRADED FUNDS RANKED BY BANG FOR YOUR BUCK (JANUARY 15TH EXPIRY):
KRE (22/40/14.0%) (Yield: 3.43%)
XLE (25/43/12.5%) (Yield: 6.15%)
EWZ (17/43/12.2%) (Yield: 2.89%)
GDX (13/37/11.7%) (No dividends)
SLV (22/37/10.8%) (No dividends)
BROAD MARKET RANKED BY BANG FOR YOUR BUCK (JANUARY 15TH EXPIRY):
IWM (24/30/8.5%)
QQQ (20/26/7.6%)
SPY (18/23/6.2%)
EFA (16/19/5.3%)
* -- The first metric is volatility rank/percentile (i.e., where 30-day implied volatility is relative to where it's hung out the past 52 weeks); the second, 30-day implied; and the third, what the December at-the-money short straddle is paying as a function of stock price ("Bang for Your Buck").

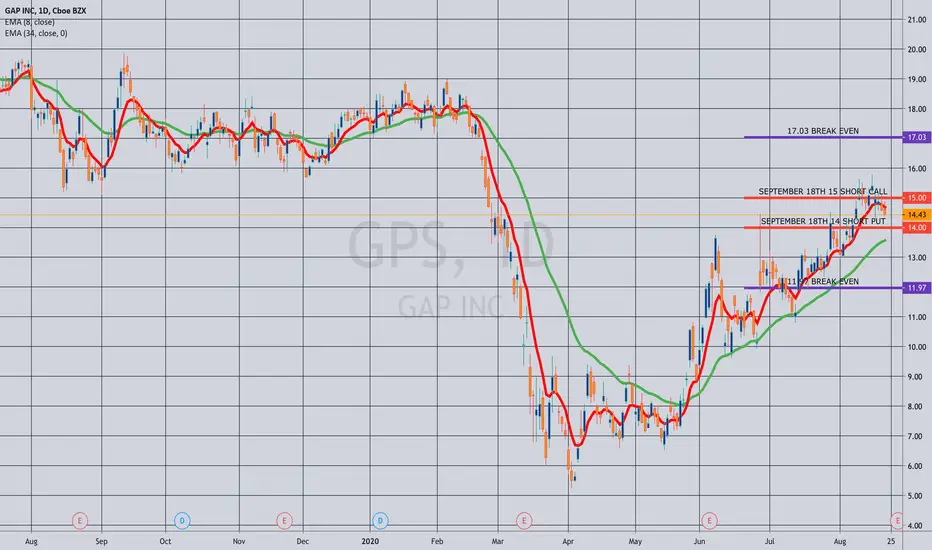
LATE POST/OPENING: GPS SEPTEMBER 18TH 12/17/17/22 IRON FLY... for a 2.49 credit.
Metrics:
Max Profit: $249/contract
Max Loss: $251/contract
Break Evens: 14.51/19.49
Delta/Theta (Currently): -8.91/3.12
Notes: Couldn't post this yesterday due to the number of "Update" posts I did ... .
High implied at 87.5% with earnings to be announced today after the close. A classic risk one to make one iron fly which I'll look to take profit at 25% max.

THE WEEK AHEAD: GPS; SLV, GDX/GDXJ, XOP, IWM/RUTEARNINGS:
GPS (37/82/17.0%) is really the only earnings announcement that interests me from a volatility contraction perspective. Pictured here is a September 18th skinny short strangle, which was paying 2.03 as of Friday close.
EXCHANGE-TRADED FUNDS SCREENED FOR IMPLIED >35% AND WHERE THE OCTOBER AT-THE-MONEY SHORT STRADDLE IS PAYING >10% OF STOCK PRICE:
SLV (50/61/17.4%)
GDX (22/47/14.1%)
XLE (21/37/11.6%)
GDXJ (19/55/16.7%)
EWZ (18/45/13.2%)
XOP (14/49/14.0%)
Juice as a function of stock price resides in SLV (17.4%), followed by GDXJ (16.7%), GDX (14.1%), and XOP (14.0%).
BROAD MARKET:
QQQ (23/28/8.2%)
IWM (23/29/8.4%)
EFA (17/21/5.6%)
SPY (16/22/5.8%)
IWM/RUT is where the premium is, relatively speaking, followed by the QQQ's.
DIVIDEND YIELDERS:
XLU (18/22/6.8%)
EWA (18/22/7.8%)
EWZ (18/45/13.2%)
IYR (17/22/6.9%)
EFA (16/22/5.6%)
SPY (16/22/5.8%)
HYG (15/13/3.3%)
TLT (14/16/4.6%)
EMB (11/10/2.8%)
Brazil ... again?!

GPS Ascending ChannelHello Community!
Before we begin please support my idea with a thumbs up and a comment. It'll be greatly appreciated and will motivate me to post a little more!
Lets keep it simple.
We see GPS Inc trading in an ascending channel on the daily. If it plays out perfectly it'll pass $15 to retest the top of the channel which is just about the same location as the next major resistance zone "Top Green Line". If it gets rejected there's a good chance it'll retest the bottom on the channel "Bottom Green Line" which is right around $12. Let's watch closely.
This is not Financial advice.
Safe Trading Calculate Your Risk/Reward & Collect!
Simplicity Wins

$GPS in a higher degree Impulse Wave 1 of 1 Disclaimer: I have been trading in the markets for about a year. After several months of charting various instruments, my eyes have gotten trained to recognize different candle formation patterns like Bear & Bull Flags, Head & Shoulders, and others. This was good. But, not enough for me to accurately forecast the next following moves and market structure after these patterns had been completed.
For me my next evolution as a Trader came with a more fine-tuned approach to Market Structure, The Elliott Wave Theory. There are two books that were recommended to me as I started this journey.
1. Elliott Wave Principle: Key to Market Behavior by Robert Prechter and A. J. Frost, www.elliottwave.com
2. Visual Guide to Elliott Wave Trading by Wayne Gorman and Jeffrey Kennedy, www.elliottwave.com
I am still learning. I accept the fact that my analysis may be wrong. But, these are my charts as I continue my journey. I am open to all feedback on my analysis as I continue to improve.


rejected at trend lineTook some august 10P's here. If Kanye can't help you breakout then no one can. $XRT

GPS before EarningsGreat entry point at current price before earnings report tomorrow AMC. Incredible technicals throughout for this stock, could quickly see 19-19.50 with highs of 21 post-earnings day. GPS is bullish as long as it doesn't go below 16.07 and closes today and tomorrow above 16.26.

THE WEEK AHEAD: HD, LOW, TGT, GPS, M EARNINGS; /NG, VIX, VXXEARNINGS:
HD (24/21) (Tuesday Before Market)
LOW (68/35) (Wednesday Before Market)
TGT (66/37) (Wednesday Before Market)
GPS (60/53) (Thursday After Market)
M (97/67) (Thursday Before Market)
Pictured here is an M short straddle at the 17 strike in the December cycle, paying 2.73 with 14/72/19.73 break evens, and delta/theta metrics of -4.49/3.77. Look to put on a play on Wednesday before the end of the New York session.
In second place for ideal volatility contraction metrics is GPS (60/53). As with M, I would short straddle here, with the December 20th 18 paying 2.22 with 15/78/20.22 break evens, and delta/theta metrics of 1.29/3.06.
EXCHANGE-TRADED FUNDS:
TLT (42/12)
EEM (40/17)
SLV (29/20)
EWZ (26/27)
FXI (26/19)
... with the first expiry in which the at-the-money short straddle pays more than 10% of the value of the underlying: TLT, January '21; EEM, June; SLV, July; EWZ, March; and FXI, May. Both the rank/implied metrics, as well as the short straddle value metric indicate that it's probably a good time to hand sit on selling shorter duration premium here.
BROAD MARKET:
With VIX finishing the week at 12.05, volatility is at or near 52 week lows here in all the majors: SPY's in the 6th percentile; IWM in the 4th; and QQQ at 0.
The first expiry in which the at-the money short straddle pays greater than 10% of the value of the underlying: SPY, Sept; IWM, June; and QQQ, June. Both the rank/implied metrics, as well as the short straddle value metric indicate that it's probably a good time to hand sit on selling shorter duration premium here.
FUTURES:
/6B (63/11)
/NG (40/59)
/ZS (30/20)
/SI (29/19)
/CL (24/33)
As I may have mentioned last week, it's no surprise that /NG volatility is frisking up here. Generally, I play natty for seasonality, so look to get in with something bullish assumption at seasonal lows/peak injection, bail out of the long delta position in January or February depending on how Mother Nature feels, and then look to ride the elevator down in the opposite direction with a short delta position. I'm not keen on selling nondirectional premium (e.g., iron condors), particularly given what natty did last winter, so am sticking with my traditional, no-nonsense seasonality play.
Another item of note: GVX (gold volatility) has dropped substantially here, finishing the week at 11.22, in the 23rd percentile for the year ... .
VIX/VIX DERIVATIVES:
As previously mentioned, VIX closed the week at near 2019 lows (12.05), with the December, January, and February /VX contracts trading at 15.09, 16.60, and 17.50, respectively. Consequently, VIX term structure trades are still viable in the January and February expiries, but would probably beg off a December setup in the absence of a pop that runs that contract up to >16; the 16 strike is generally the lowest I will go with the short option leg of a VIX term structure trade.
As far as derivatives are concerned, this definitely isn't the place to be adding shorts. While it may be that VIX hangs out at these levels for a lengthy period of time, shorts are most productive on VIX pops -- not at VIX lows, even if contango and beta slippage are really working in shorts' favor here. As we all know, both the current steep contango and low VIX levels can evaporate in a heartbeat. If anything, this may be one of the rare occasions to consider a small bullish assumption trade (e.g., a VXX December 20th 15/17/17/19 "Super Bull,"* paying a .20 credit, with max profit/loss metrics of 2.20/1.80 and a break even of 16.80 versus the 17.40 where VXX is currently trading).
* -- A 15/17 short put vertical combined with a 17/19 long call vertical.

~10% 3 weeks or less. GPS Earnings run up.After a recent reversal and a history of higher low support GPS is poised to have a 10% run up into earnings. RSI and Stochastic give additional support.
With a very solid P/E of 6.67, it's one of the lowest in the retail clothes sector. With minimal Debt/Equity of 0.34 and a Current Ratio of 1.50
We can even choose to hold through earnings for additional gains and with an attractive dividend of 5.73%.
GPS is more than just Gap. Their Lulu Lemon-esque brand Athleta is expected to have a record year. Old Navy revenue has also been on the rise.

GPS BUY SETUPGPS reached on strong weekly support level. possibly will go long. wait for 123 pattern for entry. I also watching this one .

GPS bottomGPS is at 3y low and just an 80c near 8y low, with an average price target at $20.50 price range. Don't forget for their dividend which is 5.56%!!!
