GRIFFAIN Chart Signals Bullish Rally$GRIFFAIN is forming a bullish ascending triangle pattern on the daily chart, signaling a potential breakout. Price is consolidating just below key resistance at $0.048, supported by a strong ascending trendline and a historical support zone.
A breakout above the triangle could trigger a sharp move toward the $0.15 level, offering a potential upside of over 100%-200%. The setup suggests growing bullish momentum and a possible trend reversal.
BITGET:GRIFFAINUSDT
GRIFFAINUSDT

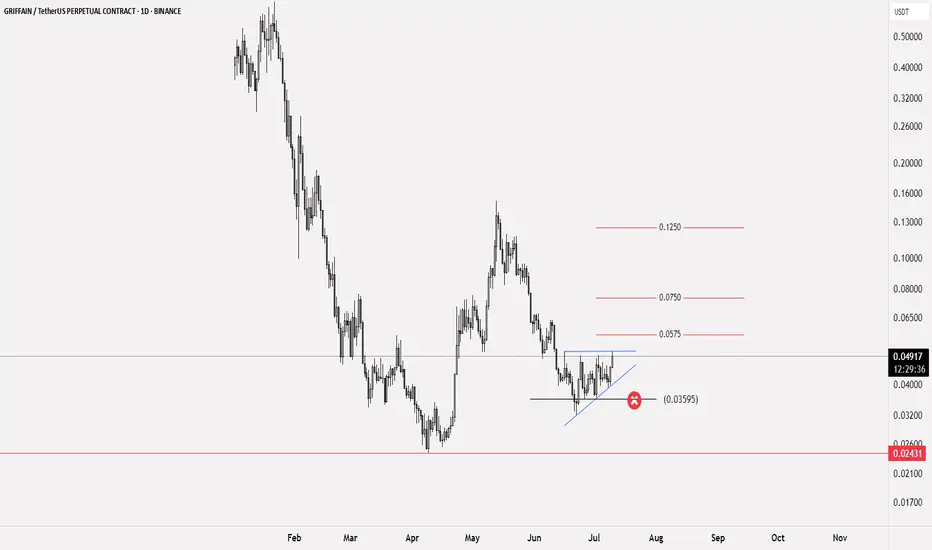
GRIFFAIN trading plan🟢 Available trading deal
📝 Currency $GRIFFAIN
✅ Entry points for the currency: at the current price of 0.04955 and the reinforcement will be at 0.04335
🔴 Stop loss is below 0.03595
💹 Potential targets: First target 0.0575 and if the currency enters a bullish wave, the target will be towards 0.0750 reaching up to 0.1250
📊 The profit-to-loss ratio is 5:1
📝 This idea is based on Elliott Waves analysis, especially after the rebound from 0.02431, the currency's low, and gaining support at 0.03595, which is a signal that Wave 2 has been formed, especially if the price action remains above the mentioned level
❤️ Good luck to everyone - do not enter any currency before studying the risk ratio you will undertake
GRIFFAIN BEARISH SETUPGRIFFAIN/USDT (1H Chart) – Distribution Phase Signals Short-Term Bearish Reversal
The 1-hour chart of GRIFFAIN/USDT on Binance displays a distribution pattern at the recent high, suggesting bullish exhaustion and an imminent correction. Price has now broken below the consolidation range, confirming a shift in intraday sentiment.
🔍 Key Technical Insights:
Distribution Zone Formed: Price stalled at the top with several failed attempts to push higher, forming a range – a classic sign of distribution before reversal.
Bearish Breakdown: The bearish candle has breached support, initiating a potential downward move toward the 0.5 Fibonacci retracement level.
Key Level to Watch:
Next Target: $0.0400 (50% Fib level + historical demand zone)
Further Support: $0.0360 (Fib 0.786 region)
📉 Outlook & Expectations:
Short-term bias remains bearish below the $0.0458 zone. As long as price stays below the distribution range, expect continuation toward the $0.0400 support area, aligning with key structural and Fibonacci levels.
This setup is ideal for intraday or short-term swing traders watching for pullback entries or breakdown continuation.

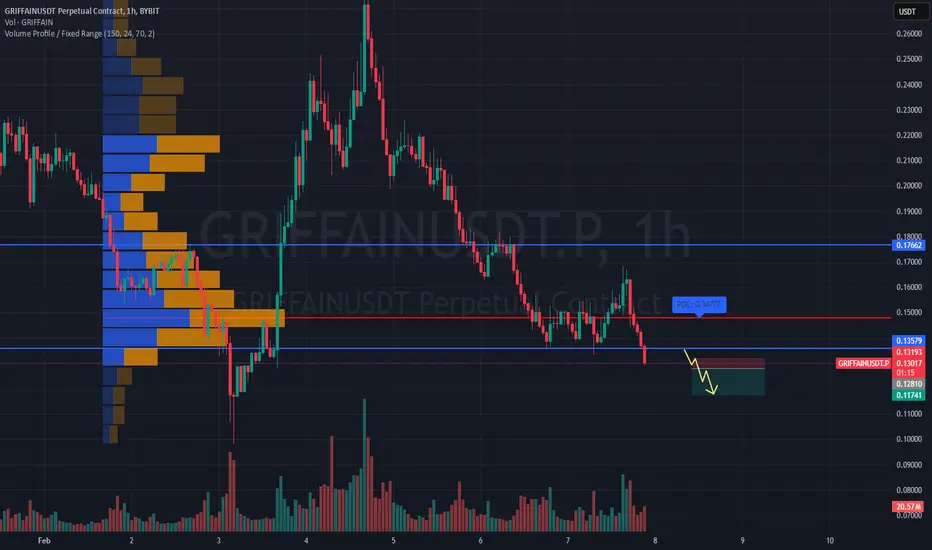
SHORT #GRIFFAINUSDT expecting further downside📉 SHORT BYBIT:GRIFFAINUSDT.P from $0.12810
🛡 Stop loss $0.13193
⏱ Timeframe: 1H
✅ Overview:
➡️ BYBIT:GRIFFAINUSDT.P is showing weakness after reaching a local high, rejecting from a resistance zone.
➡️ POC (Point of Control) at 0.13193 acts as a key volume area with significant trading activity.
➡️ Price action suggests seller dominance, indicating a potential continuation of the downtrend.
➡️ If the 0.12810 support level breaks, expect an increase in bearish momentum.
⚡ Plan:
➡️ Short entry upon confirmation of a breakdown below 0.12810.
➡️ Increased selling volume will confirm the continuation of the bearish trend.
➡️ Holding the position with dynamic monitoring until the first Take Profit level.
🎯 TP Targets:
💎 TP 1: 0.11741 – first target based on the nearest support level.
📢 BYBIT:GRIFFAINUSDT.P is showing bearish signs, but volume and pullback dynamics should be monitored.
📢 A break below 0.12810 could trigger a deeper decline.
📢 If buyers show strength, watch 0.13193 as a possible reversal point.
🚀 BYBIT:GRIFFAINUSDT.P maintains bearish momentum — expecting further downside!
GRIFFAINUSDT Reversal Incoming! 100%+ Potential!🚀 GRIFFAINUSDT – A Prime Reversal Zone with Massive Growth Potential! 🚀
The market structure of GRIFFAINUSDT is showing clear signs of a potential bullish reversal, making this an exciting opportunity for investors looking to capitalize on a breakout rally.
📉 Current Market Sentiment:
The price has retraced into a strong demand zone, aligning perfectly with the Strong Low support level.
Historical price action suggests this level has previously acted as a reversal point, making it an ideal area for accumulation.
The discount zone further indicates a value-buying opportunity, as smart money often enters at such discounted levels.
📈 Bullish Signals:
Break of Structure (BOS) indicates the possibility of a trend shift.
The price is currently hovering near the Nadaraya-Watson Envelope’s lower band, a key dynamic support that has historically triggered upward momentum.
A move above equilibrium levels could ignite rapid upside movement.
🎯 Price Targets:
Short-Term: A swift 100% gain from current levels as buying pressure builds.
Long-Term: Given the supply-demand dynamics and previous price action, a surge toward $2–$5 is within reach as the market recovers.
💎 Investor Takeaway:
The current technical setup is incredibly favorable for a bullish reversal, and smart money is likely eyeing this zone for accumulation. With strong fundamentals and technical backing, this could be a golden opportunity to enter before the next explosive move!
🚀 Don't miss out on this potential moonshot! 🚀
