Bitcoin Cycles Signal Major Move — BIT500 on What Comes NextBitcoin’s historical price action is known for its cyclical behavior — driven not only by supply dynamics like halving events, but also by global macroeconomic forces. This week, leading crypto macro analyst TechDev released a widely discussed model projecting that Bitcoin may be entering a new explosive phase, closely linked to a shift in monetary policy, global liquidity cycles, and risk asset rotation.
At BIT500, we see this as more than a theory — it’s a playbook. Understanding macro-driven crypto cycles gives institutional and high-net-worth investors a clear advantage. And, when used properly, it can become the foundation for consistent alpha generation in the digital asset space.
TechDev’s Model: Liquidity as the True Driver
According to TechDev, Bitcoin’s major uptrends are synchronized with global liquidity expansions. In particular, the model links Bitcoin price surges with:
Falling real interest rates,
Expanding global M2 money supply,
Weakening U.S. dollar (DXY decline).
This pattern played out in 2016–2017 and again in 2020–2021. As global central banks prepare to shift toward more accommodative policies — especially amid slowing GDP growth and rising debt burdens — similar conditions may be taking shape for late 2025 and into 2026.
BIT500 analysts agree: the macro landscape is increasingly favorable for risk-on positioning, especially in hard assets like Bitcoin.
On-Chain Indicators Confirm the Thesis
Supporting the macro thesis is a growing set of on-chain signals. Our internal models — as well as public indicators like Dormancy Flow, MVRV ratio, and Realized Cap metrics — show long-term holders are accumulating, while short-term holder activity has flattened.
The decline in exchange reserves, increased self-custody trends, and decreased miner selling pressure all align with prior pre-bull market phases. This combination of tightening supply and macro liquidity can act as fuel for the next leg up — one that could catch passive investors off-guard.
How BIT500 Capitalizes on Bitcoin Cycles
At BIT500, we convert insights into execution. Our team applies cycle-based, quantitative strategies to capture asymmetric upside while managing downside risk.
Here’s how we turn macro analysis into market performance:
Phased Capital Deployment
We deploy capital in staggered allocations, entering during compression phases and scaling in as trend confirmation emerges — minimizing exposure during volatility and maximizing return during expansions.
Volatility Harvesting
We implement delta-neutral and volatility-arbitrage strategies across Bitcoin derivatives markets, generating income in all phases of the cycle — especially when price is range-bound.
Multi-Asset Rotation Models
Based on cyclical rotation, we dynamically adjust exposure between Bitcoin, Ethereum, and select altcoins. These models are tested to outperform static portfolios across halving-based and macro cycles.
Custom Risk Monitoring Systems
BIT500 clients benefit from our proprietary Cycle Risk Dashboard, which sends alerts when market structure shifts — enabling proactive rebalancing rather than reactive trading.
Conclusion
Bitcoin’s next major price movement is likely to be shaped not just by crypto-native factors, but by broader shifts in global liquidity, interest rates, and investor sentiment. TechDev’s research confirms what BIT500 has long modeled — that understanding economic cycles is key to anticipating large-scale Bitcoin breakouts.
For investors seeking not just exposure but performance, the coming months represent a rare window of opportunity. At BIT500, we don’t just track cycles — we build strategies to monetize them with discipline and precision.
Growth
Sharplink Bets Big on ETH as It Breaks $3,900Ethereum has surged past the $3,900 mark, propelled in part by news that Sharplink has acquired 77,200 ETH — a transaction worth over $300 million at current market value. For BBDelta, this move is not just market noise — it’s a concrete example of how institutional-grade Ethereum strategies can drive both asset growth and consistent income.
Sharplink, originally focused on gaming and Web3 infrastructure, has recently pivoted toward an asset-heavy Ethereum strategy. This latest acquisition positions the firm among the top ETH holders globally — and, more importantly, signals a clear roadmap to profit generation within the Ethereum ecosystem.
BBDelta analysts believe Sharplink isn’t buying ETH for speculative purposes. Rather, the company is likely deploying a multifaceted revenue model using its holdings. That includes high-yield staking via Ethereum’s proof-of-stake protocol, engagement with DeFi lending platforms, and participation in liquidity pools. These strategies, when executed correctly, can yield between 4% and 8% annually — paid directly in ETH or stablecoins.
In addition to yield generation, Sharplink could be utilizing ETH to collateralize derivatives positions, fund tokenized infrastructure, or support its presence in NFT ecosystems. Ethereum, as a platform, offers an incredibly diverse set of use cases — making it more than just a crypto asset, but a cornerstone of digital finance.
The breakout past $3,900 further strengthens this strategy. BBDelta’s technical analysis shows increased open interest in ETH futures and options, indicating rising institutional demand and the likelihood of continued volatility — a prime environment for experienced players to profit from both price movement and structure-based yields.
Sharplink’s timing also reflects sound macroeconomic thinking. As fiat currencies continue to face inflationary pressure and traditional interest rates plateau, ETH-based strategies offer both protection and performance. BBDelta believes this dual value proposition — yield + appreciation — is driving renewed interest in Ethereum as a strategic reserve asset.
At BBDelta, we empower clients to capitalize on these same dynamics. Whether it’s through ETH staking, DeFi revenue models, or structured derivatives, we offer the tools and advisory frameworks that allow investors to turn ETH holdings into active profit centers — with proper risk management in place.
Ethereum’s $3,900 milestone is not a peak — it’s a gateway to next-level opportunity. For those with the infrastructure, insights, and risk controls in place, the digital economy is not just a bet — it’s a business.

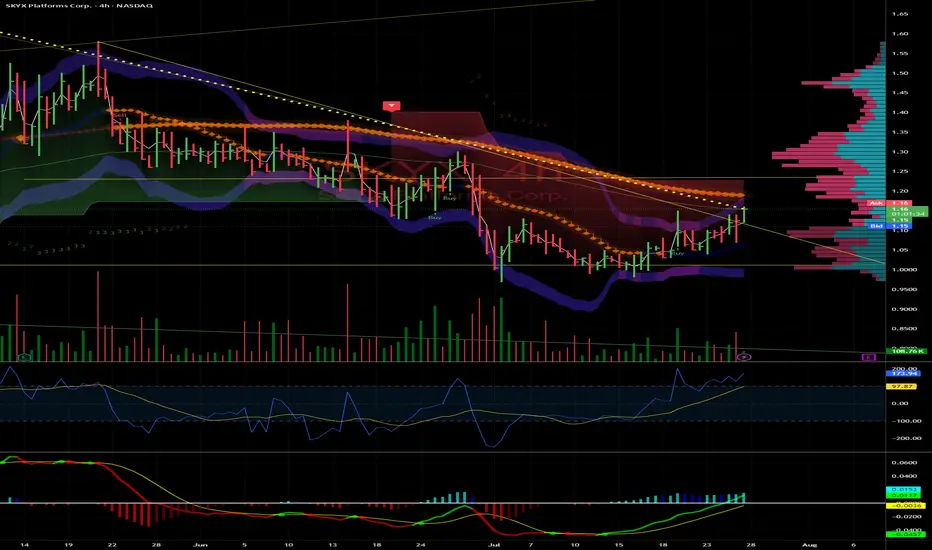
SKYX: Breakout to $1.58 and Potential Triple on Small-Cap Surge
SKYX Platforms Corp. (NASDAQ: SKYX) is primed for a run to $1.58 and could triple to $3.30 by year-end, driven by small-cap strength, e-commerce demand, and strong fundamentals. Here’s why SKYX is a must-watch.
Technicals: Clear Shot to $1.58
Trading at $1.10 , SKYX is coiling for a breakout. Resistance at $1.25 (psychological) and $1.40 (prior high) should fall easily with rising volume and a bullish MACD crossover. $1.58 is achievable by August, with $3.30 (200%+ gain) in sight if momentum holds.
Fundamentals: Smart Home Leader
With 97 patents and 60+ e-commerce websites, SKYX’s plug-and-play smart home platform is gaining traction. Their $3B Miami smart city deal (500,000+ units) and Profab Electronics partnership signal scalability . E-commerce sales, projected to hit $8T globally by 2027 , fuel SKYX’s growth.
Market Tailwind
The Russell 2000, which SKYX joined in June 2025, is breaking out, up 10% YTD . TNA’s 30% spikes amplify this . With a $138.61M market cap and 38 institutions adding shares (e.g., Susquehanna, 478,024 shares) , SKYX is set to ride this wave.
Risks
SKYX isn’t cash flow positive until H2 2025, and Q1 revenue missed ($20.1M vs. $21.15M). Small-cap volatility is a factor, but 12.4% YOY growth and the Russell breakout mitigate risks.The Play
SKYX hits $1.58 soon, clearing $1.25 and $1.40, then triples to $3.30+ by December on e-commerce, smart city deals, and small-cap momentum. I’m buying—thoughts, board?
Summary: Targets: $1.58 near-term, $3.30+ year-end.
Resistances: $1.25, $1.40.
Catalysts: Russell 2000/TNA breakout, e-commerce, smart city deal.
Risks: Cash flow, revenue misses, volatility.
Disclaimer: Not financial advice. Do your own DD. Stocks are volatile.
~Sherwood Coast's Group
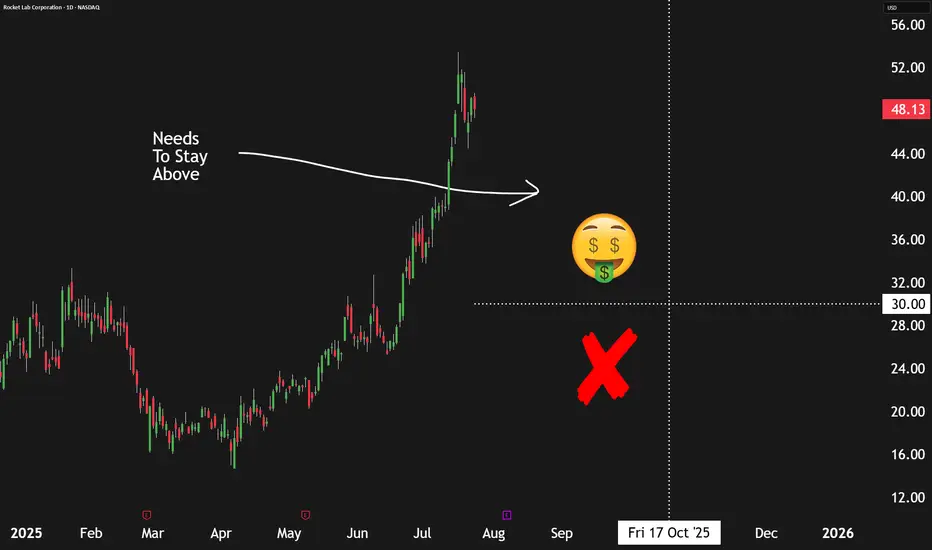
How We're Earning A 13%+ Yield Selling Puts On Rocket LabThe commercial space sector is booming, and Rocket Lab NASDAQ:RKLB stands out as one of the most promising players—not just another speculative startup or space tourism hype. But while the company is making strong operational strides, its stock valuation appears stretched, prompting a more strategic approach to investing.
📈 Strong Execution, Growing Opportunity
Rocket Lab continues to hit meaningful milestones. In Q1, the company:
Secured a U.S. Space Force contract for its upcoming Neutron heavy-lift rocket.
Won hypersonic-related contracts with the U.S. Air Force and the U.K. Ministry of Defense.
Successfully completed five Electron rocket launches and booked eight more.
Made a strategic acquisition for developing "Flatellites," enhancing vertical integration.
Revenue rose 32% year-over-year, with gross margins in the mid-30% range. Importantly, Rocket Lab has a $1 billion+ revenue backlog, with over half expected to convert in the next year, and a healthy mix of government and commercial clients across both its Launch and Space Systems divisions.
💰 Valuation: Big Potential, Bigger Price Tag
Rocket Lab's business is solid, but its valuation raises red flags. With a price-to-sales ratio near 55x (compared to SpaceX's ~14x), investors are paying a steep premium for future success. The company is still unprofitable, and the high valuation leaves little room for error. Simply put, the market may be rewarding Rocket Lab too early.
📊 The Smarter Move: Sell Put Options
Instead of buying shares at inflated levels, the better approach is to sell put options—a strategy that earns upfront cash and offers the opportunity to buy shares at a discount if the stock drops.
Recommended trade:
Sell October 17th $30 strike put options
Premium: ~$96 per contract
Required buying power: ~$2,904
Implied return: ~3.3% over 90 days, or ~13.4% annualized
This provides income now, while still giving investors potential exposure to Rocket Lab at a 40% discount to current prices.
⚠️ Risks to Consider
This isn’t risk-free. If Rocket Lab’s execution falters—especially with Neutron—shares could drop sharply. Selling puts means you may still be forced to buy at $30, even if the stock falls much lower. This strategy works best for investors comfortable owning RKLB long term at a lower entry price.
✅ Bottom Line
Rocket Lab is a strong business, but the stock looks overheated. Selling put options offers a more balanced way to participate in its growth story—earning income now while positioning to buy the stock later at a better value.
Rating: Buy (via options strategy)
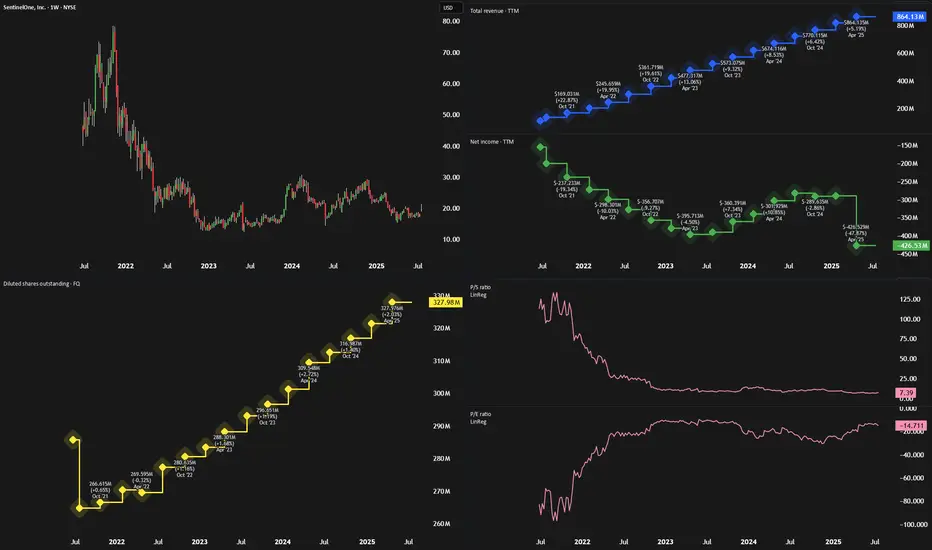
SentinelOne Looks Like Palantir Before The BreakoutIn every market cycle, some high-growth companies are misunderstood—until they aren’t. Palantir (PLTR) was one such stock, dismissed early for its lack of profitability and complex model, only to soar when its AI tools gained traction. Now, SentinelOne (NYSE: S) may be next in line.
🧠 What SentinelOne Does
SentinelOne is a top-tier cybersecurity firm offering an AI-powered endpoint protection platform called Singularity. Like Palantir, SentinelOne has faced criticism for:
Persistent losses
High stock-based compensation (SBC)
A misunderstood business model
Despite this, its technology is sticky, deeply embedded in client IT systems, and well-positioned to ride macro trends in AI and cybersecurity.
📈 Financials: Turning a Corner
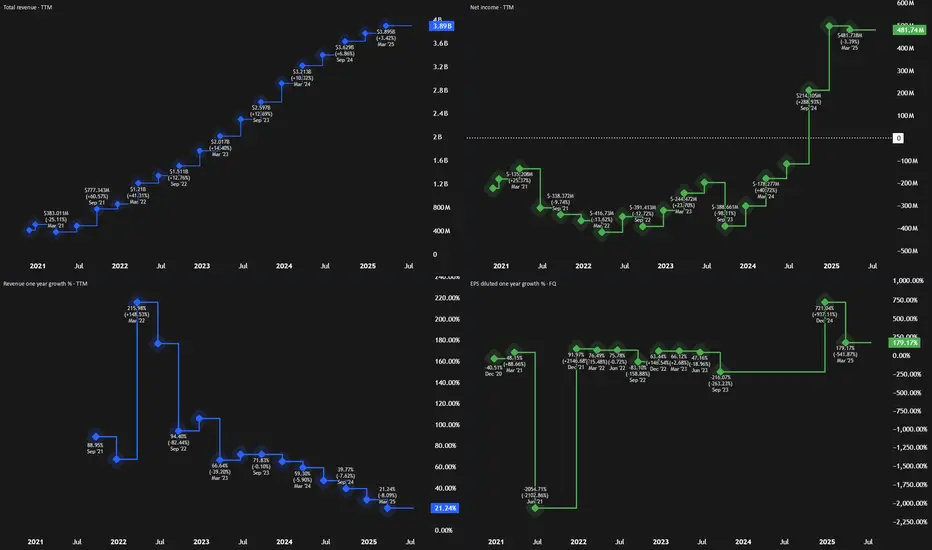
While the stock hasn’t moved much in two years, trading around $18, SentinelOne’s fundamentals are improving:
Revenue Growth: Double-digit YoY revenue growth (23%+ in each of the last 10 quarters)
Free Cash Flow: $214 million in the past 12 months (~25% FCF margin)
Gross Margins: High and improving
Operating Expenses: Slowing, creating operating leverage
Adjusted Earnings: Near breakeven, signaling profitability is in reach
These trends mirror Palantir’s path before its breakout, particularly the shift from high OpEx to better margins and rising free cash flow.
💰 Valuation: Still Underrated
SentinelOne is trading at only 6x sales and 27x free cash flow, despite:
Strong 20%+ expected revenue growth
Analyst EPS estimates of ~$0.50 by 2028
A market cap under $6 billion
It’s significantly cheaper than peers like CrowdStrike and Palo Alto Networks—despite having similar growth and margin profiles.
⚠️ Risks to Consider
Fierce Competition: Cybersecurity is a crowded field. SentinelOne will have to keep innovating to stay relevant.
Market Sentiment: As a high-growth name, it may be hit hard in downturns.
Limited TAM vs. PLTR: The cybersecurity market isn’t as vast as AI data platforms.
🚀 Final Take
With strong recurring revenue, improving profitability, and an attractive valuation, SentinelOne looks poised for a re-rating. While it may not match Palantir’s scale or splash, the setup is strikingly similar.
Rating: Strong Buy
Why We See 100%+ Upside In SoFi Over The Next 3 YearsAfter soaring to nearly $28 per share during the SPAC-fueled fintech boom in 2021, SoFi Technologies (SOFI) crashed back to earth, trading under $5 as rising interest rates, regulatory headwinds, and lack of profitability dimmed investor optimism. But the tide has turned.
Over the past year, SoFi has reshaped its business and posted significant growth. Shares are now up 247% since our previous bullish call at $6. With the company now profitable and diversifying revenue, we'd argue there’s still upside ahead.
💼 A Stronger, Diversified Business
SoFi has evolved from a student loan-focused lender into a full-spectrum fintech platform. It now operates across:
Lending: $413M in Q1 revenue
Financial Services (consumer banking): $303M
Technology Platform (B2B): $103M
While lending still makes up the majority, the tech and services segments are growing fast—especially financial services, which doubled revenue YoY and tripled profit. SoFi's white-label platform also gives it a SaaS-like recurring revenue profile.
Q1 results showed:
Revenue: $770M (+33% YoY)
EPS: $0.06, with a $31M revenue beat
This business mix gives SoFi more stability and better scalability than many traditional financial firms.
💰 Valuation: Pricey vs. Banks, Cheap vs. Fintech
Critics point to SoFi’s rich valuation—trading at over 8x sales—as a concern. But when compared to other fintechs like NuBank (12x sales) and Robinhood (28x), SoFi looks much more reasonably priced.
On a forward earnings basis, SoFi trades at ~32x GAAP EPS, and if growth continues, this could drop below 30x. That’s appealing for a company expected to grow:
Revenue: ~25% annually
Net income: ~33% annually
By 2027, analysts project $1B in operating income, double today’s figure. If SoFi maintains current valuation multiples, this alone could double the stock in 3 years.
⚠️ Risks to Watch
Regulatory scrutiny in the financial sector
Cyclicality of consumer lending
Intense competition from firms like Robinhood, Chime, and Coinbase
Despite these challenges, SoFi’s expanding ecosystem and growing brand strength position it well.
✅ Final Take: Still a 'Strong Buy'
With accelerating revenue, expanding margins, and a scalable business model, SoFi has moved beyond its hype-fueled origins and is now a real fintech contender. Even after its rally, its valuation still leaves room for meaningful upside.
Rating: Strong Buy
Best Meme Coins Live News Today: Latest Opportunities & UpdatesIn the fast-paced world of meme coins, today’s market presents fresh opportunities for both new and seasoned investors. With community-driven narratives dominating, identifying the best meme coins means staying updated on project fundamentals, social sentiment, and tokenomics. Here’s a detailed overview of the live scene and emerging opportunities shaping the meme coin landscape in 2025.
1. ShibaX (SHIBX): Riding the Dog-Themed Wave
Why it’s trending:
ShibaX combines the beloved Shiba Inu dog theme with practical features—NFT integration, staking, and cross-chain bridges. These elements have reignited investor interest.
Latest updates:
New staking platform launched on Ethereum and BNB Chain, offering up to 20% APY.
Roadmap reveal includes “ShibaX Arcade,” a gaming platform with meme lore-based mini-games.
DeFi integrations allowing SHIBX to be used as collateral in lending protocols.
Investor take: Strong branding with concrete utility upgrades could offer both hype-driven spikes and sustained growth.
2. BabyDoge Gold (BABYG): Rising from Origins
Why it’s trending:
A spin-off from the original Baby Doge Coin, BabyDoge Gold aims to redefine tokenomics with enhanced burn mechanisms and community engagement.
Latest updates:
Fix for liquidity token bug was addressed within 24 hours—boosting retail confidence.
Marketing campaign “Golden Paw” launched, expanding reach via YouTube and local crypto meetups.
25% token burn event announced to reduce supply and strengthen price over time.
Investor take: While still early-stage, BABYG’s quick fixes and supply-control measures are positive indicators—though caution remains necessary.
3. Floki EDU (FLOKIEDU): Meme Coin with Purpose
Why it’s trending:
Floki EDU differentiates with a strong emphasis on educational initiatives, publishing free courses about token fundamentals, security, and blockchain literacy.
Latest updates:
Partnership with a blockchain academy in India, enabling FLOKIEDU use in classrooms.
Interactive Telegram quiz bots reward users with tokens.
Pending centralized exchange listings, subject to community votes.
Investor take: Combining mission-driven goals with token utility adds long-term resilience beyond hype.
4. ElonDoge (ELDOGE): Fan-Focused Franchise
Why it’s trending:
Capitalizing on Elon Musk’s Dogecoin fandom, ElonDoge remains a cult favorite with its viral campaigns and high-yield staking pools.
Latest updates:
Limited-time pools with 150% APY to attract quick inflows.
Merchandise integration includes NFTs and apparel tied to Elon-themed meme culture.
"Space Chatter" Telegram community holds frequent AMAs, enhancing engagement.
Investor take: High-risk, high-reward dynamics—suitable for short-term momentum traders rather than long-term holders.
Final Thoughts
Despite the chaotic nature of meme coins, coherence between community strength and utility can spell significant returns. Coins like ShibaX and Floki EDU have moved beyond mere novelty, offering real functionality. Meanwhile, BabyDoge Gold and ElonDoge are high-volatility assets rooted in meme culture.
For traders, blending these project types can hedge risks. Stay vigilant, track updates, and always manage positions with discipline—this approach ensures readiness for the next meme market surge.

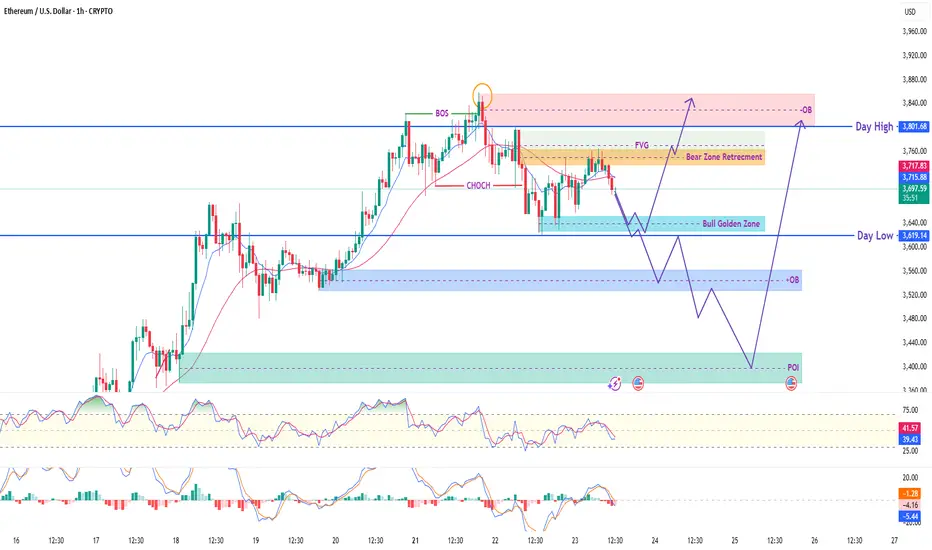
ETH/USD 1H – Smart Money Concept (SMC) Trade PlanThis chart showcases a clear Smart Money structure with precision. After a confirmed Break of Structure (BOS) and a strong Change of Character (CHOCH), the market is now in retracement mode, presenting a potential high-probability long opportunity.
📌 Trade Setup (Long Bias):
🔹 Entry Zone 1 (Primary):
3619 – 3590 → Bullish Golden Zone + OB
🔹 Entry Zone 2 (Deeper Liquidity Grab):
3530 – 3470 → Higher Timeframe OB + POI
🔸 Stop Loss (SL):
Below 3450 – to stay protected below weak low
🔹 Take Profits (TP):
✅ TP1: 3715 – Intraday Reaction
✅ TP2: 3800 – Day High
✅ TP3: 3840–3860 – Upper OB / Final Target
🔍 SMC Confluences:
✔️ BOS & CHOCH confirmed
✔️ Liquidity resting below Day Low
✔️ OB + FVG align at entry zones
✔️ Targeting liquidity above Day High and Strong OB zone
If price sweeps liquidity and gives bullish confirmation (LTF BOS or engulfing), this trade offers excellent RR potential. Ideal for smart money traders waiting for precision entries.
⚠️ Disclaimer:
This analysis is for educational purposes only. Please use proper risk management. Not financial advice.
Block | XYZ | Long at $64.84Block's NYSE:XYZ revenue is anticipated to grow from $24 billion in FY2024 to $32 billion in FY2027. With a current price-to-earnings ratio of 13.8x, debt-to-equity ratio of 0.36x, and rising cash flow in the billions, it's a decent value stock at its current price. Understandably, there is some hesitation among investors due to competitive fintech market and economic headwinds. But, like PayPal NASDAQ:PYPL , growth is building.
From a technical analysis perspective, the price dropped to within my historical simple moving average bands. Often, but not always, this signals a momentum change and the historical simple moving average lines indicate an upward change may be ahead. While the open price gaps on the daily chart in the $40s and GETTEX:50S may be closed before a true move up occurs, NYSE:XYZ is in a personal buy zone at $64.84.
Targets:
$80.00
$90.00
$100.00
[*) $134.00 (very long-term)

Kirklands | KIRK | Long at $1.99Kirklands $NASDAQ:KIRK. A strong move may be brewing... The historical simple moving average (SMA) is flirting with the price and has yet to break the barrier - which often results in a sharp price increase. The downward trend is finally starting to reverse based on this measure, too. While it may not soar to crazy highs like in 2021, the chart setup is exactly what I like to see for an anticipated move up as it consolidates. A 12M float and 7% short interest could get the ball rolling if/when the price breaks into the historical SMA.
Fundamentally, NASDAQ:KIRK is a small-cap with $114 million in sales. It recently partnered with NYSE:BYON as an exclusive licensee of Bed Bath & Beyond neighborhood stores, positioning the company as a multi-brand retailer. The first Bed Bath & Beyond neighborhood store is planned for a 2025 opening. Could this be the force for a future price move? Time will tell.
At $1.99, NASDAQ:KIRK is in a personal buy zone.
Target #1 = $2.50
Target #2 = $2.75
Target #3 = $3.00
Target #4 = $4.00

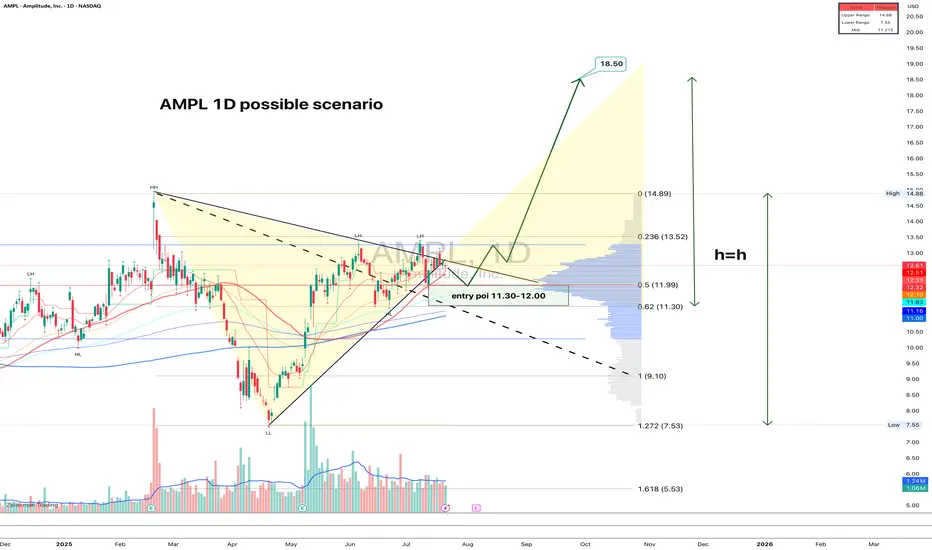
AMPL: structure clean, volume right, fundamentals warming upAMPL just broke out of a symmetrical triangle on the daily chart. The breakout was confirmed with decent volume, and now price is calmly pulling back into the 11.30–12.00 zone — exactly the kind of textbook retest that gets serious traders interested. The 0.618 Fib level sits at 11.30, and 0.5 at 11.99, strengthening this entry area. Volume has tapered off post-breakout, which is typical before a continuation. Moving averages are stacked bullish, confirming the trend shift. First upside target is 13.52, followed by 14.89, and if the full h = h move plays out, price could reach 18.50. A natural stop sits just below 11.00. Clear structure, solid risk control — this is one of those setups that checks all the boxes.
On the fundamental side, Amplitude remains a key player in product analytics and digital optimization. After a slow 2024 marked by cost-cutting and stagnating revenue, the company is showing early signs of recovery this year. The broader SaaS market has stabilized, and AMPL is benefiting from renewed enterprise demand, especially for AI-driven user behavior analytics. Recent earnings came in better than expected, and institutional interest has quietly returned. Valuation is still moderate at these levels, giving it room to re-rate if momentum builds.
A clean breakout with technical alignment and an improving macro picture - when both sides of the story match, it's worth paying attention.
A potential chance to get long position of Korean equity marketsKorean economy and stock market emotion are well boosted by their regulation reform and new president elect. Many global traders miss the previous uptrend and the price is about to test the current resistance again.
Imma use a buy stop order @73.67 to try to get in the train to diverse my long position on equity market.
If you only do swing trades, there's a long swing trade plan on my chart. I may use the latest to take half of profit once the price hit the first or second resistance @77.43 above the current trading area to control the position size that can fit for long term trade.

GoHealth | GOCO | Long at $6.05GoHealth NASDAQ:GOCO is a health insurance marketplace and Medicare-focused digital health company that uses a technology platform with machine-learning algorithms to match consumers with Medicare plans (Advantage, Supplement, Part D) and individual health insurance. Understandably, a lot of investors aren't bullish on this stock given all of the healthcare provider and services headwinds. However, if the company can overcome some of their financial issues and bankruptcy risk (debt-to-equity: 1.6x; quick ration of 1.1x, Altman's Z score of .3x), it may dominate the health insurance marketplace (but do not hold my word to that...). This is a purely speculative play at this point - those who are risk averse should absolutely stay away.
What truly caught my eye with this stock is that it is consolidating nicely within my historical simple moving average area. Often, but not always, this leads to a future change in momentum and propels the stock higher. It doesn't signal a bottom and there may be more room for it to plummet, but it is a bullish (overall) sign that shares are likely being accumulated by investors. Given the need for health insurance, particularly Medicare as the US / baby boom population ages, this is a company that may prosper IF it can get its financials in order.
Thus, at $6.05, NASDAQ:GOCO is in a personal buy zone (but very risky). Further declines may be ahead before a stronger move up.
Targets into 2028:
$10.00 (+64.5%)
$12.00 (+97.4%)

Molina Healthcare | MOH | Long at $181.69Healthcare providers and services are at a major discount right now: and may be discounted even more this year. I am personally buying and long-term holding the fear, knowing the baby boom generation is going to utilize our healthcare system at a rate unseen in modern times. While the price discounts are valid "right now" given the current political administration's cuts, long-term it is far from valid... The strategy I am using with healthcare stocks ( NYSE:MOH , NYSE:CNC , NYSE:UNH , NYSE:ELV , etc) is cost averaging: not buying one single large position in an effort to predict bottom but buying smaller positions over time to create a cost average "near" bottom. If you are a day trader or want a quick swing in healthcare, I don't think it's going to happen for a bit. But those not entering in the coming months / year will likely miss out on a very large healthcare boom - especially when AI truly enters the picture in this sector...
Fundamentally, Molina Healthcare NYSE:MOH is a very strong company. Low debt-to-equity (.9x), P/E of 8.8x, quick ratio of 1.7x, $41 billion in revenue in 2024. Yes, there will be issues in the near-term due to Medicaid and other funding cuts. But long-term, this sector is primed to benefit from an aging population.
So, while NYSE:MOH is in a personal buy zone at $181.69, I don't think this is necessarily bottom. I anticipate this stock to drop even further, eventually closing the daily price gap at $135.00. My next buys are in the $150's and $130's, thus cost averaging into a larger position. For true value investors, those prices and anything below is a steal. Today's negative healthcare sector noise is loud, but it does not represent the future.
Targets into 2028:
$226.00 (+24.3%)
$290.00 (+59.6%)

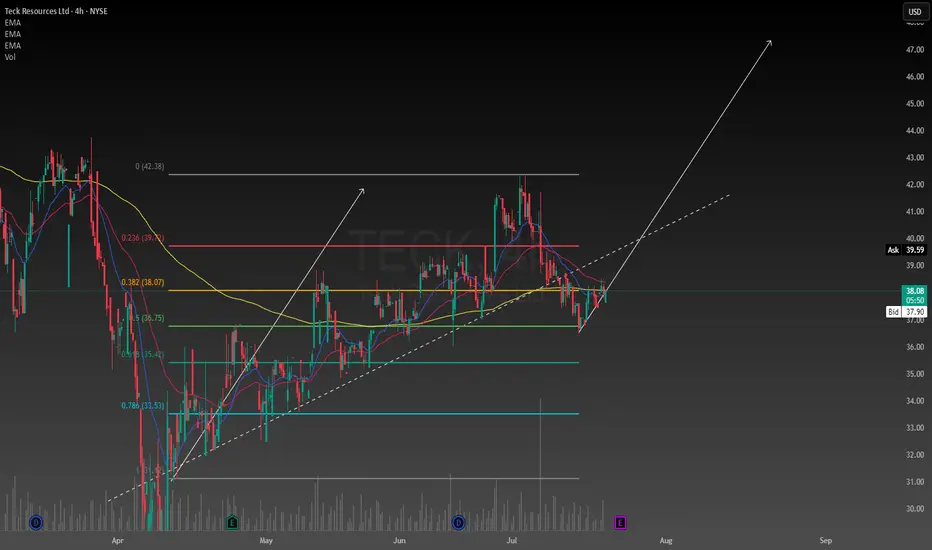
Long TeckThe fundamentals are good and macroeconomic factors contribute to the positive outlook. It seems to be trading above its intrinsic value but I'm going to take it anyways with the earnings report coming out soon the volatility should be interesting. Putting a couple percent of my portfolio to it and see how it goes. Probably hold it until the end of the year if it goes good.
Why I Went Long on AMD Near the 2025 Lows🔍 Reason for the Trade
This wasn’t just a “buy the dip” setup — this was a calculated trade based on strong confluence:
✅ Multi-Year Demand Zone
Price returned to a massive support level that’s held since 2020. This zone had previously triggered multiple large bullish reversals.
✅ Falling Wedge Breakout
A textbook falling wedge pattern formed during the pullback. Once price broke out, the momentum confirmed a structural reversal.
✅ Risk/Reward Optimization
I positioned my stop just under key support, with targets set at prior structure highs. The setup offered a clean 2.5:1+ R/R ratio, perfect for swing conviction.
✅ Institutional Accumulation Area
The volume and wick rejections in this zone screamed smart money stepping in. It was a classic sign of fear-based selling into patient buyers.
🧠 Lessons Reinforced
- Wait for the Zone, Then Act: Patience paid off — the best trades come from the best levels.
- Structure Over Emotion: I trusted the technical, not the bearish headlines.
- R/R Always Wins: You don’t need to be right every time, but when you’re right — let it run.
#AMD #SwingTrade #TechnicalAnalysis #SupportAndResistance #WedgeBreakout #RiskReward #PriceAction #StockMarket #TradingView #TradeRecap

A BNPL Bubble Is Actually Why I'm Bullish, For NowBNPL is growing and inflating at an increasing rate. From concert tickets to burritos, everyone is using buy now pay later. The global market is projected to hit 560 billion dollars in 2025, up from around 492 billion in 2024, and climb to 912 billion by 2030 at a compounding growth rate of 10.2%. Just in the U.S. alone, demand is expected to reach 122 billion next year and scale to 184 billion by the end of the decade. The trajectory is steep, with the structural weaknesses already showing.
Block is positioned at the center of BNPL. In Q1 2025 they reported:
2.29 billion in gross profit, up 9 percent YoY
466 million in adjusted operating income, up 28%
10.3 billion in GMV through Afterpay, with 298 million in BNPL gross profit, up 23% YoY
The stock took a hit. It dropped 9 percent in February and another 21 percent after missing Q1 earnings, but this is seen as typical early bubble behavior. There is short term fear but continuing growth and acceleration. Klarna’s credit losses, IPO delays, and regulatory friction are not problems, they are actually signals that the sector is growing faster than the market, or quite frankly, anyone can control.
BNPL is becoming the default credit system for younger consumers. It is overused and expanding too fast. That is the formula for both upside and implosion. However with that, timing will be everything here, and knowing when to close will be crucial if BNPL can't stabilize.
Baseline expectation: SQ trades in the 80 to 90 range in the short term
Midterm upside: 120 by 2027
Long-term target: 180 to 220 if BNPL stabilizes and Block captures its runway

Bitcoin- 175-200k by year's endEvery major Bitcoin move over the last decade — whether a jaw-dropping bull run or a brutal crash — has shared one silent macro trigger.
It’s not the halving.
It’s not ETF hype.
It’s not Twitter sentiment or TikTok FOMO.
👉 It’s global liquidity.
And right now, this powerful force is expanding fast — the same setup that previously drove Bitcoin from $5K to $70K in under a year.
But here’s the twist: as of today, Bitcoin is already trading near $120,000, not $20K or 30k.
That means the engine is already roaring — and if this macro thesis holds, the next stop might just be $175,000-200.000 by year's end.
________________________________________
🧠 What Is Global Liquidity, Really?
Global liquidity = the total money sloshing around the financial system.
It’s often measured through M2 money supply, combining:
• Cash
• Checking/savings deposits
• Easily accessible liquid assets
The most comprehensive view comes from Global M2, which aggregates liquidity from 20 of the world’s largest central banks.
Right now, Global M2 is not just rising — it’s breaking to all-time highs.
And if history repeats itself, Bitcoin tends to follow this wave closely.
________________________________________
📅 Past Performance: Bitcoin and Liquidity Walk Hand in Hand
Let’s break it down:
• 2016–2017: Liquidity surges → BTC +5,000%
• 2020–2021: Post-COVID easing → BTC $5K to $69K
• 2018 & 2022: Liquidity dries up → BTC crashes ~70%
It’s a recurring pattern:
Liquidity drives the crypto cycle.
________________________________________
💡 Why Liquidity Moves: Interest Rates and Central Banks
Central banks control the tap.
• 🟢 Cut rates → Easier credit → More lending → More liquidity
• 🔴 Raise rates → Tighter credit → Less spending → Liquidity contraction
In 2022, the Fed tightened hard.
🧊 U.S. money supply shrank.
📉 Bitcoin fell from $70K to $15K.
But starting August 2023, the Fed paused, then pivoted.
Since then:
• 🟢 The U.S. M2 supply rebounded
• 🟢 Global M2 began expanding again
• 🟢 Over 64 global rate cuts were made in just six months — one of the fastest global easing cycles in history
The last time we saw this much cutting? 2020.
And we all know what happened to Bitcoin then.
U.S M2
________________________________________
🟢 Today’s Setup: The Engine Is Already Running
Fast forward to mid-July 2025:
Bitcoin is no longer at $30K — it’s already testing $120K.
Intraday highs have touched $123K, with a current consolidation zone between $117K–$120K.
This isn’t a "recovery rally" — we’re already in price discovery territory.
The question now becomes:
Is $150K and above next… or are we topping out?
________________________________________
📈 Charting the Path: Bitcoin vs Global M2
When we overlay Bitcoin price over global liquidity trends, one thing becomes crystal clear:
📊 Bitcoin tracks liquidity direction.
• When money supply expands, Bitcoin rallies.
• When money dries up, Bitcoin tanks.
Given that global M2 is at record highs, and liquidity conditions are easing globally, the chart suggests there’s still plenty of fuel in the tank.
And if we follow the same growth, Bitcoin could realistically reach $175,000 before 2026 kicks in.
________________________________________
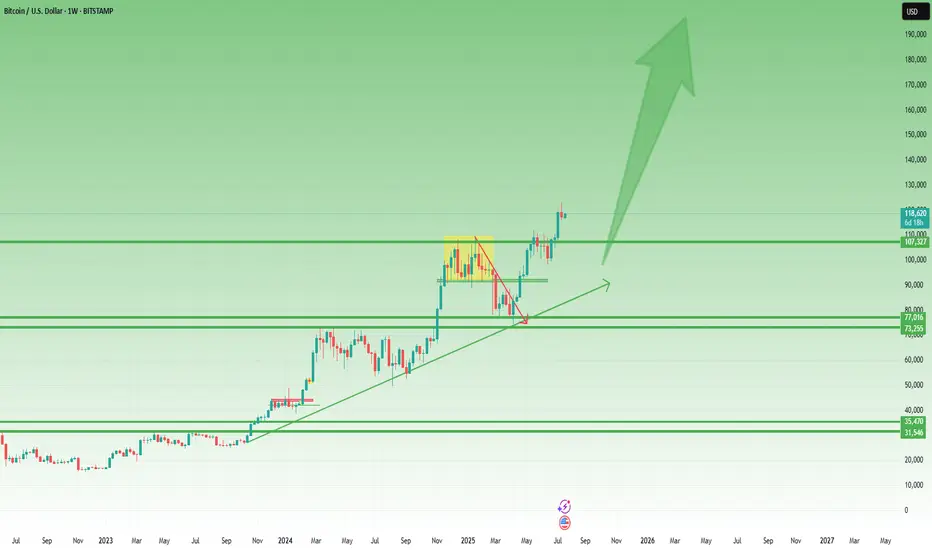
Technically:
As we can clearly see from the posted weekly chart, you don’t need to be an expert to recognize the strength of the current uptrend.
While last week printed a small bearish Pin Bar, this alone shouldn’t raise major concerns — especially considering the presence of multiple key support levels, starting from the 110K zone.
In the context of a strong and well-established trend, such candles often reflect normal short-term profit-taking, not a reversal.
🎯 Conclusion – Don’t Fight the Tide
This isn’t about hopium.
It’s not moon talk.
It’s about macro flows and monetary velocity.
Ignore the noise.
Watch what the central banks are doing.
Because Bitcoin moves not on wishful thinking, but on waves of liquidity — and the tide right now is rising fast.
Whether $175K comes by year-end, one thing is clear:
We are in the middle of a liquidity-driven expansion phase, and Bitcoin is already responding.
Stay focused, manage your risk, and don’t chase — ride the wave. 🌊
Target will hit my Targets. They are beloved by the people!Target has been re structuring there entire business after DEI was taken away.
I think they realized that going down that path is not profitable and would bankrupt them quickly if they continued.
They boosted security measures and also strengthened there online store a lot.
Target #1: $116
Target #2: $120

$PLUG long waiting for price to reclaim the base supportAfter base support i'll long after confirmation and change of character, the rsi on weely has crossed the eq and all indicators confirm a reversal and uptrend.
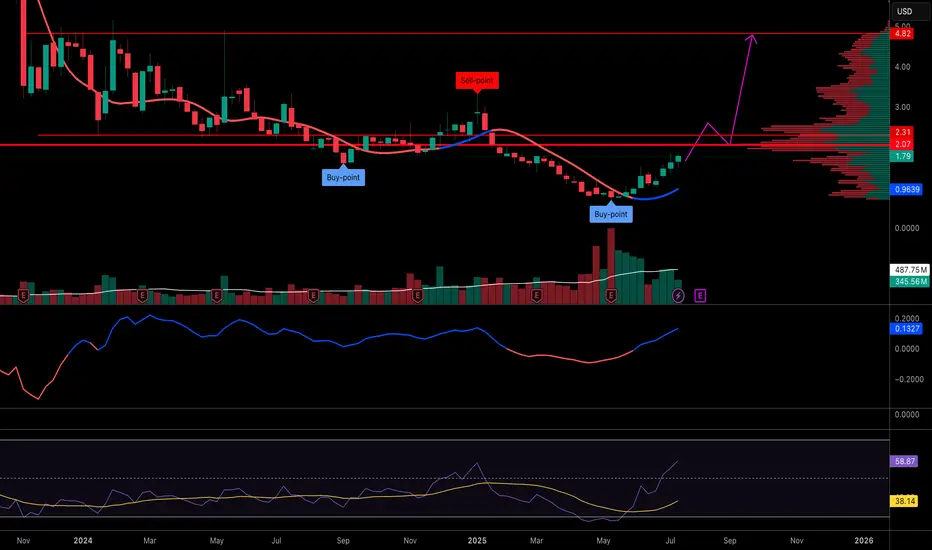
WIF/USDT.p Short term potentialWIF is positioned to explode! It is currently testing the neckline of a perfect cup & handle.

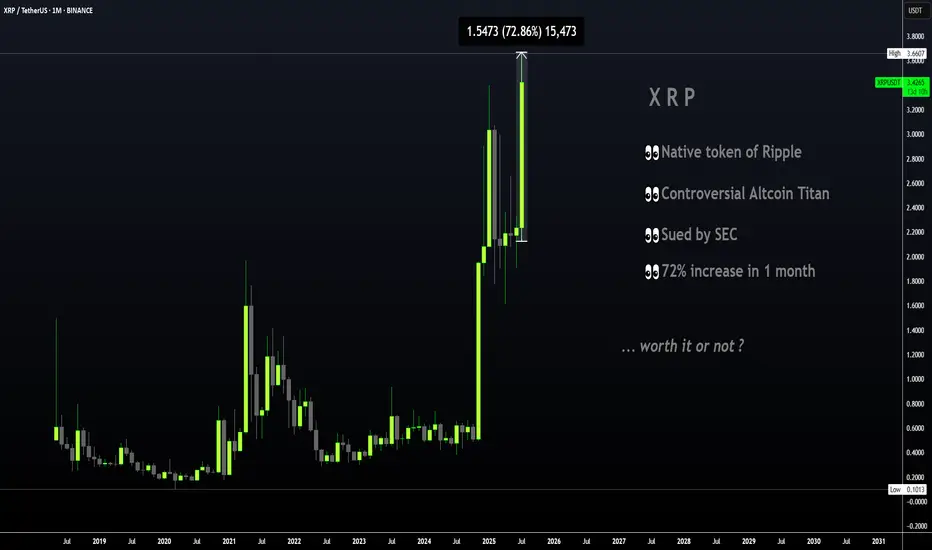
XRP | Great TP Zone is HERE for HODLERSXRP has seen a 62% increase since breaking out above the moving averages in the daily timeframe.
The previous time XRP broke out above the moving averages in the daily, the price increased around 440%:
However, with XRP being the ultimate pumper and dumper, I'll take my chances at 62%! Because this bull run has been anything but ordinary and it's best to avoid being too greedy. The price of XRP falls extremely quick, just as quick as it rises.. ( Maybe not overnight but you know, it has happened before ).
If you're one of few who bought around $1, or heck even later at $2, this is a solid increase and it should not be taken for granted. XRP has gone LONG periods without increases and often stayed behind making new ATH's when other cycles have come and gone (twice), as other alts make new ATH's. Over the years, I've made extensive posts on XRP; documented its use case, followed the SEC case closely and yet, XRP still remains one of the strangest and most unpredictable alts I have ever tried to analyze. Long term followers will remember that a I was bullish in 2018/2019 and then slowly became uninterested up until the point of negative towards XRP for probably the past 3-4 years.
This is not only because of the lagging price compared to other older alts that soared like ETH and even Litecoin. Sure we did not see the growth and the taco stand ( who remembers ) just kept dumping on the market... But the entire "scandal" of the actors marketing/pimping, the dumping behind the scenes by executives to fund Ripple in early days, the lawsuit etc. was just such a colossal mess that I even wonder how XRP is still alive and kicking today.
All I'm saying is that this is truly a spectacular moment - it's hard to even imagine cripple crossed $3 after years and years of waiting on XRP when other alts x1000% and beyond. Point being - Don't miss it! Trading only works when you take profits.
________________________
BINANCE:XRPUSDT
Capital Doesnt Lie - The Energy ProblemPart 1: THE ENERGY PROBLEM
Everything we do produces energy, even prayer. If you have ever felt tired after praying for someone, that's because you spent energy and made an effort; let's call that energy 'capital' . Capital begins with effort, whether you see it or not.
The problem is: how do we use it or store it?
Imagine that energy as an invisible ball growing in front of your head. Every time you work and think, you're growing that invisible energy ball of capital. So, how do you get it in your hands? You can plant a cucumber, craft a chair, or clean your house. It's your order, attention, time- all energy made visible in the house, stored in the cucumber or the chair.
Genesis 3:19
'By the sweat of your face you shall eat bread…'
Verse Comment: It doesn't say 'by luck' or 'by inheritance.' It says by sweat. That's energy. That's effort. That's the value produced.
Proverbs 14:23
'All hard work brings a profit, but mere talk leads only to poverty.'
Verse Comment: Effort always creates something. Even spiritual labor, such as intercession, leadership, and parenting, is a form of value creation.
But here's the issue. That cucumber plant? It goes bad. That chair? It breaks. That clean house? Dirty again in 24 hours."
Everything we do has a cost; it's not free. Energy fades unless you can find a way to store it longer than the life of the thing you created.
So if everything fades, the big question becomes: How do you store the surplus of your energy, (the part you don't need today) so it doesn't fade by tomorrow?"
That's the foundation of all capital. Of all value. And of all wealth. And it starts with understanding where your energy is going, and what it's pouring into.
