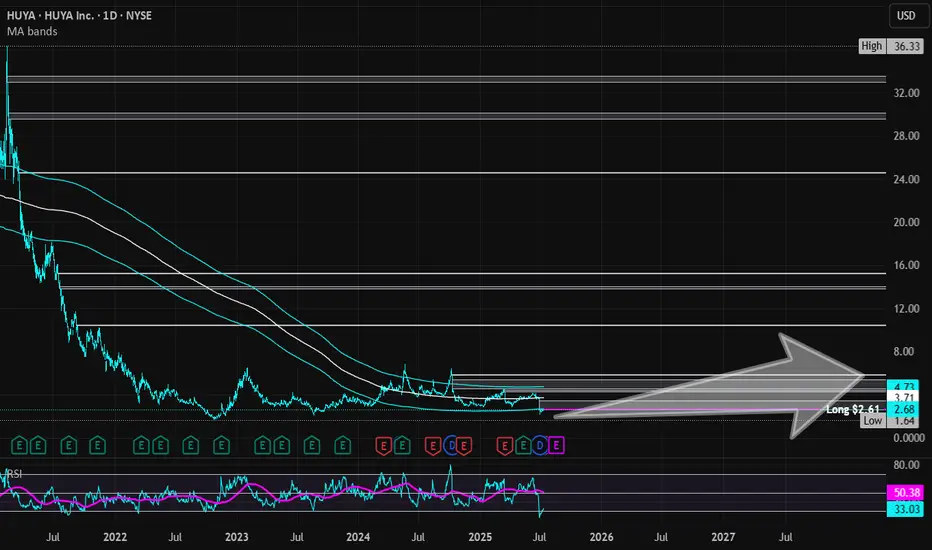
HUYA | HUYA | Long at $2.61HUYA NYSE:HUYA operates game live streaming platforms in China. This stock got my attention based on the reported fundamentals and price position, but moderate "Chinese delisting" risks exist given the US's new political administration.
Book Value = $3.23 (Undervalued)
Forward P/E = 4.1x (Growth)
Debt-to-equity = 0x (Healthy)
Quick Ratio = 1.56x (Healthy)
Altman's Z Score = <1.8 (Bankruptcy risk is relatively high)
From a technical analysis perspective, the stock price momentum has shifted upward based on the historical simple moving average. The price often consolidates within and slightly outside of this simple moving average band before progressing higher (after a long period of selling). While near term-declines are a risk, a longer-term hold (if the fundamentals do not change and delisting doesn't occur) may pay off given the value, growth, and overall health of the company.
Thus, at $2.61, NYSE:HUYA is in a personal buy zone.
Targets into 2028:
$3.45 (+32.2%)
$5.80 (+122.2%)
Growth
Elevance Health | ELV | Long at $286.00What are seeing in the healthcare and health insurance provider industry right now is destruction before a once-in-a-lifetime boom. The baby boomer generation is between 60 and 79 right now and the amount of healthcare service that will be needed to serve that population is staggering. Institutions are crushing them to get in - it's just near-term noise, in my opinion. My personal strategy is buy and hold every healthcare opportunity (i.e. NYSE:CNC , NYSE:UNH , NYSE:HUM etc).
Elevance Health NYSE:ELV just dropped heavily due to lower-than-expected Q2 2025 earnings, a cut in full-year profit guidance from $34.15-$34.85 to ~$30 EPS, and elevated medical costs in Medicaid and ACA plans. It's near-term pain (may last 1-2 years) which will highly likely lead to long-term growth. The price has touched my historical simple moving average "crash" band. I would not be shocked to see the price drop further into the $260s before a rise. However, the near-term doom could go further into the year. I am anticipating another drop to the "major crash" simple moving average band into the $190s and $220s to close out the remaining price gaps on the daily chart that occurred during the COVID crash. Not to say it will absolutely reach that area, but it's locations on the chart I have for additional buys.
Thus, at $286.00, NYSE:ELV is in a personal buy zone (starter position) with more opportunities to gather shares likely near $260 before a bounce. However, if the market or healthcare industry really turns, additional buys planned for $245 and $212 for a long-term hold.
Targets into 2028:
$335.00 (+17.1%)
$386.00 (+35.0%)

Long Term Investment cum Trading Idea ( FnO Stock)ASHOKLEY LTP 217
Tgt:242/264/295🤞🏻
Long-term: 328/399/432🤞🏻🤞🏻
May add more on dips till 206-191
For investors with a long-term perspective and the ability to add on dips or hold calmly.
Time Frame: 4 to 12 months 🤞🏻
Trade as per your risk management and investment plan.
#luv4stockmarket
#scammersfreetrading
#atmanirbharinvesting

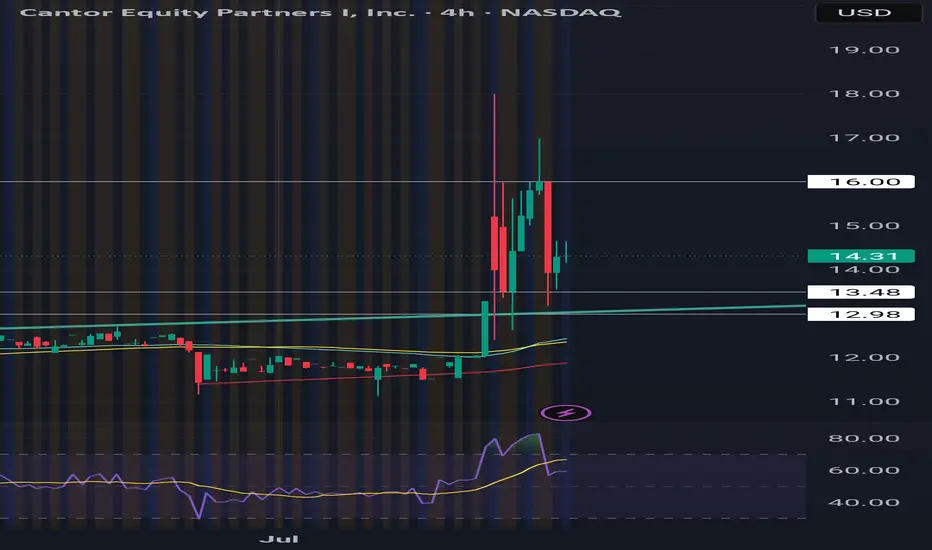
BTC TREASURY Adam Back, a satoshi era OG, is launching Bitcoin Standard Treasury Company (BSTR), which plans to go public through a merger with Cantor Equity Partners I (CEPO), a special-purpose acquisition company. BSTR will debut with 30,021 BTC, valued at approximately $3.5 billion, making it the fourth-largest public Bitcoin treasury. The company has secured $1.5 billion in private investment in public equity (PIPE) financing, the largest for a Bitcoin treasury SPAC merger, with CEPO contributing up to $200 million, subject to shareholder redemptions. The merger, expected to close in Q4 2025, aims to maximize Bitcoin ownership per share and accelerate adoption through Bitcoin-native financial products and advisory services. Ill be loading shares tommorrow and continuing to dca. Btc price swings will influence this heavily wind direction is currently North!
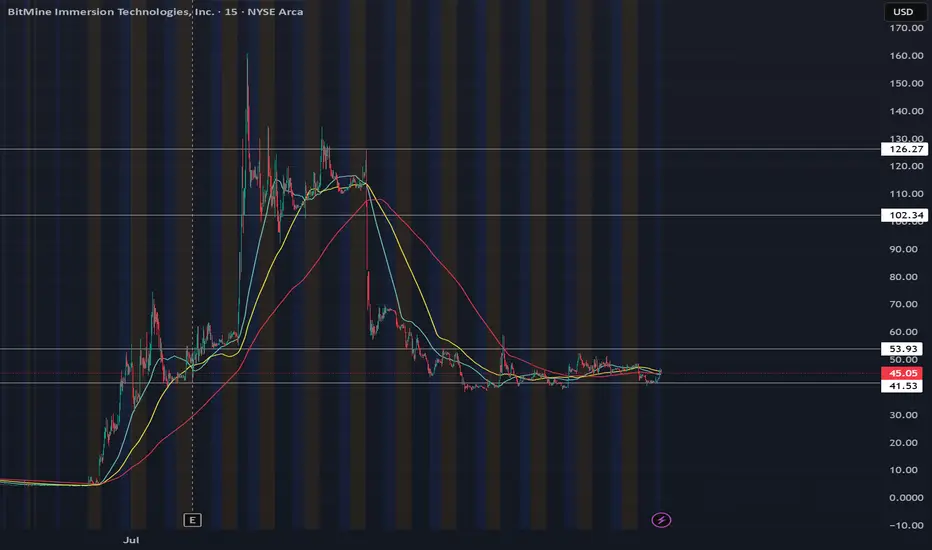
BACK TO 100Bought shares today at close new legislation is going to send this sky high. BMNR just may actually be the MSTR of ETH with the players they have. SBET BTBT COIN all will do great, but BMNR currently holds the lead for largest ETH treasury. Maybe more chop to average shares but this will be going SOON. As long as the daily RSI is above 50, we should be holding local support until breakout of this is accumulation zone.
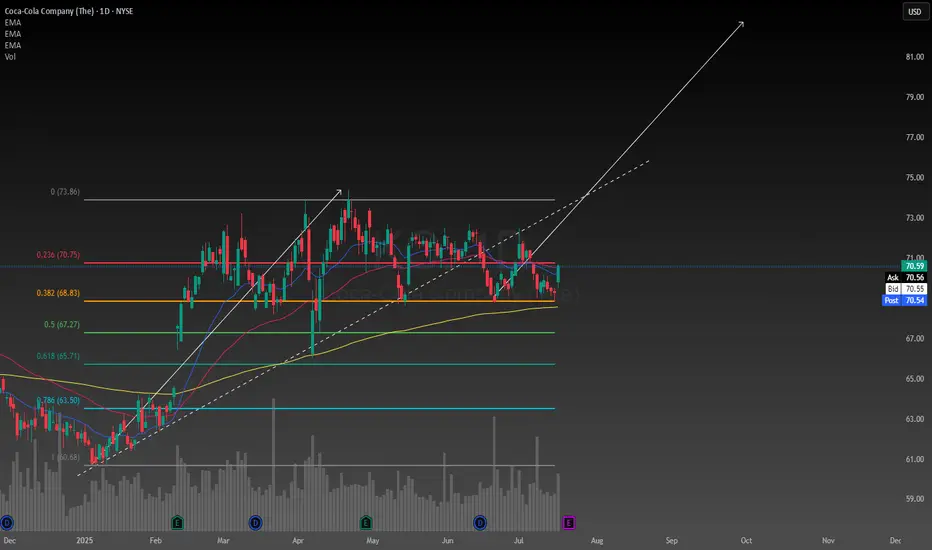
Coca Cola to protect my portfolio and help it growOne of the most important things we must try to determine as investors is what company is the best at what they do in their field. In my opinion Coca Cola is and has always been the number one soft drink manufacturer, always finding new yet subtle ways to stay ahead of their competition.
The reason I have allocated a decent amount of my portfolio to Coca Cola is a combination between their reliable track record of creating value, and paying dividends. People love junk food so it gives me high conviction to hold the stock long term. The company also demonstrates consistent, and reliable methods of generating organic revenue, and constantly finding new ways to cut costs and improve their profit margins.
Despite what some other critics may claim about the stock being over valued, the intrinsic value of the stock happens to be $77 with a range between $48-$180. According to technical analysis it is over valued. I have too much respect for Coca Cola to trust technical analysis in my decision to hold the stock, I am rely solely on fundamentals. According to my perspective on the company it is in fact undervalued.
Another positive catalyst I have noticed was when President Trump said he thinks Coca Cola should be made with cane sugar in the US, I think that would be a great idea, not only would it be healthier the soda would also taste better. Coca Cola looks like its going to stay ahead of the game for the foreseeable future.
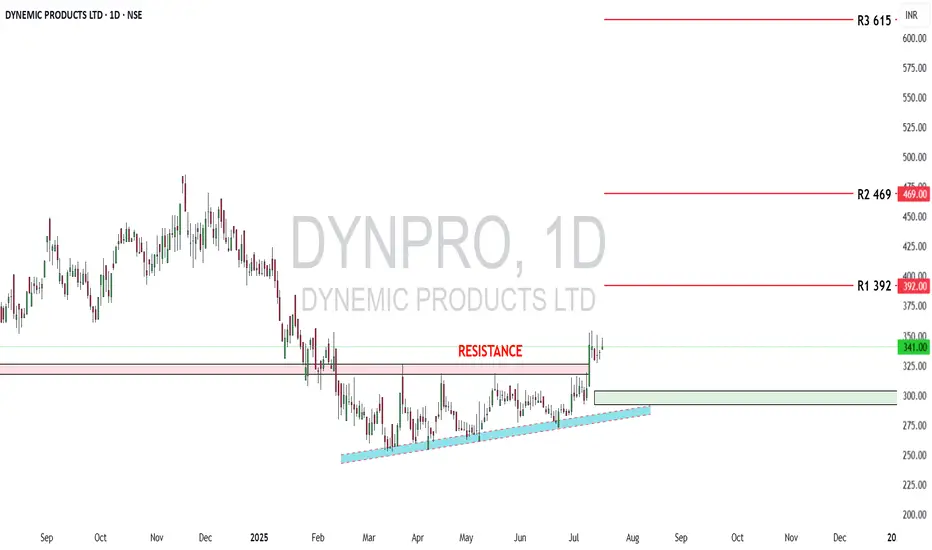
Dynemic Ltd: Bullish Setup UnfoldingDynemic Products Ltd (NSE: DYNPRO) is a well-established exporter and manufacturer of synthetic food-grade dyes, lake colors, and D&C colors, catering to global markets. As of July 16, 2025, the stock trades at ₹341 and has recently broken out of a prolonged consolidation zone, indicating renewed investor interest.
From a fundamental perspective, the company’s financials show notable improvements:
🔸 Revenue (FY25): ₹214 crore, up 29% YoY
🔸 Net Profit (FY25): ₹15 crore, up 269% YoY
🔸 EPS (TTM): ₹3.65
🔸 P/E Ratio: ~23× – moderately valued
🔸 P/B Ratio: ~1.56× – near fair book value
🔸 ROE: ~7%, showing improving return to shareholders
🔸 ROCE: ~12.7%, indicating decent operational efficiency
🔸 Debt-to-Equity: ~0.43× – financially stable
🔸 Current Ratio: ~0.95× – slightly below ideal liquidity levels
🔸 Operating Cash Flow: ₹28 crore – healthy cash generation
While the company has a stable balance sheet and growing profitability, investors should note that liquidity remains slightly tight, requiring careful monitoring of working capital and short-term obligations. Nonetheless, the financial turnaround and earnings consistency signal strength.
On the technical front, the stock has shown strong bullish action after breaking above a multi-month resistance:
🔹 Breakout Zone Cleared: ₹325–₹330 (previous resistance)
🔹 Current Price: ₹341
🔹 Reversal Zone (Strong Support): ₹292 to ₹304
🔹 R1: ₹392 – short-term resistance
🔹 R2: ₹469 – medium-term target
🔹 R3: ₹615 – long-term upside if momentum sustains
The breakout is confirmed with increased volume and a clear higher-high, higher-low structure, validating bullish sentiment. The price now rides above a rising trendline, suggesting trend continuation unless a breakdown occurs below ₹292.
In summary, Dynemic Products Ltd currently offers a compelling techno-fundamental setup. The financials have improved significantly, valuations remain reasonable, and the technical breakout suggests potential for further upside. Investors can consider accumulating on dips above ₹304, while swing traders may target ₹392 and ₹469 in the short-to-medium term. A close watch on liquidity and cash flows is advised, but the stock presents a strong growth case in the specialty chemicals space.
Disclaimer: lnkd.in

HUGE BULL FLAG BREAKOUT with Stifel Coverage initiation at $5.Been preaching this for a couple years, but just pour through this chart with amazing fundamentals, Govt contracts, and $200M Indonesian contract... just lovely...

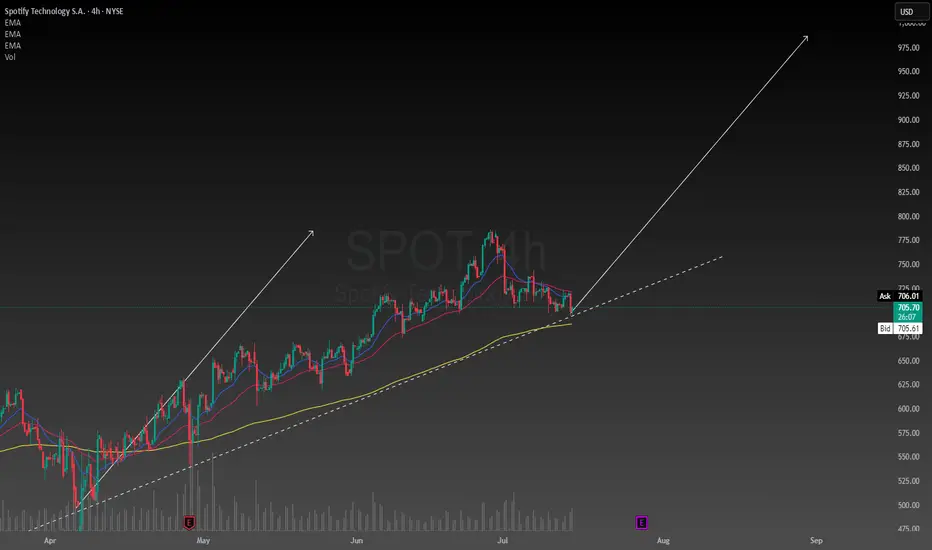
Raising the bar for SpotifySpotify has been my favorite stock so far this year. Primarily because resilience in uncertain economies. Subscription-based services, especially freemium models, are seen as defensive. Spotify is the number one music streaming service in the world and unless that changes people will keep using it every single day in their lives.
They will generate revenues based on advertisements and subscriptions which are in my opinion reasonable and conducive of a strong business model. I am raising my price target to $985. This is not unreasonable considering the intrinsic value of the stock is between $400 and $2900. I am confident Spotify will find ways to stay ahead of its competitors and dominate the music streaming industry. While keeping its customers happy and loyal.
KALV FDA approval rallyKALV received FDA approval this week for a new drug, has $220mln in cash, and just bounced off the daily 21EMA (overlayed on this 4H chart).
Recently rejected off the monthly 100ema two times (overlayed on this 4H chart). Breakout beyond the monthly 100ema and first target is $20. Numerous price target increases, most notably, one at $27 and another increased from $32 to $40.


barrick, run it hotfiscal dominance adding downward pressure on dollar. long term chart look favourable with key fib levels being touched. added copper exposure in usa, abx has some legs

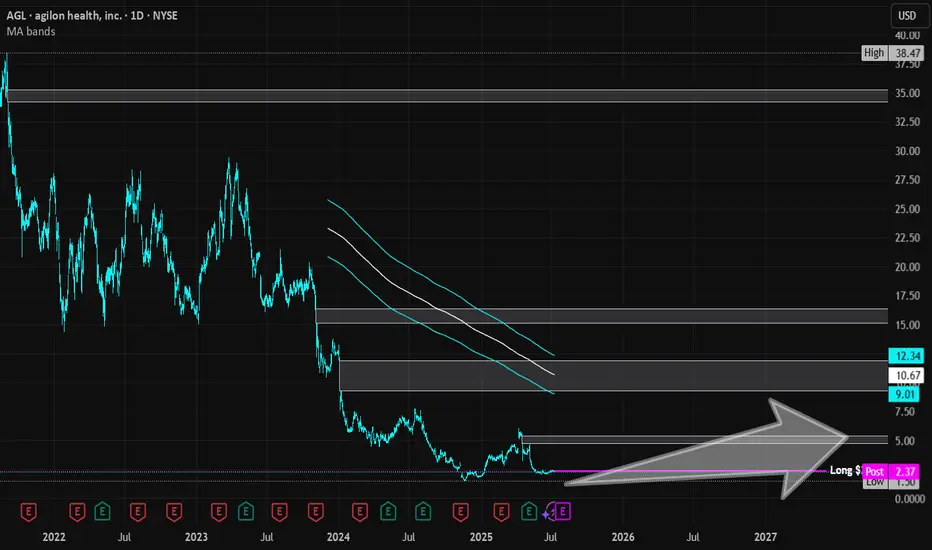
Agilon Health | AGL | Long at $2.36Reentering this trade (original: )
Agilon Health NYSE:AGL
Pros:
Revenue consistently grew from 2019 ($794 million) to 2024 ($6.06 billion). Expected to reach $9.16 billion by 2028.
Current debt-to-equity ratio 0.07 (very low)
Sufficient cash reserves to fund operations and strategic initiatives
Strong membership growth (659,000 in 2024, a 38% year-over-year increase)
Recent insider buying ($2 - $3) and awarding of options
Cons:
Rising medical costs - currently unprofitable and not forecast to become profitable over the next 3 years
Medicare Advantage Membership issues with the new political administration
No dividend
It's a gamble and I think it's a possibility this could drop near $1 in the near-term due to the Medicaid changes/fear... regardless, long-term, personal buy-zone at $2.36.
Targets in 2027
$3.70 (+56.8%)
$5.25 (+122.5%)
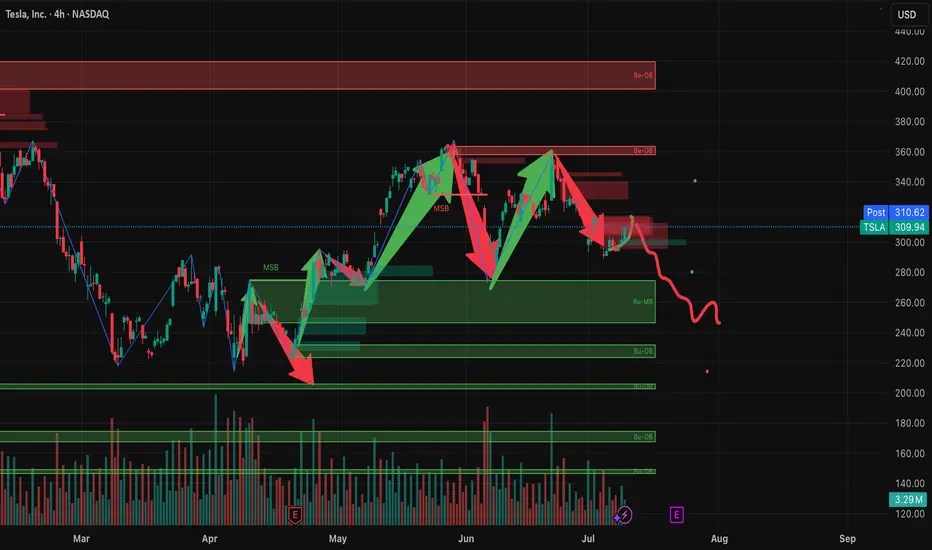
Why TSLA will Crash based On Copper TarrifsHere’s why that bearish outlook is gaining traction:
Copper costs are surging: Tesla uses over 180 pounds of copper per vehicle. With prices spiking 13% in a single day and a 50% tariff looming, production costs are rising fast.
Analysts are cutting price targets: UBS, JPMorgan, and Bank of America have all lowered their forecasts for Tesla, citing margin pressure and weakening demand3.
Brand sentiment is shaky: Tesla’s recent delivery miss and political controversies around Elon Musk have added to investor unease.
Tariff ripple effects: The broader trade war is expected to disrupt supply chains and inflate costs across the EV sector5.
That said, some analysts still see long-term upside if Tesla can pivot quickly—especially with its AI and autonomous driving ambitions. But for now, the market is reacting to the immediate risks.
Overall Enter Short for Gains of 3-5 percent.
Gold royaltyI am following long diagonal trend line in the chart of GROY. There is some divergence in RSI, and support in the distance from MA. A company with good value and probable triple bottom.
With two new producing royalties from this year growth looks inevitable.
Do your own research!

Figs Inc | FIGS | Long at $5.24Figs Inc $NYSE:FIGS. Technical analysis play first, fundamentals second.
My selected historical simple moving average lines have converged with the stock price, which often leads to sideways trading and a reversal in the downward trend (i.e. future price increase). The downward trend is flattening, but that doesn't mean post-earnings drop to $1.50-$2.00 isn't out of the question...
The FIGS brand is growing within the healthcare world with significant opportunities overseas. While economic headwinds may impede near/medium-term growth, revenue is anticipated to grow into 2027. EPS is expected to rise from 0.01 in 2024 to 0.20 by 2027. While this is not a "value" play and there is high risk for rug pulls, something may be brewing within the chart for a move up. Tread lightly, however...
Targets
$6.00
$6.40
$7.00
$8.00

Applied Materials | AMAT | Long at $169.75Republican Ashley Moody recently dropped $200k-$500k on Applied Materials $NASDAQ:AMAT. The semiconductor boom may not be over...
Price-to-earnings: 21.68x (great in comparison to others...)
Debt-to-equity: 0.34x (low)
Cash flow: $10.4 billion (FY2024)
Insiders awarded options recently
Unless NASDAQ:NVDA brings the market down, NASDAQ:AMAT is in a personal buy zone at $169.75. While the price may dip in the near-term to the $140s, bullish until the semi boom dies...
Targets:
$195.00
$215.00
$240.00

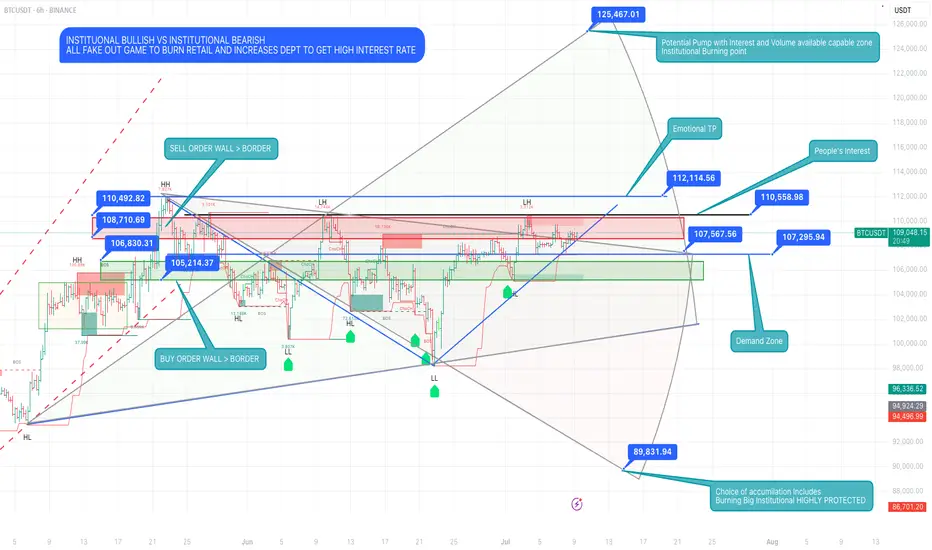
The Whale’s Blueprint: Read It Before It Happens🧠 The Real Game
Institutional Bullish vs Institutional Bearish — It Was Never About Direction.
This chart isn’t about setups.
It’s a blueprint of manipulation, a battlefield map where:
• Retail gets trapped at emotional highs
• Liquidity gets swept in layers
• Institutions reload in silence
• And the price becomes the puppet, not the player
🔺 Top Red Zones (106K–112K):
These aren’t resistance. They’re execution zones for sell walls, fake breakouts, and late long liquidations.
🔻 Green Demand Zones (105K & Below):
Not support. They’re reaction chambers — where whales absorb panic and retail exits in fear.
💥 125K is not a fantasy. It’s a controlled explosion waiting to happen —
But only if the trap is set right and the fuel (volume + interest) loads in.
🧱 Real accumulation doesn’t happen in comfort.
It happens in the shadows, at the edges of fear.
This isn’t price action.
This is power action.
⸻
“Most trade the surface.
Snipers wait beneath it…
and strike before the story reveals itself.”
#BTCUSDT #LiquidityGame #WhaleTrap #InstitutionalZones #SniperMindset #KaizenMethod #TheRealGame
JD.cm | JD | Long at $33.16Like Amazon NASDAQ:AMZN and Alibaba NYSE:BABA , I suspect AI and robotics will enhance JD.com's NASDAQ:JD automation in warehousing, delivery, and retail. There is some risk here, like other Chinese stocks, that they could be delisted from the US market if trade/war tensions rise. But I just don't think that is likely (no matter the threats) due to the importance of worldwide trade and investment. I could be way wrong, though...
NASDAQ:JD has a current P/E of 8.1x and a forward P/E of 1.2x, which indicates strong earnings growth ahead. The company is healthy, with a debt-to-equity of 0.4x, Altmans Z Score of 2.6, and a Quick Ratio of .9 (could be better).
From a technical analysis perspective, the historical simple moving average (SMA) band is still in an overall downtrend but starting to level out (accumulation of share area). It is possible, however, that the price may drop into the $20s to close out the existing price gaps on the daily chart as tariff threats arise. But that area is another personal entry zone if fundamentals hold.
Thus, while it could be a bumpy ride and the risk is there for delisting, NASDAQ:JD is in a personal buy zone at $33.16 (with known risk of drop to the $20s in the near-term).
Targets into 2028:
$44.00 (+32.7%)
$52.00 (+56.8%)

Alibaba | BABA | Long at $108.84Like Amazon, I suspect AI and robotics will enhance Alibaba's NYSE:BABA e-commerce, logistics, and cloud computing operations. There is some risk here, like other Chinese stocks, that they could be delisted from the US market if trade/war tensions rise. But I just don't think that is likely (no matter the threats) due to the importance of worldwide trade and investment. I could be way wrong, though...
NYSE:BABA has a current P/E of 14.2x and a forward P/E of 2x, which indicates strong earnings growth ahead. The company is very healthy, with a debt-to-equity of 0.2x, Altmans Z Score of 3.3, and a Quick Ratio of 1.5. If this were a US stock, investors would have piled in long ago at the current price.
From a technical analysis perspective, the historical simple moving average (SMA) band has started to reverse trend (now upward), indicating a high potential for continued (overall) price movement up. It is possible, however, that the price may reenter the SMA band in the near-term - the $80s aren't out of the question - as tariff threats arise. But that area is another personal entry zone if fundamentals hold.
Thus, while it could be a bumpy ride and the risk is there for delisting, NYSE:BABA is in a personal buy zone at $108.84 (with known risk of drop to the $80s in the near-term).
Targets into 2028:
$125.00 (+14.8%)
$160.00 (+47.0%)

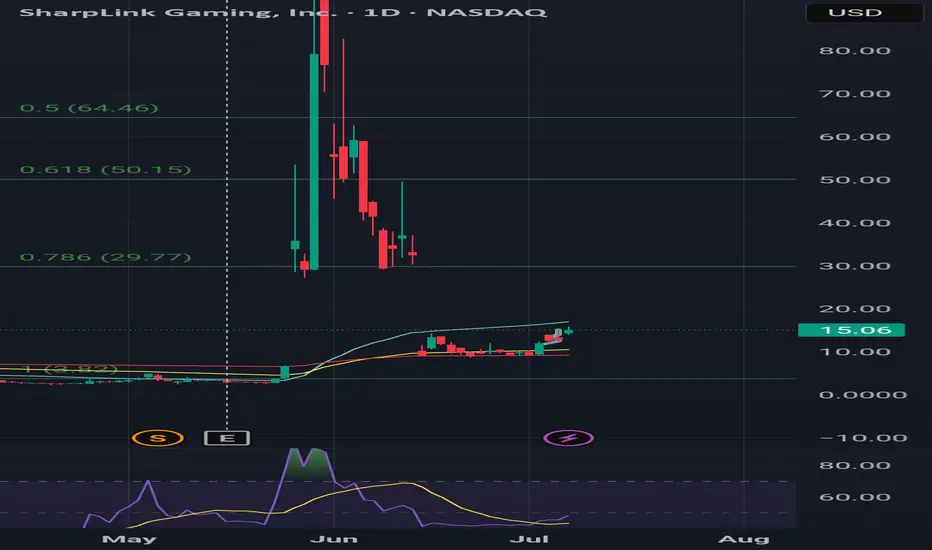
$30 easy by 2026I'm holding the 1/16/26 25C those are the highest and furthest out options you can get on hood. Bought at 1.55 on 7/2 now worth 3.30 good entries if eth pulls back would be 12 and 10 best case. I see this running quick I will sell atleast half at 30. They hold and are staking over 500M worth of eth largest amount for any publicly traded company, yeild will be great for them but they are obviously selling shares to purchase eth so there's plenty of risk company only has 5 employees according to hood still under 1B last time I checked. 50ma is around 16 should be a clear path to 30 maybe psychological resistance at 20.
LITECOIN (LTC) - On The Verge Of Exploding - ETF Catalyst?Litecoin: A Decentralized Network with a Differentiated Risk Profile
Litecoin (LTC), launched in 2011 by former Google engineer Charlie Lee, is one of the oldest and most active Layer-1 blockchain networks in the cryptocurrency space. Often referred to as the “digital silver” to Bitcoin’s “digital gold,” Litecoin was designed to offer faster transactions, lower fees, and broader accessibility while maintaining a similar monetary policy and codebase.
This post aims to provide an overview of Litecoin’s technical structure, usage, risk profile, and current developments—without speculative bias—so readers can form their own assessments.
1. Transparent Origins and Founder Dynamics
One key difference between Litecoin and Bitcoin lies in the identity of their respective creators. Bitcoin was developed by Satoshi Nakamoto, a pseudonymous and still-unknown individual or group, who is estimated to hold 750,000 to 1.1 million BTC—a significant portion of the total supply that has never moved. The dormant status of these holdings has occasionally raised concerns about future market impact if they were ever activated.
In contrast, Litecoin was founded by Charlie Lee, a known and public figure who was active in the community before, during, and after the launch. In 2017, Lee announced he had sold or donated nearly all his LTC holdings to avoid any potential conflict of interest. Today, no founder or insider is known to hold a disproportionate share of the Litecoin supply. This level of transparency and decentralization has been interpreted by some as a factor that lowers long-term governance and concentration risk.
2. Structural Simplicity and Leverage Exposure
Another distinction between Litecoin and Bitcoin lies in market structure and exposure to leverage.
Bitcoin is widely used as collateral in crypto lending markets and institutional derivatives, including perpetual futures and structured products. This has introduced significant systemic risk during periods of market stress, as high leverage has historically led to cascading liquidations across centralized and decentralized platforms.
Litecoin, in contrast, has relatively limited exposure to leveraged products and collateralized lending. It is not commonly used as collateral in CeFi or DeFi protocols, and institutional futures markets for LTC are smaller and less active. As a result:
Litecoin is less likely to trigger or be affected by mass liquidations
It has reduced systemic risk due to lower market entanglement
Its price tends to reflect more organic supply/demand dynamics
It is less involved in cross-collateralized or rehypothecated loan systems
This simpler structure may appeal to risk-aware investors looking for cleaner exposure without the reflexivity effects common in heavily leveraged markets.
3. Scarcity and Monetary Policy
Litecoin shares a similar deflationary model with Bitcoin, with a hard cap of 84 million LTC and scheduled halving events every four years. The most recent halving occurred in August 2023, reducing the block reward from 12.5 to 6.25 LTC per block.
With over 75 million LTC already mined, fewer than 9 million remain in future issuance. The protocol’s monetary policy is deterministic and cannot be altered unilaterally, which may appeal to those who prioritize predictable supply and inflation resistance.
While Litecoin’s cap is four times higher than Bitcoin’s, the relative issuance schedule and halving dynamics mirror Bitcoin’s design. Some investors view this as a hedge against fiat currency debasement, although the asset's volatility and adoption context should be taken into account.
4. Network Fundamentals and Real-World Use
Litecoin has maintained near 100% uptime since inception, and its transaction throughput and fee structure are generally favorable compared to many competing networks.
In 2024, Litecoin became the most used crypto for payments via BitPay, surpassing Bitcoin in transaction volume, driven by its fast 2.5-minute block times and low transaction fees. It is supported by major platforms including PayPal, and accepted by thousands of online and retail merchants.
From a security perspective, Litecoin’s hashrate reached all-time highs in 2025, partly due to merge-mining with Dogecoin, which has helped strengthen its proof-of-work infrastructure. Network upgrades like MWEB (MimbleWimble Extension Blocks) have added optional privacy layers to Litecoin’s UTXO model, while Lightning Network integration supports instant payments.
These developments suggest that Litecoin continues to evolve, with emphasis on efficiency, user privacy, and practical usability.
5. Institutional Presence and ETF Outlook
Litecoin has seen modest but growing institutional involvement. Products such as the Grayscale Litecoin Trust (LTCN) have existed for several years, and Coinbase introduced Litecoin futures trading in 2024. Fidelity also offers LTC trading and custody to institutional clients.
More notably, a Spot Litecoin ETF application is currently under review by the U.S. Securities and Exchange Commission (SEC), with analysts from Bloomberg estimating a 95% probability of approval before the end of 2025. If approved, this would make Litecoin one of the first proof-of-work assets outside of Bitcoin to gain direct exposure through a regulated ETF vehicle.
Should that happen, it may increase access, liquidity, and legitimacy among traditional investors. However, as always, regulatory decisions remain uncertain and subject to broader political and market conditions.
6. Technical Structure and Long-Term Price Action
From a macro-technical perspective, Litecoin has historically followed a pattern of higher lows and higher highs across each market cycle. This structure remains intact as of 2025, with a strong support at 81 USD on a 6 months timeframe.
Summary
Litecoin presents a combination of characteristics that differentiate it from other crypto assets, including:
✅ A public, transparent founder and no major insider dominance
✅ Limited exposure to leveraged lending, reducing systemic risk
✅ Deterministic monetary policy with a fixed supply and halving schedule
✅ Real-world usage in payments and retail adoption
✅ Strong network security and development activity
✅ Potential ETF approval that may broaden accessibility
These features do not necessarily imply outperformance, but they form the basis for an asset with a relatively clean structure, historical resilience, and a distinct position in the crypto ecosystem.
🔎 Disclaimer:
The information presented here is for educational and informational purposes only and should not be interpreted as financial advice.
Always conduct your own research, assess your individual risk profile, and make investment decisions based on your own analysis and objectives.
