NewtekOne | NEWT | Long at $10.92NewtekOne NASDAQ:NEWT is a financial holding company providing business and financial solutions to small- and medium-sized businesses across the U.S. Services include Newtek Bank, business lending, SBA loans, electronic payment processing, payroll and benefits, insurance, and technology solutions. While the stock has taken a major hit recently, insiders have scooped up over $1 million in shares with an average price of $11.70. Currently trading at a P/E of 5.6x, forward P/E of 6.6x, and near book value, the stock may be poised for a move up soon with the anticipation of interest rates dropping. Revenue is up 24.93% from $271.15M (2023) to $338.73M (2024) and earnings are forecast to grow 11.63% per year, but the company does have a high debt-to-equity ratio (over 5x).
Tariffs could indirectly impact NASDAQ:NEWT by increasing costs for its small- and medium-sized business clients, particularly in industries reliant on imports (e.g., manufacturing, retail). Higher costs may reduce client profitability, increasing loan default risks or reducing demand for Newtek’s lending and payment processing services. But an interest rate reversal may greatly limit the impact (longer-term).
So, at $10.92, NASDAQ:NEWT is in a personal buy zone.
Targets into 2027:
$12.00 (+9.9%)
$14.00 (+28.2%)
Growth

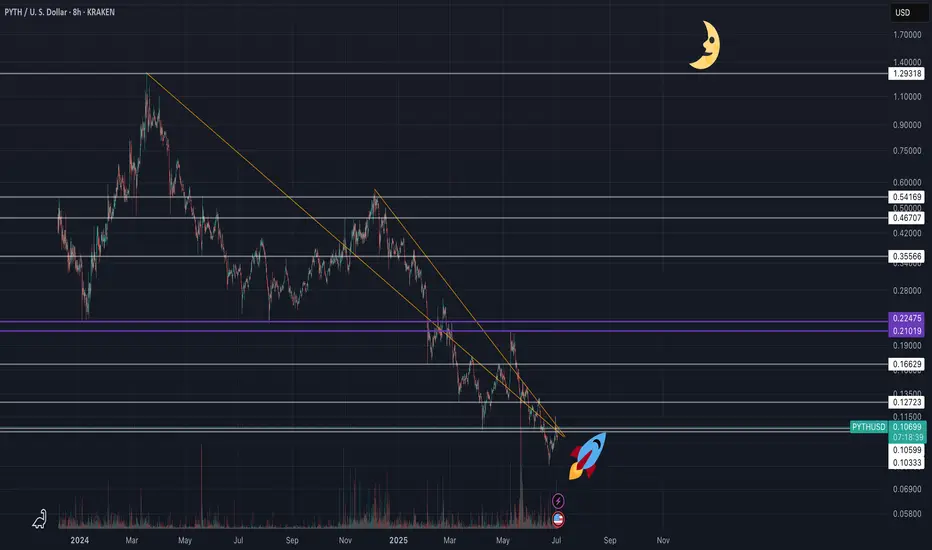
PYTH NETWORK (PYTHUSD) - (10X - 50X Potential)Pyth Network is an oracle protocol originally built for Solana, optimized for ultra-low latency and first-party data directly from exchanges and market makers. Unlike Chainlink’s node-aggregator model, Pyth enables real-time price feeds (as fast as 400ms) sourced directly from over 100 institutional providers, including Binance and Cboe.
🧩 Why Pyth?
DeFi apps need fast, accurate pricing to avoid exploits and ensure fair trading. Pyth delivers high-frequency, high-integrity data, especially valuable for derivatives, perpetuals, and high-speed DeFi protocols.
🌐 Massive Expansion
What started on Solana now powers 100+ blockchains, including Ethereum L2s, Cosmos, Sui, Aptos, TON, and more. As of 2025, over 420 protocols integrate Pyth, with over $48B+ monthly trading volume secured. It has become the #2 oracle in DeFi by usage, dominating ecosystems like Solana, Sui, and Injective.
📊 Tokenomics & Unlocks
Max supply: 10B PYTH
Circulating: ~5.75B (mid-2025)
Next major unlock: May 2026 (~2.1B tokens)
Utility: Governance, staking, publisher rewards, and oracle integrity
Pyth’s decentralized governance is growing, with a DAO now guiding key protocol parameters. It’s also expanding beyond price feeds, launching products like randomness (Entropy) and MEV mitigation tools (Express Relay).
Disclaimer: This is not financial advice. Always do your own research before making investment decisions.
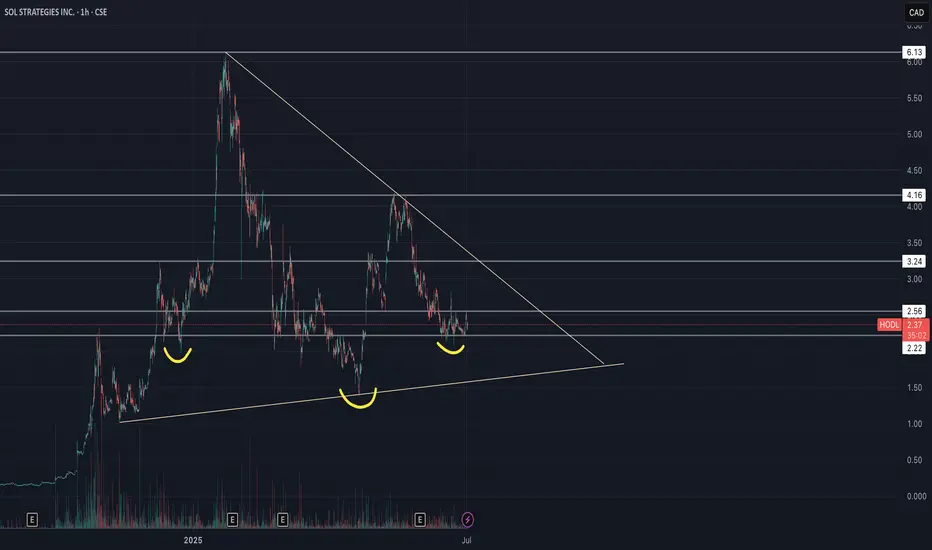
Sol Strategies Inc (HODL) - Inverse H&S🚀 SOL Strategies (HODL) – Public Market Gateway to Solana Yield
SOL Strategies (CSE: HODL) is a publicly traded company laser-focused on the Solana ecosystem. With nearly 395,000 SOL held (most of it staked) and over 3.7 million SOL delegated to their validators, they generate consistent income through staking rewards and validator commissions.
Their business model is simple:
📌 Accumulate SOL → Stake it → Run institutional-grade validators → Earn yield
📌 Expand through partnerships (3iQ, Neptune, BitGo, Pudgy Penguins)
📌 Hold strategic Solana ecosystem tokens like JTO and jitoSOL
📌 Operate with SOC 2-certified infrastructure and pursue a Nasdaq listing
SOL Strategies is not just holding crypto – they are building core infrastructure for Solana, giving equity investors direct exposure to staking economics in one of the fastest-growing blockchain networks.
📊 For traders: HODL stock offers a pure-play vehicle for Solana exposure, with an income-generating twist.
⚠️ Always do your own investment research and make your own decisions before investing.
MUSK on TRUMP's Bill | "outrageous, disgusting abomination"Elon Musk’s sided against the latest Trump-backed tax-and-spending package, in a plot twist between the recent partners turned enemies.
Musk called the legislation a “massive, outrageous, pork-filled Congressional spending bill” and a “disgusting abomination,” publicly shaming senators and representatives who backed it.
With such a strong opinion against it one may wonder, is this going to negatively affect Tesla?
Together with this strong reaction, the price has already been trading lower for the past few days.
The administration has defended it as the “One Big Beautiful Bill,” insisting it will stimulate growth, even though Elon Musk warned the bill would swell the U.S. budget deficit by roughly $2.3–2.5 trillion over the next decade, calling the added debt “crushingly unsustainable”.
When I first read this, it made me think of Tesla's long generated “green credits”, which in 2024 alone, brought in roughly $2.76 billion. “green credits” (officially, zero-emission or regulatory credits) work by building more clean vehicles than required and selling the excess allowances to other automakers that need them to comply with emissions mandates.
Now I'm no expert on US policy, and so I roped in GPT to help me explain how this new bill implicates TESLA's profit:
Under the Senate’s “big, beautiful” tax-and-spending bill, Tesla’s regulatory-credit business faces two assaults:
❗ Repeal of CAFE- and ZEV-mandates
The bill would eliminate penalties for automakers missing Corporate Average Fuel Economy targets and roll back zero-emission vehicle mandates that currently force legacy manufacturers to buy credits if they fall short. Remove those penalties and mandates, and there’s no structural need for credits—undercutting the very market that funds Tesla’s $2–3 billion-a-year credit-sales business
❗ End of consumer EV tax incentives
By phasing out the $7,500 new-EV credit (and the $4,000 used-EV credit) within months of enactment, the bill dampens U.S. EV demand overall. A smaller EV market means fewer opportunities for Tesla to leverage fleet-wide ZEV regulations against higher-emitting rivals—further squeezing credit prices and volume
Bottom line: Without CAFE/ZEV obligations and with EV purchase subsidies gone, Tesla’s “green-credit” line—a major profit driver in recent quarters—would likely collapse, removing a key buffer against manufacturing and pricing pressures.
This could be the beginning of a bear market for Tesla lasting throughout the rest of the Trump administration.
________________________
NASDAQ:TSLA

SharpLink Gaming Inc (SBET) - Falling Wedge & Inverse H&S🚀 SharpLink Gaming ( NASDAQ:SBET ) – Ethereum, Joe Lubin & a Bullish Setup
SharpLink Gaming has undergone a bold transformation: the company is now the largest public holder of Ethereum (ETH), with ~198,000 ETH acquired since June 2025. Over 95% of it is staked, already earning 200+ ETH in rewards – turning ETH into a yield-bearing treasury asset.
Driving this shift is Joe Lubin, co-founder of Ethereum and CEO of ConsenSys, who recently became Chairman of SharpLink. Under his leadership, SBET is betting big on Ethereum as “digital capital”, aiming to merge iGaming and Web3.
📊 Technical Setup:
SBET is forming a falling wedge and an inverse head and shoulders – both classic bullish reversal patterns. After a post-announcement retracement, the chart suggests growing potential for a breakout as fundamentals strengthen.
🧠 My thesis: This is MicroStrategy playbook 2.0 – but with ETH instead of BTC. SharpLink gives equity exposure to Ethereum + staking yield + visionary leadership.
🔔 Worth watching closely.
⚠️ Always do your own investment research and make your own decisions before investing.

How I screen for long term investmentsIn this video, I’ll show you the exact stock screener I use to find long-term investment opportunities — the kind of stocks you can buy and hold for years.
I’ll walk you through the key metrics to look for, how to use free tools like TradingView screener, and what red flags to avoid. This strategy is perfect for beginner and experienced investors who want to build long-term wealth, not chase hype.
Whether you're looking for undervalued stocks, consistent compounders, or just trying to build your long-term portfolio, this screener can help.
Hope you enjoy!!

Rockwell Automation | ROK | Long at $268.96Rockwell Automation NYSE:ROK appears to be gaining upward momentum once again. With two price gaps above (highest near $333+) and the historical simple moving average lines showing a positive change, this company could be poised to fill the gaps soon. A strong billion-dollar company with rising revenue, but stay cautious of the slightly high debt, insider selling, and changing economy / tariff implications.
At $268.96, NYSE:ROK is in a personal buy-zone.
Targets:
$300.00
$333.00

KULR | High-Growth Channel Reversal – Targets +298% to +2,368%📍 Ticker: AMEX:KULR (KULR Technology Group, Inc.)
📆 Timeframe: 1W (Weekly)
📉 Price: $7.11
📈 Pattern: Rising parallel channel with bullish consolidation
🔍 Technical Setup:
AMEX:KULR is respecting a clean ascending channel since early 2023 and is currently consolidating just above key support and the lower trendline, forming a launch base.
🔵 Key Resistance: $6.51 has flipped to support
📈 Price bounced from demand zone + holding mid-channel
📊 Volume profile supports accumulation at lows
🧠 Trade Plan & Dynamic Stop:
📥 Entry Zone: $6.80–$7.20
⛔ Trailing Stop: A few % below the lower rising trendline
→ Trail it dynamically as the channel rises (e.g. ~4–7% buffer under trendline)
🎯 Targets & ROIC:
🎯 Target 1: $9.45
→ Return: +31.3%
🎯 Target 2: $28.81
→ Return: +305.1%
🎯 Target 3 (Channel Top): $168.12
→ Return: +2,268%
⚠️ Key Technical Notes:
Bullish retest of major breakout zone ($6.50) is holding
Trendline structure is strong → perfect for trend-following strategy
Trailing stop method protects gains without prematurely exiting
Momentum expected to increase above $9.00
💬 Is KULR about to explode higher with the next growth leg?
Watch for confirmation above $9.50 for breakout acceleration.
#KULR #ChannelBreakout #SmallCapTech #ExplosiveSetup #TrendTrading #TargetTraders

Parcl - PRCL-USD - 30 Million Market Cap (100x Potential)www.tradingview.com
CHATGPT Research Summary:
Parcl: Unlocking Real Estate Exposure on the Blockchain
Introduction:Parcl is a groundbreaking decentralized platform that enables traders and investors to speculate on real estate market price movements much like they trade crypto or equities. By combining real-time housing data with blockchain technology, Parcl offers around-the-clock, borderless, and highly liquid exposure to global residential real estate markets. In this comprehensive blog post, we’ll explore what Parcl is, how it works, what it means to own the EGX:PRCL token, the unique opportunities it provides for investors (including AI-driven strategies), its core strengths, and the risks and challenges it faces. The tone is professional, investment-focused, and designed for the TradingView audience.
What is Parcl and How Does It Work?
Parcl allows users to trade real estate price indices for global cities without ever owning or transacting physical property. Each index represents the aggregated median price per square foot/meter for residential properties in a specific city. Users can go long or short on these indices using perpetual contracts with up to 10x leverage, entirely on-chain and settled in USDC.
Built on Solana, Parcl leverages the blockchain's high speed and low fees to offer a seamless and cost-efficient trading experience. Users only need a Solana-compatible wallet (e.g., Phantom) to deposit USDC, select a city index, and place a trade. There are no barriers such as down payments, brokers, or escrow delays — just rapid, decentralized access to global housing markets.
Data integrity is ensured through Parcl Labs, which aggregates millions of housing data points daily to generate real-time city indices. These feeds are streamed on-chain via oracles like Pyth Network, ensuring transparency and reliability.
What Does It Mean to Own EGX:PRCL ?
The EGX:PRCL token is the governance and utility token of the Parcl ecosystem. Holders of PRCL can:
Participate in protocol governance by voting on changes to platform parameters, fee structures, and market expansions.
Access premium real estate data and analytics through Parcl Labs.
Receive airdrops, rewards, or staking incentives as part of community growth and loyalty initiatives.
While PRCL doesn’t currently offer revenue sharing, it grants holders influence over protocol decisions and potential future economic alignment as the ecosystem matures.
A New Asset Class for Investors and AI Agents
Parcl opens up a completely new asset class: blockchain-native, synthetic real estate exposure. This has major implications:
For retail investors, it democratizes access to real estate, which was previously limited by geography, capital requirements, and illiquidity.
For sophisticated traders, it enables granular bets (e.g., short New York, long Miami) and high-frequency strategies previously impossible in traditional real estate.
For AI agents and algorithmic investors, Parcl provides composable, on-chain access to a diversified asset class that can be rebalanced and traded programmatically.
In short, Parcl makes real estate a liquid, programmable, and globally accessible financial primitive.
Core Strengths: Why Parcl Stands Out
Solana-native speed & cost-efficiency: Enables fast execution and micro-investments ($1+), ideal for retail users and automated agents.
Unique data infrastructure: Parcl Labs’ real-time indices provide unparalleled accuracy and granularity.
Sophisticated perpetual AMM model: Handles liquidity and market balancing with dynamic funding rates and cross-margining.
Growing community and product-market fit: With 80,000+ users and over $1.3B in cumulative volume, Parcl is becoming the most liquid real estate trading venue in the world.
Risks and Threats to Consider
Regulatory uncertainty: Synthetic real estate products may eventually face classification as securities or derivatives in some jurisdictions.
Liquidity dependencies: The AMM model depends on sufficient USDC liquidity pools; low liquidity could cause slippage or insolvency risk.
Smart contract vulnerabilities: As with all DeFi platforms, there is non-zero risk of exploits or oracle manipulation.
Platform dependency: Parcl is tightly coupled to Solana — if the chain experiences downtime or congestion, the protocol may be impacted.
Investors should also be aware of token unlocks and potential dilution from early backers and treasury allocations.
Future Outlook and 100x Potential
With a current market cap near $30 million, Parcl represents a high-upside, early-stage bet on tokenized real estate. If the project gains traction and achieves broader adoption, it’s feasible to imagine a future market cap of $2.5 to $3 billion, representing a 100x potential from current levels.
Factors that could drive this include:
Expansion to more global cities
Increased PRCL utility and staking incentives
Growing demand for real-world assets (RWAs) on-chain
Enhanced support for automated and AI-driven strategies
Final Thoughts
Parcl is redefining what it means to invest in real estate. By transforming local, illiquid property markets into a global, composable, and liquid asset class, Parcl enables both human and AI investors to access and trade the housing market like never before.
Whether you’re a trader looking for uncorrelated exposure, a long-term investor seeking innovation, or a technologist building AI agents — Parcl offers a compelling opportunity.
⚠️ Disclaimer: This is not financial advice. Always do your own research and make investment decisions based on your individual risk profile.

OKLO — when nuclear momentum breaks resistanceSince late 2024, OKLO had been consolidating inside a clear rectangle between $17 and $59. The breakout from this long-term range triggered a new bullish impulse. The price has since returned to retest the breakout zone, now aligned with the 0.618 Fibonacci retracement at $51.94. The retest has completed, and the price is bouncing upward, confirming buyer interest.
Technically, the trend remains firmly bullish. The price closed above the prior range, EMAs are aligned below, and the volume spike during breakout supports genuine demand. The volume profile shows a clean path toward $100, indicating limited resistance ahead. The structure suggests a controlled rally rather than an exhausted move.
Fundamentally, OKLO is a next-generation SMR (Small Modular Reactor) company focused on delivering compact, efficient nuclear power solutions. Following its public debut via SPAC and recent capital injection, OKLO is transitioning from development to implementation. Institutional interest is holding strong, and the broader move toward decarbonization and energy independence places the company in a strategic position.
Target levels:
— First target: $100 — psychological and technical resistance
— Second target: $143 — projected from prior range breakout
OKLO isn’t just another clean energy ticker — it’s a quiet disruptor with nuclear potential. The chart broke out. The volume confirmed. Now it’s time to see if the market follows through.

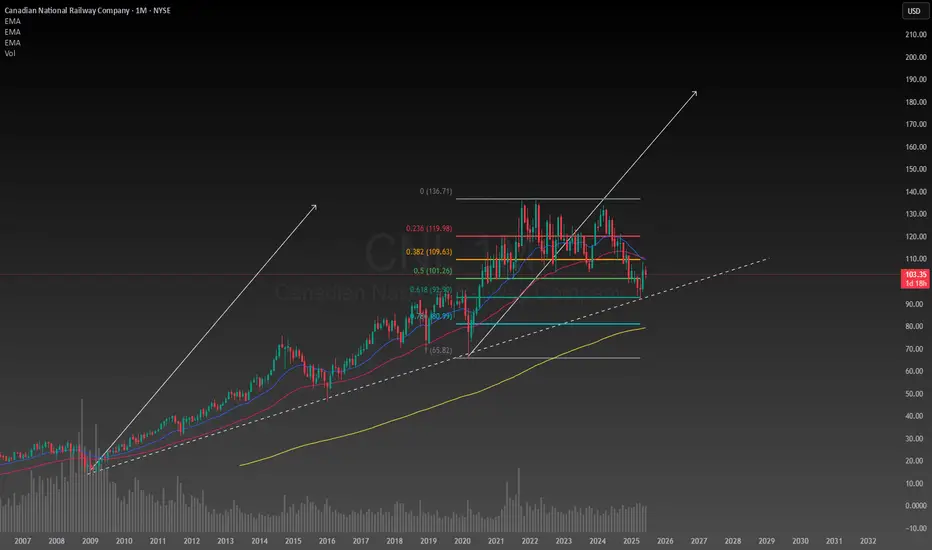
Canadian National Railway has huge upside potentialA decades old trendline still unbroken after months of correction, the Canadian economy seems to be in a great position considering the circumstances. After conducting a simple technical analysis predicting a second leg up the upside potential is enormous if I am right about this. The downside is I am looking at a monthly chart so this will need to be a position trade or long term investment to achieve the desired results. Even if my target is reached I will likely hold onto the stock for years afterwards because the company will continue to make money. The intrinsic value for CNI is between $120 and $225 so it is well below the intrinsic value making any new position on it now at a bargain deal. I will likely be allocating a significant portion of my portfolio to it in the next few days to weeks.
RELIANCE Croosed resistance, strong sentiments supporting upmove. Strong trend reversal clearly visible in weekly timeframe.

PLTR 1D — When the tea is brewed and the handle’s in placePalantir’s daily chart is shaping up a textbook cup with handle pattern — one of the most reliable continuation setups in technical analysis. The cup base was formed over several months and transitioned into a consolidation phase, building a rectangle structure where smart money likely accumulated positions before a breakout.
Now here’s the key: price has not only broken out — it’s settled above all major moving averages, including EMA 20/50/100/200 and MA 50/200. The breakout candle was supported by surging volume, signaling strong participation from institutional buyers. When all the averages start bending upwards, it's usually not by accident.
The breakout above the $121 resistance zone unlocked a pathway toward a target at $187 , derived by projecting the height of the cup upward from the breakout level. This kind of structure, once confirmed, often fuels aggressive continuation — and this one’s got the setup locked in.
From a fundamental perspective, Palantir is holding solid ground: strong earnings reports, expanding government and commercial contracts, and aggressive development in AI services. Institutional interest is rising steadily, and that momentum is visibly reflected in price action.
To sum it up: price has launched cleanly out of the consolidation zone, pierced all critical MAs and EMAs, and continues to gain momentum. While the market sips its tea, this cup is boiling hot. Just don’t forget your stop loss — this is a trading desk, not a tea party.
If you enjoy posts like this, drop a like, share it around, and let’s hear your thoughts below. It keeps ideas moving and the content flowing — free, sharp, and relevant.

NFLX gains the momentumNFLX is gaining strength.
Fundamentals: Netflix reported a 12.5% year-over-year increase in Q1 revenue, reaching $10.54 billion and surpassing expectations. Adjusted EPS rose by ~25% YoY to $6.61, coming in 16% above consensus estimates.
The company also issued bullish Q2 guidance, forecasting 15.4% revenue growth, supported by solid momentum in both subscriber growth and advertising revenue, further boosting investor confidence.
This overall situation puts NFLX in the list of momentum stocks.
From a technical standpoint, it consolidates in the widening chart formation, and may bounce off its bottom, which also corresponds to the area between 20-day moving average and lower band of the Bollinger Bands (20).

Forex Market: Myth or Strategy? — Analysis by Valtrix GroupEvery year in June, forex traders pay close attention to historical price movements, hoping to identify recurring seasonal patterns. But does June really offer a strategic edge, or is it a marketing myth and an overrated idea?
At Valtrix Group, we view seasonality as a secondary but useful filter — especially during periods of low volatility and a lack of macroeconomic catalysts.
What Does History Tell Us?
Historical data on major currency pairs (EUR/USD, USD/JPY, GBP/USD) shows that June often exhibits:
A rise in volatility in the first half of the month — driven by inflation data releases (U.S., EU);
Moderate strengthening of the U.S. dollar, particularly between the FOMC meeting and the quarterly earnings season;
In some years — flat movements caused by low liquidity ahead of the summer holiday season.
However, long-term statistics are mixed. For example, from 2013 to 2023, EUR/USD rose in June in 6 out of 10 years and declined in 4, showing no strong directional bias.
Why Seasonality Doesn’t Always Work
The forex market is driven not only by technicals and statistics but also by macroeconomics, geopolitics, and monetary policy. When major events occur in June (Fed meetings, crises, elections), seasonal patterns can easily be disrupted.
Moreover, algorithmic trading and arbitrage strategies reduce the likelihood of consistent price movements repeating year after year.

Amazon swing trade ideaAmazon has fallen below its trendline and started to dip slightly despite the fact that the broad market is going higher. I have found an opportunity for a decent long entry and have ran the numbers, the intrinsic value of Amazon right now is between $180 and $520. Not only is it a retail giant but is an emerging technology innovator and investment company. I got about 4% of my portfolio allocated to it now.

VolitionRX | VNRX | Long at $0.54***Stay away if you are risk averse (small cap with 300-400k daily volume and could go to $0).
VolitionRX AMEX:VNRX is a U.S.-based, multinational epigenetics company focused on developing blood tests for early disease detection, primarily targeting cancer and sepsis. Its Nu.Q blood tests are primarily for humans, focusing on early detection of diseases like cancer and sepsis. However, the company has also explored veterinary applications through its Nu.Q Vet product line, targeting cancer screening in animals, particularly dogs.
Recent insider purchases got my attention, with the CEO and Director each grabbing $100k worth at $0.55. Plus, many other insiders have recently been awarded options. The company is making progress in signing multiple licensing deals for their Nu.Q platform in the human market, with strong interest from large companies. Many development milestones have been made within their cancer testing program and more are likely to be announced. However, the company is unprofitable at this time, and this is a highly risky / speculative play. It may take years to unfold or be a total disaster and go to $0.00.
Rolling the dice at $0.54 with the goal to reach $0.75 and $1.00 in the coming 1-2 years. Analyst targets are in the $3.00-$3.50 range.

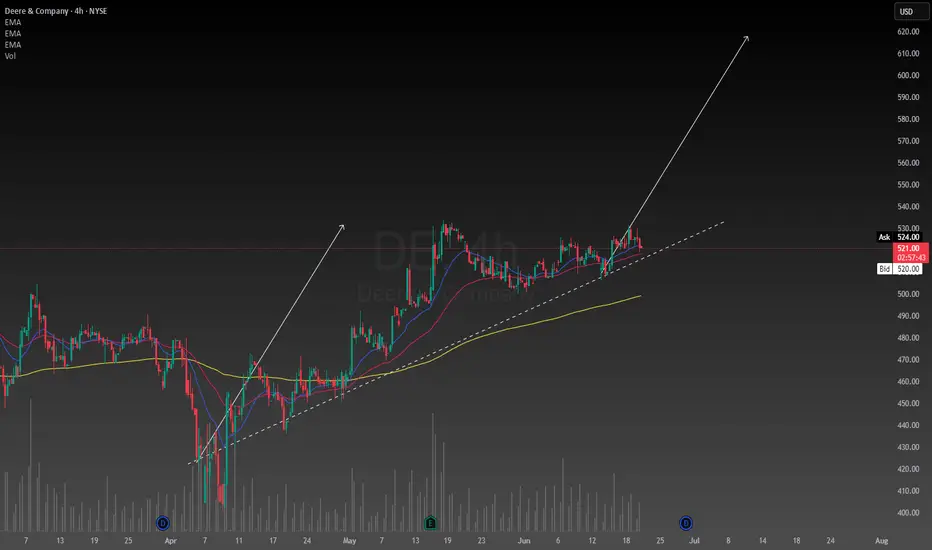
John Deere position trade setupI have been wanting an excuse to add this to my portfolio for a while now. Primarily because Bill Gates has it in his portfolio. I like to try and copy the most successful investors like Warren Buffett, Cathy Wood, Bill Gates, etc... I paid the market price today for a position with a cost average of $525. The intrinsic value of the stock is between $250 - $1050 so its not ideal to be in at $525 but I am not playing the voting game, I prefer the weighing game. I want to see how the position affects the other things I have in my portfolio and hopefully improve the performance with this stock in there. Maybe I will buy more if I can find a reason to add to the position in case it starts losing money because dividends are being paid out soon. I have drawn a simple technical analysis predicting a two legged pullback pattern.
Spotify is the most beautiful chart of the yearI made chat GPT write this because i was too lazy;
ps. (The intrinsic value for the stock right now is between $400 and $2900)
Q. Why is Spotify stock doing so good this year.
A.
1. First-ever full-year profit in 2024
Spotify swung to a €1.1 billion net profit in 2024—its first annual profit—on the back of cost-cutting, layoffs, and effective pricing. Margin improvements (gross margin hit 30–32%) and leaner operating expenses fueled this turnaround.
2. Robust user growth and pricing power
Monthly Active Users (MAUs) rose 10–12% year-over-year to roughly 675–700 million, with 263–268 million premium subscribers
Spotify has successfully raised subscription prices—and free users haven't objected, demonstrating strong loyalty and pricing resilience.
3. Diverse revenue mix
Spotify’s expanding beyond music—podcasts, audiobooks, video podcasts, and AI-powered ad tools are creating new monetization channels. Podcast ad tech and AI-enabled features like “AI Ads” and smart playlists enhance advertiser value.
4. Analyst upgrades and bullish sentiment
Pivotal Research just raised its price target to $900, praising Spotify’s dominance in audio streaming, user-friendly UI, under‑penetrated global markets, and ad business improvements. Evercore ISI and others raised targets to near $750 and reaffirmed outperform ratings. Most analysts rate SPOT a Buy.
5. Strategic partnerships & scalable economics
A renewed deal with Universal boosted confidence in Spotify’s content licensing and pipeline. Hedge fund accumulation and strong ROI (ROIC ~23%) reflect effective capital use.
6. Resilience in uncertain economies
Subscription-based services, especially freemium models, are seen as defensive in slower economies. With strong retention (“stickiness” due to loyalty and seamless experience), Spotify keeps users even with higher prices.

Bitcoin top on October 2025?To estimate the potential top date of the current Bitcoin bull market, we can analyze the timeframes of the previous two bull markets.

VST Tillers Tractors Ltd: A Compelling Case for Value InvestingIn the dynamic Indian stock market, finding such opportunities requires diligent research and a keen eye for businesses with intrinsic value. One such stock that stands out as a potential value investment is VST Tillers Tractors Ltd. (VSTTILLERS), a leading player in India’s agricultural equipment sector. Based on an analysis of its profile on Screener.in, this blog explores why VST Tillers is an attractive pick for value investors.
Understanding VST Tillers Tractors Ltd.
Founded in 1967 by the VST Group, a century-old business house in South India, VST Tillers Tractors Ltd. has established itself as a pioneer in the agricultural machinery sector. The company is the largest manufacturer of power tillers in India, holding over 70% market share, and is a significant player in the compact tractor segment under its VST SHAKTI and FIELDTRAC brands. Initially a joint venture with Mitsubishi Heavy Industries, Japan, VST Tillers is now independently operated, with the VST family holding a 51% promoter stake, signaling strong management confidence in its future. The company also exports to European, Asian, and African markets, aligning its products with stringent EU standards.
With a market capitalization of approximately ₹3,032.65 crore as of April 2025, VST Tillers operates in the automobile sector, specifically in the tractors and farm equipment industry. Its financials, operational efficiency, and strategic initiatives make it a compelling candidate for value investors seeking undervalued stocks with growth potential.
Why VST Tillers is Attractive for Value Investing
Value investing hinges on finding companies trading below their intrinsic value, with strong fundamentals, low debt, consistent dividends, and growth prospects. Here’s why VST Tillers aligns with these principles:
1. Strong Fundamentals and Financial Stability
Near Debt-Free Status: VST Tillers is virtually debt-free, a hallmark of a financially sound company. Low debt reduces financial risk and allows the company to reinvest profits into growth initiatives or reward shareholders.
Healthy Dividend Payout: The company maintains a consistent dividend payout ratio of around 19.9%, with a current dividend yield of 0.57%. This reflects a shareholder-friendly approach, providing steady income while retaining earnings for reinvestment.
Stable Promoter Holding: With a 55.6% promoter stake, there’s strong alignment between management and shareholders. The promoter holding has remained stable over recent quarters, indicating confidence in the company’s long-term prospects.
2. Undervaluation Relative to Peers
Price-to-Earnings (P/E) Ratio: VST Tillers trades at a P/E ratio of 25.05, which is reasonable for a company with its market leadership and growth prospects. Compared to peers in the automobile and tractor industry, this P/E suggests the stock may be undervalued, especially given its niche dominance in power tillers.
Market Cap and Growth Potential: With a market cap of ₹3,032.65 crore, VST Tillers is a mid-cap stock with room for growth. Its focus on expanding into higher horsepower tractors and international markets (now 13% of revenue, with a target of 25-30%) positions it for future appreciation.
3. Consistent Operational Performance
Revenue and Profitability: In FY 2022-23, VST Tillers crossed the ₹1,000 crore revenue milestone, showcasing its ability to scale. In Q2 FY 2025, the company reported a modest revenue increase driven by stable demand for power tillers, with profits at ₹105 crore. While sales growth over the past five years has been modest at 9.50%, the company’s focus on operational efficiency and cost management supports profitability.
International Expansion: The company’s export business is growing, with products like FIELDTRAC tractors meeting EU standards. International revenue now accounts for 13% of total revenue, with plans to expand into the U.S. and European markets. This diversification reduces reliance on the domestic market and enhances growth prospects.
Sales Surge: In March 2025, VST Tillers reported a 142.09% sequential increase in total sales, with power tiller sales jumping 77.81% year-on-year to 7,221 units. While tractor sales dipped slightly, the overall sales momentum reflects strong demand and operational resilience.
4. Long-Term Growth Catalysts
Product Diversification: VST Tillers is expanding its portfolio beyond power tillers to include higher horsepower tractors, power weeders, and precision components. A recent joint venture has enabled the launch of advanced tractors, strengthening its competitive position.
Distribution Network Expansion: The company is investing in its dealer network to enhance market reach, particularly in rural India, where small farm mechanization is gaining traction. This aligns with favorable agricultural conditions and government support for farm mechanization.
Sustainability and Innovation: VST Tillers’ focus on fuel-efficient, reliable products like the VST 9054 tractor (praised by farmers in Tanzania for its performance) and multi-crop reapers positions it to meet evolving farmer needs. Its brush cutters and power reapers cater to modern farming demands, ensuring relevance in a changing agricultural landscape.
5. Resilience in a Cyclical Industry
The agricultural equipment sector is cyclical, influenced by monsoons, commodity prices, and government subsidies. However, VST Tillers has demonstrated resilience through:
Market Leadership: Its 70% share in the power tiller market provides a competitive moat, insulating it from new entrants.
Stable Demand: Small and marginal farmers, who form the bulk of India’s agricultural workforce, rely on affordable, efficient equipment like power tillers, ensuring steady demand.
Strategic Execution: The company’s focus on dealer profitability and retail financing aligns with shifting consumer behavior, reducing dependence on subsidies and enhancing sales stability.
6. Risks and Considerations
While VST Tillers is a strong value investment candidate, there are challenges to consider:
Modest Sales Growth: The company’s five-year sales growth of 9.50% is relatively low, reflecting challenges in scaling the tractor segment.
Low Return on Equity (ROE): An ROE of 13.3% over the past three years is below the ideal threshold for growth companies, indicating room for improvement in capital efficiency.
Working Capital Challenges: Debtor days have increased from 40.7 to 54.1 days, and working capital days have risen from 80.4 to 173 days, suggesting potential inefficiencies in cash flow management.
Commodity Price Volatility: Rising input costs have pressured operational EBITDA, which stands at 13.33% (excluding other income). Value investors should monitor cost management strategies.
Despite these risks, VST Tillers’ strong balance sheet, market leadership, and growth initiatives mitigate concerns, making it a compelling long-term investment.
Value Investing Perspective: Why VST Tillers Stands Out
Value investors seek stocks with a margin of safety, where the market price is below the intrinsic value. VST Tillers fits this mold due to:
Undervalued Stock Price: The stock’s 52-week range (₹3,082 to ₹5,429.95) and current price of ₹3,565.95 (as of April 2025) suggest it is trading at a discount relative to its growth potential and market leadership.
Long-Term Growth Story: The company’s focus on international markets, product diversification, and rural market penetration aligns with India’s agricultural mechanization trend, offering significant upside potential.
Patience Pays Off: VST Tillers is a case study in patient investing. Its consistent growth and market dominance reward investors willing to hold for the long term.
Conclusion:
VST Tillers Tractors Ltd. embodies the principles of value investing: a fundamentally strong company with low debt, consistent dividends, and a clear growth trajectory, trading at a reasonable valuation. Its leadership in the power tiller market, strategic expansion into tractors and international markets, and resilience in a cyclical industry make it an attractive pick for investors seeking undervalued opportunities in the Indian stock market.
For value investors, VST Tillers offers a compelling mix of stability and growth. While challenges like modest sales growth and working capital inefficiencies warrant monitoring, the company’s strong fundamentals and strategic initiatives provide a solid foundation for long-term wealth creation. As with any investment, thorough due diligence is essential, but VST Tillers stands out as a hidden gem worth considering for a value-focused portfolio.
Disclaimer: This blog is for informational purposes only and not a recommendation to buy or sell securities. Always conduct your own research or consult a financial advisor before investing.

Simpel illustration of altcoin potential (30x)Connected some dots and we don't have to make it harder, the altcoin markets is picking up use cases and wit mature faster then we think, next FOMO will not only pull in corporate but the amount of people in crypto increases daily. I don't think anybody is ready for the next explosion.

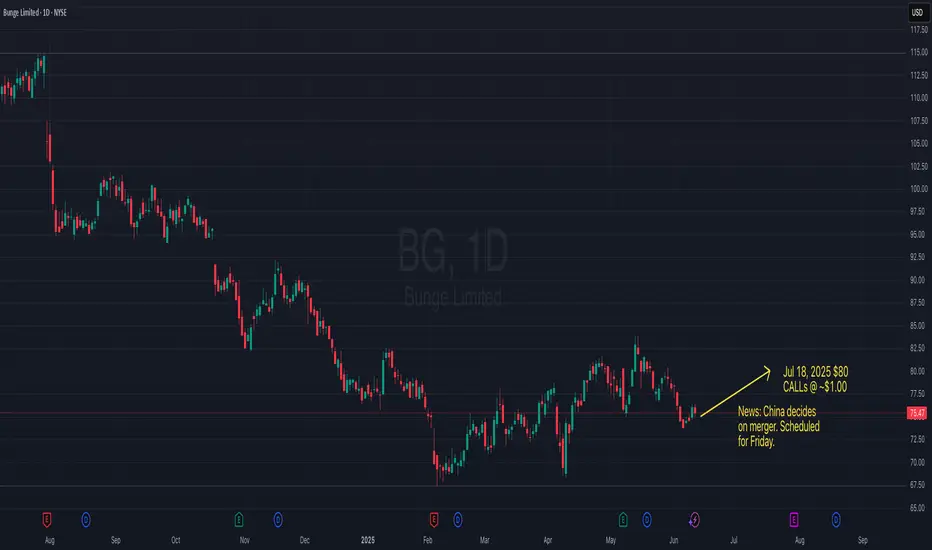
Can BG get at least to $80 on news?BG is undervalued. News from China on Friday to approve merger deal. CALLs are cheap. Can it at least get to $80? Buy the Jul 18, 2025 $80 CALLs. Best scenario is to close it as the price nears the strike, and it depends on what time the news comes out. Good luck.