MCD is topped out the long fast food trend may be SHORTMCD lives on people liking what they eat and eating a lot of it. The Happy Meal is famous.
into the business model comes the new wave biologics for obesity and diabetes. the shots
that cut down the weight and the food addiction. Insurance companies are jumping on
the bandwagon. 1/3 of the people eat half the food. Increasingly, those people are seeking
treatment. The fastfood executives know this. Same for the sugar beverages.
Anyway, enough said. MC on the monthly chart is stuck at a double top even more obvious
on a weekly or daily chart. At present it is stuck in a symmetrical triangle compressing price.
The mathematical predictive algorithm forecasts price will move down the remainder of
this year. I respect the mathematics and understand the medical trend. LLY makes money
supplying insulin and now it makes money actually reversing diabetes and obesity. One way
or another it makes money and MCD is supplying the patient flow. In the meanwhile if
those patients are detoxified and lower their caloric intake, MCD is the one that suffers
a regression of the growth story. I am short MCD and add to my position whenever
there is a little upward price movement. Yeah, comarketing donuts with Krispy is an act of
desperation.
Growth

SWIMMING with the WHALES, a dangerous move, NEXT TARGET $Whales waited, Retail traders PLUNGED, then WHALES SOLD. Know your game. Dont get maneuvered into the FEARLESS CROUD.
Whales red downtrend regression. Showing a deep analysis behind the scenes of BITCOIN. Shows who’s in, who’s out within the time as the white trend moves. Follow each zigzag and know how it all started.
Next target is kept secret: this helps keep smart money intruders from changing directions.

$HTOO: Potential Bullish Reversal - Solid News & Webcast Ticker NASDAQ:HTOO - Fusion Fuel Green PLC
We could be looking at a nice test and cross of the Ichimoku Cloud, here represented on a 1 Month chart. This price movement is also accompanied with news regarding the selection and acceptance of a 650M$ project funded by the EU, which Fusion Fuel proposed in regards to the hydrogen transition, please read in more detail below in the press release of Feb.16 2024.
There is also a Webcast for investors on March 6th, which could lead to some updates on positive revenue forecast and more details over the 650M$ project and next steps.
This company is currently valued at around 32M$, which could be undervalued if this project goes forward, IMO.
I'll be sitting long in the short to mid-term and might sell for profits at some critical levels.
Happy trading.

AVTX - a potential continuation WATCHAVTX popped on a big revenue beat on March 28th. It is now priced at about 3% of the ATH
of last July. With the massive price jump came a 15X relative volume. The question is
whether price has retraced into support and can rally again in the next market session.
This remains to be seen. i will put AVTX on the top of my watch list and take a long trade
if I see signs of continuation with volume supporting the move.

What is ValuePlusGrowth InvestingINDEX:KLSE -INFOTEC
ValuePlusGrowth Investing is all about looking into what are the Rational Drivers of EPS, DPS and P/E, and how to evaluate and valuate the Rational Drivers to outline the rational range of present intrinsic values and of futures.

INFOLINE TEC GROUP@KLSE : OCROICₘₒ𝒹 based ValuationINFOLINE TEC GROUP@KLSE
OCROICₘₒ𝒹 based Valuation
OCROICₘₒ𝒹
= 100×(6,325+(7,419+29,115+2,105)-(1,836+6,312+3,312+5,216))÷(58,317+4,879+407+107+(7,419+29,115+2,105)-(1,836+6,312+3,312+5,216))
= 33.0185706115
OCPS
= (6,325+(7,419+29,115+2,105)-(1,836+6,312+3,312+5,216))÷363,229
= RM 0.0778792442
OCROICₘₒ𝒹 based Intrinsic Value (min) with 3.5% inflation rate
= RM 0.0778792442×(1-(1÷1.035)^33.0185706115)÷(1-(1÷1.035))
= RM 1.5634207107
OCROICₘₒ𝒹 based Intrinsic Value (max)
= RM 33.0185706115×0.0778792442
= RM 2.5714613246

INFOTEC@KLSE ROA based Intrinsic ValueINFOTEC@KLSE
PE(ROA) based Intrinsic Value FYE 2023
= 24.159785146×0.0529996228
= RM 1.2804595003

EL jumps on analyst upgrade LONGEL like ULTA was beaten down in covid times. It jumped in 2021 and fell in 2022 and 2023.
2024 might be the year they thrive again. On the weekly chart, EL is back to the support of
its levels of 2018. With an analyst upgrade coming from Bank of America it is now getting a
bit of attention. Trend strength and relative strength were down. I see this as a good entry
for a new long position in EL while also looking at ULTA. Targets are the fib zone and a
correction / consolidation area on the downtrend so 200 and 250. Now is the time to invest
in female beauty.....

CMG to split price SHORTCMG has announced a split. Makes sense to make shares more affordable but fractionals are
widely available. CMG may be fundamentally challenged by the underpinnings of the fast food
markets. that is overeating and rising prices. In the meanwhile the anti-obesity and anti-
diabetes trends are pushing hard led by the bological injectable meds from LLY, NVO and
others. One third of the people eat one half of the food and now an effective treatment
for that addiction is becoming increasingly available. The writing is on the wall and food biz
executives can read that writing. Enough said.
I am going short on CMG. It's best days of growth may behind it. The company announced plans
for 4000 more stores nationwide. Really? Time will tell. I vote with my wallet. My position
will not be small. The predictive algo has its forecast. My education included both medicine
and engineering. I understand the power of biology and mathematics. I deeply respect
both.

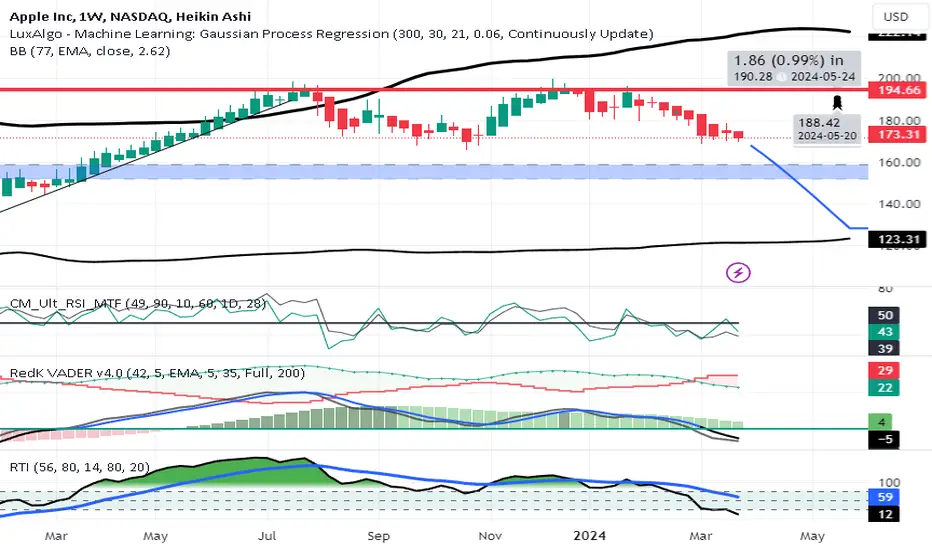
AAPL on a wide view continues SHORTAAPL on the weekly continues to fall from a double top put in at 195 in July 23 and this past
January. China issues are looming with competition domestically within China, factory issues
and the recession. The hart shows an established trend down seeking support at the Fibonacci
level in blue. The predictive algo looking back an the regression line pattern forecasts a
continued fall through the fib zone into the 125 area. Indicators are all consistent with the
same. I have a deep respect for advanced mathematics and will comply with the forecast.
AAPL is a short and the little retrace up is an opportunity to add to my positions.
LCTX gets upgrade and is technically setup LONGLCTX on the weekly chart here has been falling since late 2021 and found support at the bottom
of the high volume area of the volume profile and ranged between it and the POC line for the
past 18 months. The is a high end clinically active biotechnology firm using stem cells to
produce therapeutic cell lines . ( One experiment using the mammary glands of cows imbedded
with cells that make insulin to make a weak milk solution containing insulin and then
concentrate it for cheap insulin is quite remarkable- ) How about some special milk for
to have with your sugar buzz) see more in the here link en.wikipedia.org
Anyway, price rose into triple confluence- the anchored mean VWAP, the POC line, the upper
boundary of the high volume area. A new analysis targets 7. Smart money is paying attention.
My smart money is paying a lot of attention. I understand the science and the market that
LCTX could reach in due time. I am not an insider but close. Enough said. My target is the
tweezer tops of 2022 at 2.5 and so 65-70% upside in the near to intermediate term and after
that maybe the analysis will revise the target up or down I am guessing the former.

INFOTEC@KLSE Integrated ROA, Wacc, NCAVPS based valuationINFOTEC@KLSE
Integrated ROA, Wacc, NCAVPS based valuation:
(100×19,251÷79,682-12)×(58,412-21,365)÷363,229
= RM 1.2402191463

INFOLINE TEC GROUP Unconventional GPA Based Valuation INFOLINE TEC GROUP
Unconventional GPA Based Valuation @ FYE 2023
100×37,753÷79,682×(0.053-0.0232)
= RM 1.4119115986

RH appears ready to rise from its base LONGRestoration Hardware on the weekly chart rose from COVID and then retraced for almost
two years. It appears now ready to experience some investor and trader interest once again.
It is rising from the POC line of its long term volume profile. The trend strength indicator just
inflected and curled upward. I like to catch trends early to get as much of a move as
possible and before the chasing begins. This is a possible megacap short squeeze set up.
Targets are 380 and 480 as horizontal levels of importance.

Introducing Nvidia's Next Generation AI Hardware and Software OfNvidia has officially introduced its next generation AI hardware and software offering, setting a new standard in the industry. With cutting-edge technology and innovative solutions, Nvidia is paving the way for the future of artificial intelligence.
This new offering promises to revolutionize the way we approach AI, providing faster, more efficient, and more powerful solutions than ever before. With Nvidia's state-of-the-art hardware and software, traders can expect increased performance, improved accuracy, and enhanced capabilities to stay ahead in the market.
Now is the time to invest in Nvidia and take advantage of this groundbreaking technology. Don't miss out on the opportunity to be a part of the future of AI. Join us in long Nvidia today and be a part of the next generation of innovation.

GIS weekly Cup formation progress LONGGIS a consumer staples is set up long and is a good defensive play for recession or black swan
events. The idea is on the chart. I am long since the first of the year. Adding for small dips
on the daily or 180 minute chart. Food is about as basic as it gets. GIS is a market leader.
TSN idea also. What about McDonalds?

STRO a biotech startup flips into positive earnings LONGSTRO on a 240 minute chart got trader interest out of earnings that were projected to be net
cash outflow into reported actual earnings. This is a remarkable turnaround. The RSI lines
surged. The predictive algorithm which relies on a lookback of the regression line for analysis
toward the future forecasts a move up much higher. I will take a long trade here seeking 50-60%
in a month although the forecast is for a doubling.

NKLA can this EV penny stock stop the cash burn/ News LONGNKLA on the 120 minute chart has been in a falling wedge pattern and had the news of
hydrogen stations ready to go in the all important California market and now printed a
countertrend breakout over the wedge. Can Nikola stop the cash burn? Can it prevent further
shareholder dilution? Is the board protecting the interests of shareholders ? While this gets
figured out can price rise to the anchored mean VWAP and put in a 10% jump in the short term?
I intend to find out.

An Optimistic But Volatile Future Ahead For EthereumHi everyone, I should preface and say I am a relatively new ETH investor. I was primarily a strict BTC maxi since 2017, but after putting in the time last year to learn about ETH and what its core philosophy is, I understand it better and I am actually very interested in what it is capable of! I think many of the ETH community can vouch for that. It's hip, cool, and experimental. I honestly think there are many BTC maxis that refuse to accept this is fundamentally a different project than BTC was- not just technologically. For those not involved in crypto- or are just average retail investors, ETH may just seem like a 2nd coin behind BTC that does all the same stuff "basically". That was just me being naïve and stupid, and I unironically thought like this for years.
I love the fact that the ETH community rallies behind it so hard. They are a very different group than many of the BTC investors I follow and have followed in the past. They seem to have a really strong core and tight knit community that do not care much about what 3rd party entities will tell them what to do or who to be. The developers (mostly) all seem incredibly passionate and want to really create practical and also experimental projects. I think mentioning this context is essential in my TA because ETH investors fundamentally believe in the core project so much that I think they will successfully create some type of "mainstream" adoption within the next 10 years. I have no clue how that will look like- and I don't think anyone does yet. But the ETH community has a strong spirit that I do not see breaking- ESPECIALLY with Larry FInk and BlackRock still in the equation. They just partnered with Securitize and are going to slowly begin to execute their "tokenization" of assets. This leads into the biggest news of the year for Ethereum, the ETF.
As much as I want this ETF to pass on May 23rd, it will not. I don't know how it will go down, but this will be prolonged somehow. And I do not see the market reacting lightly to the news for the mid term (basically all summer). Gary Gensler really does not seem comfortable even speaking about ETH any time he is being recorded. The SEC is currently asking for more funding to lawyer up against the potential future court cases that WILL happen when the ETF gets denied. The SEC seem incredibly nervous about opening up a door that can't be shut- if the ETH ETF gets approved, I can only imagine how many other chains will want to have their own ETF... No matter what you think of other coins, it seems like the SEC and Gary really do not like crypto all that much and are only really willing to let BTC slide. I think they want congress to eventually enact real legislation against cryptocurrency as a whole in the future.
I think something will happen in between May 23rd and August 7th, the day BlackRock's ETF filing expires- but I'm not sure what exactly. I think the most likely case is they go to court and the SEC loses in court. Maybe the ETF gets approved with an amendment that there can be no staking the ETF? Do people even care about this? (sorry if so) The best current argument seems to be that there exists ETH Futures ETF, so why would an ETH ETF be an issue? And then by August 7th, the BlackRock ETF should be approved and Ethereum is going to launch. My gut tells me it goes for the 10k push into the end of the year, and then we consolidate early 2025 with a final blowoff maybe middle of 2025. Who knows after that, prob bear/crab market until next halving like close to 2028-2029 or around there.
Very exciting times ahead! Personally I'm incredibly nervous with my investment in ETH. I'm still a BTC maxi to the core because it really is just the best sound money to ever exist. I really consider it my true savings account at this point. But ETH is my risk bet. I fully trust in that ETHBTC ratio and have watched that thing for years- despite never having any interest in purchasing Ethereum. I've also gotten burned in the past- having bought LTC at its peak in 2017 and holding still to this day... I have no more faith in that project honestly. I don't want this to happen to ETH, and I can say that I really do believe in its community. I hope the developers and companies out there innovate some really cool things that make our lives better/easier. But I do see ETH really as a long term investment, whereas BTC at this point for me is essentially just savings that I am not getting rid of anyways.
Cheers everyone, I think no matter what, that if you own ETH and you hold, you will win in the long run. Good luck to the traders too!!

INFOLINE TEC GROUP: Unconventional Intrinsic ValueINFOTEC
Unconventional Methodologies Based Intrinsic Value
Low
= 0.053×(1-(1÷1.035)^35.67)÷(1-(1÷1.035))
= RM 1.11
Middle
= 35.67×0.0232×(2-0.0232÷0.053)
= RM 1.29
High 1
= 35.67×0.053
= RM 1.89
High 2
= 0.1605516079×0.3567×35.67
= RM 2.04

BCAB post earnings is set up LONGBCAB a medical technology penny stock had a good beat on earnings. This means the cash
burn was only 70% of what was expected. On the strength of that traders reached. The
indicators suggest more upside including RSI lines crossing over the 50 level and the MACD
lines bouncing up on the approach to the zero horizontal line. The supply and demand curves
crossed. The Luxalgo predictive algorithm doing a pattern lookback analysis has a trend up.
I will take a long trade here attempting to get a good piece of the move for realized profit.

Twin Compoundings INDEX:KLSE -INFOTEC
Dividend declaration has proposed two possible outcomes.
1. Trade receivables received from customers are inflating the free cash flow and retained earnings.
2. Higher revenues and profits are foreseen with orders from Malaysia, India and perhaps China as the economy is improving in the said countries, not to leave out Singapore and Japan markets.
3. Dividend (DPS) compounding kicking off denotes the Profit (EPS) Growth sustainability.
4. Profit (EPS) Growth is the driver of intrinsic value compounding which will kick off the investors' capital compounding sooner or later.
Infoline Tec Group is a 5 stars stock in light capital business model which Warren Buffett has advocated to retailers to invest in for capital compounding + dividend compounding.

Ripple is Potentially UP-TrendHi All,
Ripple has indeed encountered legal hurdles previously, but it’s noteworthy that the SEC has lost 4 out of the 5 cases it initiated. Furthermore, Ripple’s token, XRP, has been embraced by several global banks, including Santander and others in the USA, Thailand, Mexico, Emirates and .... who have incorporated it into their payment protocols.
Despite the SEC’s efforts to hinder the growth of this token, market indicators suggest that it’s potentially on the brink of a significant upward trend. The chart big triangle patterns seem to indicate a strong bullish momentum for this token.
What do you think?
Good luck! 🎯
Armin-Academy
