Lemonade, Inc. Showing Momentum - Lets Make Lemonade!Hey, everyone. Wanted to get a video out since it has been awhile. Sorry about the rustling in the audio - bear with me as it is not a theme throughout.
I am pretty excited about the momentum that NYSE:LMND is showing. I've been in it with a position for a little bit lately, and was fortunate to catch the previous pump with profit, but I think the momentum has a strong chance to continue here.
I pretty much cover all my thoughts behind the idea in the video, so feel free to scroll through it at your own rate. I will post it as a chart idea as well so that you can hit the play button and track how the idea is actively performing.
Hope you all were able to whether the tariff tantrum and hoping the market can maintain its current positioning, or, better yet, show continued strength.
Enjoy,
Reagen
Growth

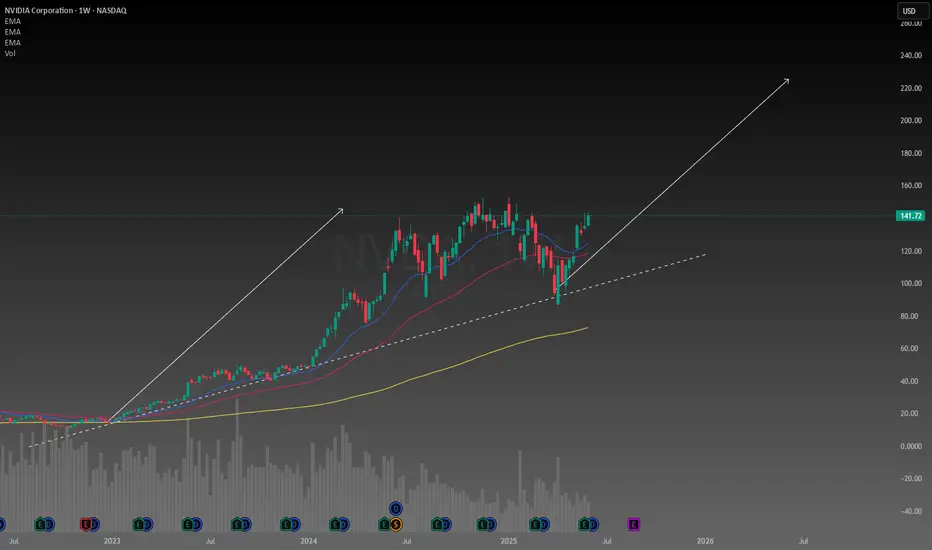
Nvidia could be worth $220 by this time next yearThe amount of money this company is making is insane and it doesn't look like its going to slow down any time soon. There is strong demand for Nvidia products universally there is no limit to how far this thing will go. Over the past 5 years it has outperformed Bitcoin, need I say more?
I am abit late to be buying into the rally but I will keep accumulating should the market provide me with ample opportunities. I think this is a fantastic growth stock for a diversified portfolio and I think Nvidia is one of the top dogs of todays economic eco system.
Despite the fact it looks expensive the stock is actually still under valued. The range of the intrinsic value is between $110 - $240. I do not recommend going all in FOMO but this thing is going up, I have done some research and it is a fantastic company to work for everyone says they love working there and they pay their employees well.
They continue to innovate and pave the way forward for semi conductor tech. I love my Nvidia chip in my laptop I can only imagine what the more expensive chips are capable of. Nvidia and Broadcom make up about 15% of my portfolio. Thank you for reading my article and please comment if you want to talk about stocks. Have a great day.
Simple Coca Cola daily chart analysisCoca Cola, my favorite defensive stock seems to be at a price decision in time. I have found a single trend line that looks reasonable. There seems to be a lot of congestion in price over the last few days this leads me to believe a breakout is coming soon. 25% of my portfolio is Coca Cola, it pays great dividends and I love the history of the company. It is a solid choice for these economically uncertain times, I think they do soda better than anyone else I been drinking Coca Cola as long as I can remember its still my favorite.
I believe its possible to see a retracement down to cheaper prices but I also don't believe in waiting for such occurrences to happen so I have already been accumulating for the last few weeks. The range of the intrinsic value of Coca Cola is between $50 - $180. My prediction for the price is that it will go up over the next 12 months. Thank you for reading my article and best wishes, cheers.

Waste Management price predictionFundamentally WM stock is proven to be resistant to recession. I have a position on the stock as a hedge against uncertainty it makes up about 15% of my portfolio as of this writing. I am looking to buy more at lower prices since I bought at a premium a couple weeks ago. I will try and hold indefinitely as the other growth stocks I have chosen continue to grow I don't expect much from this boring stock but it makes me feel better to have it in my portfolio than it does not to. The range of the intrinsic value is between $170 - $620.

Bitcoin price prediction for the next 12 monthsMy simple analysis of Bitcoin, please don't hesitate to comment your feedback. Of course this is just drawings on a chart so don't take it too seriously. Hope everyone is having fun with Bitcoin it used to be harder to find assets like this but fintech has made it easier to build wealth.

Why is HOOD still 1/3rd of SCHW? Wealth management remains the last bastion of success for Charles Schwab. Long-term cash, mutual fund, and retirement accounts create an enormous balance sheet, which accures value and reduces fees across the board. I'm hard pressed to see however how NASDAQ:HOOD will not inherit that class of customers as baby boomers pass on their generational wealth to the millenial generation. Do we begin to see a transition of assets from megacaps like NYSE:SCHW in the next 24 - 36 months? I'd say most likely.

Revenue growth nine consecutive quarters Ouster’s global partner network spans over 50 countries, supporting approximately 600 customers with applications in autonomous vehicles, robotics, drones, mapping, defense, and smart cities. Ouster has been getting lots of attention lately 230k 20 call 1/16/26 I'm wondering if someone knows there's an announcement coming this year that will get them ABOVE $20. Great growth stock huge partners here are some notable ones.
Anduril Industries: weapons/defense tech *
Komatsu: construction mining *
Vecna Robotics: warehouses
NVDIA: integration/traffic ***
Forterra, Textron, Field AI, and U.S. Army: vehicles
Google Maps, Apple Maps, Oshkosh Defense, John Deere: sensory
Amazon Robotics: Ouster’s LiDAR sensors are reportedly used in Amazon’s Proteus robots, described as part of a significant order, though not officially published. ***
Right at monthly resistance now 15$ is a strong resistance. Any pull back to $10 ish would make great buying opportunity I'm long from earlier this week July 14C / 16C Aug 17C looking to add BUT I'm also trading these the daily RSI is at 75 nearing overbought, weekly has room to run at 64 monthly is at 50 which it could reject momentarily from. Either way great company to DCA shares still under 1B market cap!

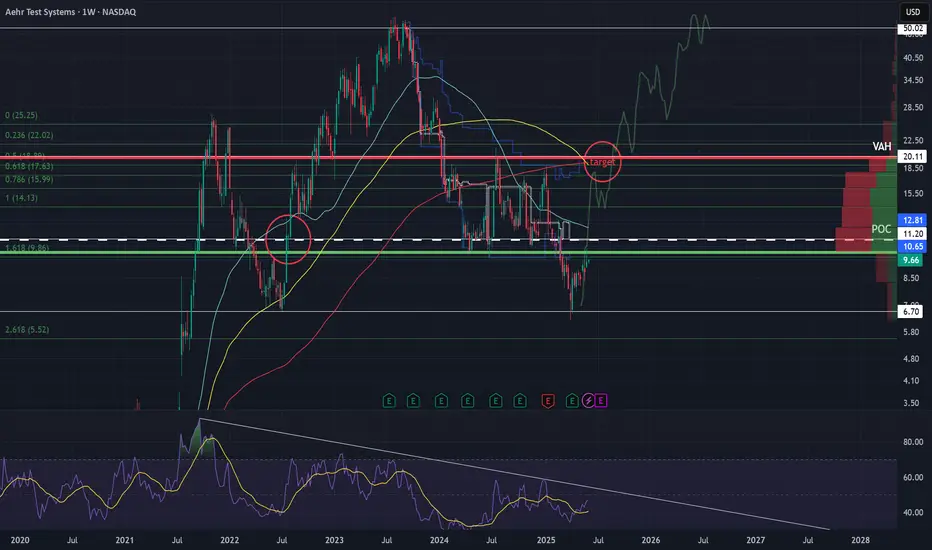
100% run up into earningsChance to get hot with semis if SPX can claim above 5950
High $8 for buying until we lose the 50MA.
Break above 12 with strength/volume will be key for continuation to 20.
Price-To-Earnings ratio (12.6x) is below the US market (17.8x) *
Revenue is forecast to grow 17.78% per year *
Earnings grew by 47.8% over the past year *
Short Interest 6.94M
Short Previous Month 7.16M
Short % of Shares Out 23.30%
Short % of Float 26.13%
Short Ratio (days to cover) 17.67
they will have tariff issues, so guidance is likely to bring uncertainties
Sazgar - Waiting for BudgetSazgar produced excillent performance in both 3rd quarter and 9MFY2025 with PAT of 104% and 186% YoY, respectively.
Technically its looks down at 1144 - 1150 support level.
Budget is the main obstacle.
The government is planning to increase the age limit for importing used vehicles from 3 years to 5 years. If implemented, this could negatively impact volumes of local automobile anufacturers.
The FBR has proposed an increase in withholding tax (WHT) on vehicles with engine capacities above 1,300cc. This would be negative for the local players.
Fundamentally, the light vehicles' manufacturers may face difficulties after budget, being the above, materalized.
Sazgar is excillent company but those external factors are not permitting the buy call.
I am still bullish and will buy more purely on technical basis to recover my losses.

$BTC 12-Week Lead Correlation w/ Global Liquidity, M2, GOLD, DXYHere’s a look at Bitcoin's price action against Global Liquidity, Global M2, GOLD and DXY - all with a 12-Week Lead.
Notice GOLD has a bit more of a deviation from the BTC price than the others.
This is because GOLD is used as a store of value asset, whereas the others are predicated on Central Banks expanding and contracting their money supply and balance sheets.
The key here is to smooth out the signal and ignore the noise.
Notice the convergence between these metrics the past couple months.

POLESTAR (PSNY) - LONGTERM BUYING OPPORTUNITY, RISK:REWARD 1:10Polestar (PSNY) has been in a long term downtrend since its launch on the NASDAQ, the EV sector has seen some excitement however adoption to EV vehicles has been a slow trend worldwide compared to the hype when first introduced. At current, EV sector participants are in the beginning phases of mass adoption and battery and charger technology is seeing some much needed advancement before mass adoption can take place, many barriers exist in real world infrastructure and this technology will take many years to advance. The promise of autonomous self driving will ultimately catapult these EV companies to new heights financially, however the timing is not right just yet. Once AI advances enough to power ASD, rob taxis and self driving will be a common sight around the world starting in smaller cities and eventually becoming advanced enough to power more of the vehicles worldwide. Polestar's all time low trading price is at $.60 cents and currently sits right above $1.00 per share. Any price between $.60 cents and its current price would be a good 1:10 risk reward investment with downside very limited to potential upside gains to $10 and potentially higher in the long term future. If the EV and AI fulfill its promise, the investment should pay off in the long term.
Disclaimer: With any investment advice especially those where you plan to invest your hard earned money, do your own research before taking any financial advice to understand your exposure and risk tolerance, analyze the utilization of any broker(s) or investment vehicle(s) to understand how your funds are stored or utilized within the platform and always have a plan and strategy prior to entering any market.

TMGH's Current Peak ZoneTMG Holding trend has reached its peak zone at the resistance line 55.661. Historically, it is expected to rebound to the support line at 55.2, then the support line at 54.987 and 54.916. In conclusion, it increased by 0.09% due to TMGH signing a memorandum of understanding to develop a new large-scale mixed-use project on a 14 million sqm plot, as part of its regional expansion strategy focused on replicating its integrated city model in Middle Eastern markets, as per a disclosure, regarding negotiations with local Iraqi authorities, is expected to include approximately 46,000 mixed-use units. It will focus on high-quality housing, smart infrastructure, and sustainability.

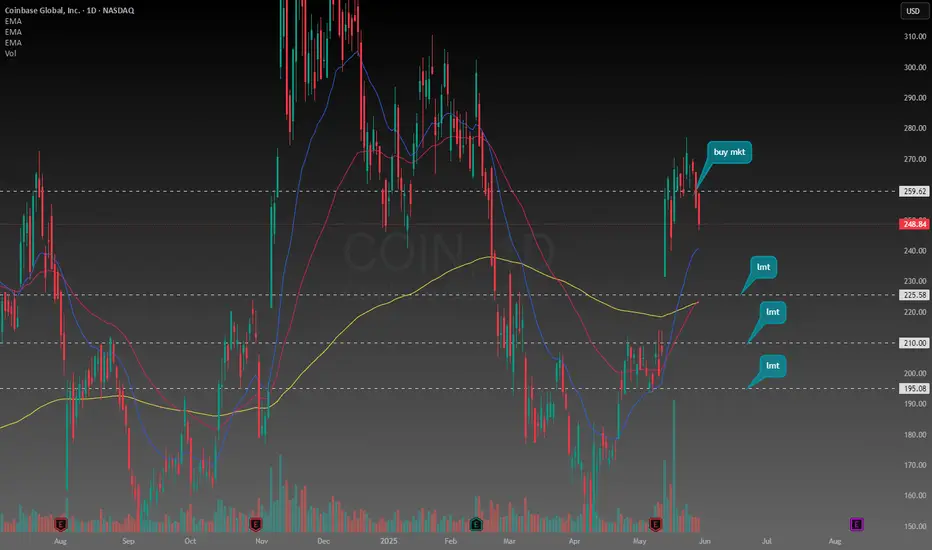
Coinbase is an excellent instrument for exposure to cryptoTrading at roughly 2x the price of Bitcoin, Coinbase presents a unique opportunity for exposure to the crypto sector. Fundamentally it is better to invest money for the long term on a business that generates revenue. I am very bullish on crypto, but with limited funds I want to make sure I deploy my capital as intelligently as possible.
There is several interesting strategies Coinbase uses to generate revenue based on crypto and blockchain processes and capabilities. From being able to exchange currencies like traditional currency systems for payments or money transfers. Mining proof of work assets like Bitcoin have used far too much resources to not be considered "valuable, and scarce". Proof of stake where staking rewards payout better than most dividends. Recent institutional adoption by some of the most significant entities. Coinbase has a portfolio of most of the crypto currencies so it guarantees a diverse exposure to the sector.
Its very obvious the people are loving crypto currencies, I want to be exposed to crypto but also want to invest in the fundamentals of generating revenues. Coinbase is the perfect vehicle in my opinion for exposure to crypto they generate revenues based on commissions and spreads, I'm sure they have some other strategies they use to consistently generate income even if crypto is going down, so that makes me even more convicted in my decision to put my money on Coinbase stock. Only being listed on the Nasdaq for four years I believe we are in for a wild ride to the upside so long as Bitcoin and the crypto market as a whole continue with this volatile momentum.
US DOLLAR FORECAST (update)Update of stalking bullish behavior in the USD instrument.
Intermarket confluence has aligned instruments such as Gold & US Stocks are soft to Bearish, I focus on XAUUSD and US30 outside of Oil to gauge validity of idea.
Thus said focus is on the 5 min chart, we seek rejections framed from 30 min area of interests.
Trigger should be after 5m Bullish playbook, manipulation is a sign of a healthy "auction".

What is Happening to Puma?Puma's stock has experienced a significant decline, dropping nearly 50% year-to-date and reaching its lowest levels in almost a decade . This downturn is attributed to several factors, including underwhelming financial performance, escalating competition, and macroeconomic challenges.
Financial Performance:
In 2024, Puma reported a 4.4% currency-adjusted increase in sales, totaling €8.82 billion . However, profitability did not keep pace; net income declined by 7.5% to €282 million, and EBIT remained flat at €622 million, falling short of analyst expectations . The company's P/E ratio stands at 17, which some analysts consider high given the current earnings yield of 2.8% .
Debt and Balance Sheet:
Puma's financial health shows a debt-to-equity ratio of approximately 48.2%, with total debt at €1.3 billion and shareholder equity at €2.7 billion . While the company has a solid capital base, increased interest payments have impacted income .
Competitive Landscape:
Puma faces intense competition from industry giants like Nike and Adidas. Nike holds a significant market share, while Adidas has recently increased its share to 8.9% . Puma's market share stands at approximately 4.94% . The company's efforts to boost sales through new product lines, such as the Speedcat trainers, have yet to yield significant results .
Macroeconomic Challenges:
Global economic factors have also played a role in Puma's struggles. Trade disputes and currency volatility have negatively impacted sales, particularly in key markets like the U.S. and China . Additionally, new U.S. tariffs on imports from China, where Puma sources 28% of its products, have created further uncertainty.
Strategic Response:
In response to these challenges, Puma has announced plans to cut 500 corporate positions globally by the end of the second quarter of 2025 to reduce costs . The company has also appointed former Adidas executive Arthur Hoeld as its new CEO, effective July 1, 2025, aiming to revitalize its performance .
In summary, Puma's recent stock decline reflects a combination of internal financial challenges and external market pressures. While the company is taking steps to address these issues, including leadership changes and cost-cutting measures, it remains to be seen how effectively Puma can navigate the competitive and economic landscape moving forward.
- *Disclaimer: This is just my personal opinion and not financial advice. I am not a professional financial advisor. Please do your own research before making any investment decisions. Any losses incurred are solely at your own risk.The figures that i found might not all be correct, as I do sometimes make mistakes, so do your own due diligence.*

Unity Software (U) – Strong Earnings and Bullish FlowsFundamental Overview
Unity Software has been consolidating within a defined range for approximately a year following a significant decline in its stock price. Despite previous challenges, the company has consistently surprised investors with its earnings over the past year, maintaining strong performance. Historically, Unity tends to perform well during the May–June period. Looking ahead, projections suggest a decline in net margin, though net income is expected to increase, reinforcing the company's strong execution.
Additionally, Unity has exceeded expectations for four consecutive earnings reports, underscoring its resilience and growth trajectory.
Technical Outlook
- Momentum & Price Action: The stock exhibits solid momentum and is currently situated in a buy zone.
- Options Flow: Bullish sentiment is evident in options activity, signaling strong institutional interest.
- Analyst Ratings:
- Needham analyst Bernie McTernan maintains a Buy rating but lowers the price target from $33 to $30.
- Barclays analyst Ross Sandler maintains an Equal-Weight rating and lowers the price target from $26 to $25.
Given the current trends, bullish options flows, and favorable seasonality, Unity Software appears poised to test $25 in the upcoming weeks, particularly if momentum continues to drive price action.

The Great Erosion: Why I Hedge With BitcoinBy Coach Miranda Miner
Look at this chart. It doesn’t scream. It doesn’t panic. It simply tells the truth.
Over the past decade, major fiat currencies have quietly lost their purchasing power. The Chinese Yuan has been debased by 61%, the US Dollar by 46%, the Euro by 38%, the British Pound by 34%, and even the Japanese Yen, often praised for its stability, has fallen 29%. And yet, central banks speak as if things are under control.
They tell us inflation is “transitory.” They say rate hikes are temporary. They promise normalization. But as we’ve seen, normalization often means sacrificing the value of your hard-earned money.
This is not a conspiracy. This is macroeconomic policy at work.
The Reality Behind Currency Debasement
Since the global financial crisis of 2008, central banks like the Federal Reserve (the Fed) have resorted to unprecedented monetary policy tools—quantitative easing, low interest rates, and now liquidity injections whenever markets tremble. The Fed’s balance sheet ballooned from under $1 trillion pre-crisis to nearly $9 trillion at its peak.
Each time the Fed prints more dollars to buy assets and prop up markets, the money supply increases. When this happens without a corresponding increase in goods and services, what do you get? Inflation.
And when inflation accelerates beyond control, currency debasement follows. Your dollars buy less. Your savings silently shrink.
It’s not just the Fed. The European Central Bank, Bank of England, and People’s Bank of China have followed similar paths. Governments and their central banks are running deficits and solving them by diluting the very currency people save in.
Don’t Just Trust Banks—Understand Incentives
Let me ask you a simple question: Do you think your bank cares more about your financial freedom, or about their own bottom line?
Look at the recent collapses: Silicon Valley Bank, Credit Suisse, and Signature Bank. We were told the system was stable. Then it cracked—overnight.
Even NYSE:JPM , NYSE:BAC , and NYSE:WFC —the biggest banks—are still at the mercy of regulatory changes, interest rate whiplashes, and geopolitical shocks. Don’t forget: banks are leveraged institutions. They lend more than they own.
Meanwhile, you earn 1-2% on your savings while inflation eats away 6-8% per year. That’s a guaranteed loss.
The Bitcoin Hedge: Scarcity in a World of Printing
Now compare that with Bitcoin ( CRYPTOCAP:BTC ).
Bitcoin has a fixed supply: 21 million coins, ever. No Fed. No central authority. No backroom stimulus deal. Its supply is encoded and transparent. Every four years, the Bitcoin halving cuts the rate of new issuance, making BTC more scarce over time.
In April 2024, we witnessed the most recent halving. The mining reward dropped from 6.25 to 3.125 BTC per block. In economic terms, the supply shock began fueling upward price pressure—exactly as it did in 2012, 2016, and 2020.
Meanwhile, institutional demand surged. After the SEC approved spot Bitcoin ETFs in January 2024, trillions of dollars were unlocked. Funds like BlackRock’s IBIT, Fidelity’s FBTC, and ARK Invest’s ARKB have been aggressively accumulating Bitcoin.
In fact, by January 2025, ETFs acquired 51,500 BTC in a single week. During that same period, only 13,850 BTC were mined. That’s a 3.7x supply squeeze.
Let that sink in.
Bitcoin is the Antithesis of Fiat
Bitcoin is not a gamble. It is insurance against the failure of the fiat system.
For traders like us, it’s a strategic asset. For long-term investors, it’s a savings technology. For people in unstable economies—think Argentina, Lebanon, Turkey—Bitcoin is freedom.
Even in the Philippines, I see it. OFWs sending money home are starting to learn about Bitcoin on the Lightning Network, bypassing remittance fees from NYSE:WU or $ML.
As Coach Miranda Miner, I always teach: Discipline. Risk Management. Malasakit.
This is not about being anti-bank. This is about being pro-freedom.
Retail and Institutional Alignment
For the first time, retail traders and Wall Street giants are eyeing the same asset. That alignment is rare.
NASDAQ:TSLA holds over 10,000 BTC.
NASDAQ:MSTR (MicroStrategy) holds more than 300,000 BTC and continues to raise capital just to buy more.
El Salvador, a sovereign nation, now holds Bitcoin in a strategic reserve. Their president even uses geothermal volcano energy to mine BTC sustainably.
This is no longer fringe. This is mainstream adoption in motion.
But What About Volatility?
Yes, Bitcoin is volatile. That’s true. But let’s flip the script.
If something is volatile but trending upward in the long run—like Bitcoin—doesn’t it make sense to accumulate wisely?
Versus keeping wealth in a stable asset—like fiat—that consistently loses value. That’s slow bleeding. It’s not volatility. It’s erosion.
A Strategic Framework for 2025
Here’s what I advise fellow traders and investors:
Hedge your fiat exposure. Don’t keep all your assets in cash or peso.
Use dollar-cost averaging ( GETTEX:DCA ) to buy CRYPTOCAP:BTC regularly.
Allocate responsibly. You don’t need to go all-in. Even 5–10% exposure can protect your portfolio.
Track macro events. Monitor Fed rate decisions, CPI prints, and ETF flows.
Avoid hype. Study fundamentals. Bitcoin rewards research, not impulse.
The Takeaway
The currencies we grew up trusting have quietly betrayed us.
This isn’t fear-mongering. This is risk awareness.
If you believe in working hard, you should also believe in protecting that hard work. And Bitcoin offers that shield—not because it’s perfect, but because it’s mathematically incorruptible.
You owe it to yourself to understand the shift happening before your eyes.
So yes, I hedge with $BTC. Because in a world of ever-weakening paper, digital scarcity is power.
—Coach Miranda MinerCEO, Global Miranda Miner GroupDiscipline. Risk Management. Malasakit.

HAE (Very bullish)
I see a big oppertunity in this stock.
The cash per - employ is risen to a very high level.
The stock has positive earnings.
Stock has some momentum.

DCA into $FI- NYSE:FI is big recognizable brand in Point of Sales. You might have seen clover handheld machines.
- I believe fundamentals on this blue chip company is getting cheap. I'm not going all in but have started DCA into this name.
- If it falls further 20-30 or even 40% I will be happy to DCA further.
- Fundamentally, I am buying it close to fair value.
Year | 2025 | 2026 | 2027 | 2028
EPS | 10.21 | 11.91 | 13.88 | 15.72
EPS% | 16.35% | 16.63% | 16.51% | 13.25%
- Any company which is growing EPS% mid teens with a recognizable brand value deserves a fair forward p/e of 20
Base Case Fair Value w/ forward p/e = 20:
Year. | 2025 | 2026 | 2027 | 2028
Fair Value | $204 | $238 | $277.6 | $314.4
Conservative Base Case fair value w/ forward p/e=15:
Year. | 2025 | 2026 | 2027 | 2028
Fair Value | $153.15 | $178.65 | $208.2 | $235
Bull Case Fair value w/ forward p/e=25:
Year. | 2025 | 2026 | 2027 | 2028
Fair Value | $255 | $297 | $347 | $393
Bear Case fair value w/ forward p/e = 10:
Year. | 2025 | 2026 | 2027 | 2028
Fair Value | $102 | $119 | $138 | $157

Fiverr International | FVRR | Long at $26.32If AI/AGI is really taking our jobs, the gig economy will prosper... right?
While Fiverr International's NYSE:FVRR market cap is just under a billion, the company has experienced significant revenue growth since 2019. Earnings grew by 395.7% over the past year and are forecast to grow 24.68% per year. Cash flow is also expected to rise. The company has a low float (30.4M) but a price-to-earnings of 52x (caution). While competition in the gig economy is tough (I see you NASDAQ:UPWK ), NYSE:FVRR may be gaining upward momentum as the stock starts to bottom in the near-term. The price gaps on the daily chart near $20 and $22 may be closed before a strong move up, but the price is now consolidating within my historical simple moving average. When this happens, often (but not always), the ticker will trade sideways for a while before reversing up.
Thus, at $26.32, NYSE:FVRR is in a personal buy zone.
Targets
$34.00
$40.00

Is it time to buy the AUD?Most economies are facing stagflation—Japan, the US, and Europe, to name a few. Stagflation is high inflation with low to no GDP growth.
However, Australia and New Zealand currently have steady inflation and GDP growth within reasonable targets.
My bias has changed to buying the AUD and NZD.
Thoughts?
OANDA:AUDUSD OANDA:AUDJPY OANDA:AUDCHF OANDA:EURAUD OANDA:GBPAUD

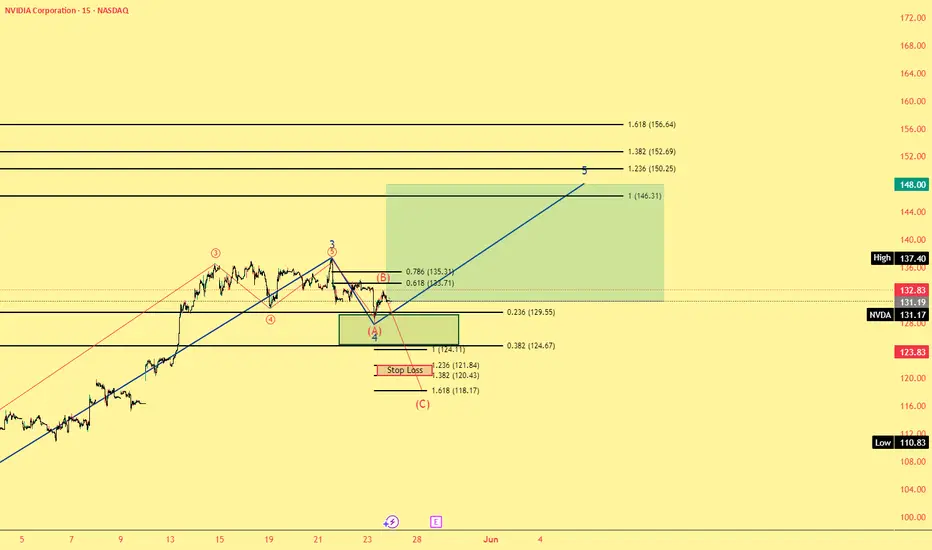
NVDA Possible PlaysCurrently looking to see if NVDA can manage to get through next week and bounce up or the alternate route where we see a correction. Thoughts and comments appreciated.
$UUUUTrump’s executive orders to ease Nuclear reactor regulations and improve fuel supply chains, boosting nuclear energy demand.
Before 2025 started, once Trump won the election I was certain he would eventually pass executive order(s) and/or make political deals to ease nuclear reactor regulations and improve fuel supply chains, naturally boosting nuclear energy demand. This does not just affect AMEX:UUUU it also affects most of the Nuclear Energy stocks and Uranium-related stocks, like AMEX:UEC , NASDAQ:CEG , NASDAQ:NNE , NYSE:OKLO etc.
We should see most of these stocks continue to grow in value throughout 2025 at the very least. I don't know yet how they will fair in 2026 though 2025 should continue to be a good year for nuclear energy and uranium stocks :)
