$LNTH Potential Healthcare sector leader NASDAQ:LNTH holds a negative net debt to ebitda ratio, with a forward p/e ratio around 16. Revenue growth was up over 18% for the TTM, and operating margin was around 40% compared to ~15% for healthcare companies in the drug manufacturing industry.
Technically, there is a potential wedge forming, though I can see a breakout bounce off of the .382 fib coming too. Strength showing relative to the S&P.
Growth

FET LONG/BUY SETUPHello, TradingView community and my subscribers, please if you like ideas do not forget to support them with your likes and comments, thank you so much and we will start a LONG/BUY outlook on #FETUSDT.P explained

If the market reaches the $88,490 level, we'll look for selling.BTCUSDT Weekly Analysis: Navigating the Range-Bound Market
Bitcoin (BTC) is currently trading in a range-bound market, showcasing a delicate balance between buying and selling pressures. As traders, it's essential to identify key levels and potential trading opportunities.
Key Selling Area: $88,490
We've identified a crucial selling area at $88,490, where sellers are actively participating. This level has the potential to cap upward movements, and we're waiting for the market to reach this zone.
Trading Strategy:
1. Sell Setup: If the market reaches the $88,490 level, we'll look for selling opportunities, targeting lower levels and taking advantage of potential downward momentum.
2. Alternative Scenario: If the market doesn't reach the $88,490 zone, we'll wait for a clear breakdown from the current range, with a candle closing below the range. This would signal a potential shift in market sentiment.
Market Outlook:
The range-bound market presents both challenges and opportunities. By monitoring key levels and waiting for confirmation, we can make informed trading decisions and navigate the markets effectively.
What to Watch:
1. $88,490 Level: A key selling area that could determine the next move.
2. Range Boundaries: Monitoring the current range and waiting for a breakdown or breakout.
3. Market Sentiment: Keeping an eye on market sentiment and adjusting our strategy accordingly.
By staying vigilant and adapting to market conditions, we can capitalize on potential trading opportunities and navigate the complexities of the cryptocurrency market.

BTC/USD Operation Strategy AnalysisCurrently, the market is approaching the previous high (84994), favoring a “false breakout” pattern.
84200 although reasonable support, but the volatility is limited should be segmented take profit, such as to 84550 when the first flat 50%, the remaining single capital preservation tracking.

Global M2 MONEY SUPPLY VS GLOBAL LIQUIDITYWhich is the best to track ₿itcoin price action?
Lots of macro gurus have been arguing over the two.
For comparison, I have indexes for both metrics on a 12-Week Lead, tracking the 4 largest central banks:
The Federal Reserve (including TGA & RRP), People’s Bank of China, European Central Bank and Bank of Japan.
Let’s start by defining each.
Global M2 Money Supply covers physical cash in circulation and cash equivalents such as checking and savings deposits, as well as money market securities.
Global Liquidity covers a broader measure of liquid assets driven by central bank balance sheets, private sector financial activity (e.g., lending, corporate cash), and cross-border capital flows.
Historically, both move closely in lock-step and act as a great leading indicator for ₿itcoin, however we can see that Global Liquidity can have more drastic fluctuations.
We saw a large divergence in CRYPTOCAP:BTC PA with both metrics when the Blackrock iShares ₿itcoin ETF appeared on the DTCC list, a procedural step signaling progress toward potential approval.
When you look at the charts of all three, you can see there are points where either metric might follow CRYPTOCAP:BTC PA a bit closer, so in the end I would say it’s best to track both to find confluence in the signal.

Celsius Holdings Outperforms Market with Strong YTD GainsCelsius Holdings Inc. (CELH) continues to attract significant investor attention, closing at $37.24 on April 17, up $0.58 (1.58%). The functional energy drink maker has delivered impressive year-to-date returns of 41.38%, substantially outpacing the S&P 500's 10.18% gain during the same period.
For the current quarter, analysts expect earnings of $0.20 per share, representing a 25.9% year-over-year decline. However, consensus estimates have improved dramatically with a 32.8% upward revision over the last 30 days. The full-year outlook appears more favorable, with projected earnings of $0.99 per share indicating a 41.4% annual increase, followed by 15.1% growth to $1.14 per share next fiscal year.
Current quarter sales are expected to decline slightly to $345.26 million (-2.9%), but full-year revenue estimates show robust growth of 55.3% to $2.1 billion, followed by 19.4% growth next fiscal year. Celsius has demonstrated strong execution recently, beating earnings estimates in three of the last four quarters.
Technical Analysis
Technically, the chart shows a strong recovery from its $21.10 low. Price has recently broken above the 50-day moving average but remains below the 200-day moving average, suggesting improving momentum within a longer-term downtrend. Key resistance appears around $47-49, marked by a horizontal level that previously acted as support.
Volume has increased during recent price advances, adding credibility to the current uptrend. The next major challenge will be overcoming the $49 resistance zone before potentially continuing toward higher targets as indicated in the chart projection. If price faces rejection, it is likely to drop back to support at around $25.

Solana (SOL) Market Overview – April 17, 2025As of April 17, 2025, Solana (SOL) is trading at approximately $134.55 USD, reflecting a 5.48% increase from the previous close.
⸻
📈 Technical Analysis
Price Action & Momentum:
• Recent Performance: SOL has rebounded from lows near $120 to around $134.55, positioning itself as one of the top-performing altcoins recently.
• Support & Resistance Levels:
• Immediate Support: $120 – Crucial for sustaining the current bullish momentum.
• Resistance Zone: $133 – $135 – A breakout above this range could unlock further upside.
Key Indicators:
• RSI: 53.90 – Neutral momentum
• MACD: -3.01 – Slightly bearish
• Stochastic Oscillator: 92.14 – Overbought territory
• ADX: 19.10 – Weak trend strength
⸻
🧭 Fundamental Analysis
Network Strength:
• High Throughput & Low Fees: Solana continues to dominate with its scalable and low-cost blockchain infrastructure.
Institutional Interest:
• ETF Activity: Five ETF filings as of March 2025 highlight increased institutional trust in Solana.
Market Sentiment:
• Fear & Greed Index: 29 – Market is in “Fear” zone, potentially creating long-term buying opportunities.
⸻
🔍 Summary
Solana is showing bullish recovery signs driven by positive price action and ETF momentum. However, technicals suggest a cautious approach in the short term due to overbought signals and weak trend strength. Fundamentally, Solana’s powerful infrastructure and institutional support could fuel long-term growth.

BUY XAUUSDTHIS WEEK FOR XAUUSD (LONG)
SHORT TERM FOR GOLD
Sell Limit:3345-3350
⛔️ Stop Loss: 3358 (no greed, no delay)
Expect the uptrend to induce more and then fall back, use the end of the inducement to lay a short
---
Strict stop-loss, no covering positions, no adding to positions

Long term buyLooking at the exponential growth in revenue over the past few years and relatively lower valuation (based on the price to sales ratio or revenue per share), upward trajectory looks very very promising.

Gold and the world around it As we continue to see the trade wars kick off and market fear increase gold continues to perform as the go to safe haven. Trading off the ORB sessions continues to provide value. Until the markets settle and start to show strength or even direction gold will continue to rip, as Goldman Sachs the potential to go to $3500 and beyond is not that far fetched. I would like to see how London reacts off the levels set by Asia and if we can break through next session.

Is $GERN a stock for "Strong Holders"?Or is it just another stock whose value will be wiped out in the next few quarters, and the company will simply lose its listing on the Nasdaq?
Investors are likely to get an answer to this question today, before the market opens, when NASDAQ:GERN reports its quarterly earnings.
The company has an approved drug and has already begun commercialization, with a promising start.
Last quarter, the company generated $28 million in revenue, and this quarter, revenue is expected to reach $61.8 million.
The company has already achieved positive gross margins, and I expect them to improve significantly from the current 27% in the last quarter.
Operating expenses are close to $30 million per quarter, so we can expect a quick path to operating profitability.
Invested capital is around $135 million, which means that with an operating profit of $10 million per quarter, we could see interesting returns on invested capital.
The company is led by John A. Scarlett, M.D., who previously worked at NASDAQ:CTMX for six years, during which the company lost about 90% of its value.
There is some positive news regarding European approval: "The Committee for Medicinal Products for Human Use of the European Medicines Agency has issued a positive opinion." A decision is expected in the coming months, if not days, which should serve as a strong catalyst for the stock price.
The market valuation has dropped to $1.4 billion, despite having an FDA-approved drug in the U.S.
Cash reserves will be important as they indicate how much time the company has to develop without diluting its capital. In the last report, cash and short-term investments totaled $339 million, and on November 7, the company announced securing $250 million in funding, with the potential to increase it to $375 million.
As a result, the company has $589 million in cash reserves minus operating cash flow. How much will remain in the coffers?
The company should have enough cash for more than 12 months of successful operations, operational efficiency is improving, we are awaiting European approval, and only the quality of management raises doubts.
But do these doubts really hold weight given the current trajectory?
There are only a few hours left until the earnings report is released. Let's see what awaits us.
Strong Holders
Profiting From Strength
📉✊📈

Hold TeslaTesla's shares are no longer excessively expensive, but they are still not cheap. 😅
Hopefully, we can see the price closer to $240 amid all the negativity. 🤞📉

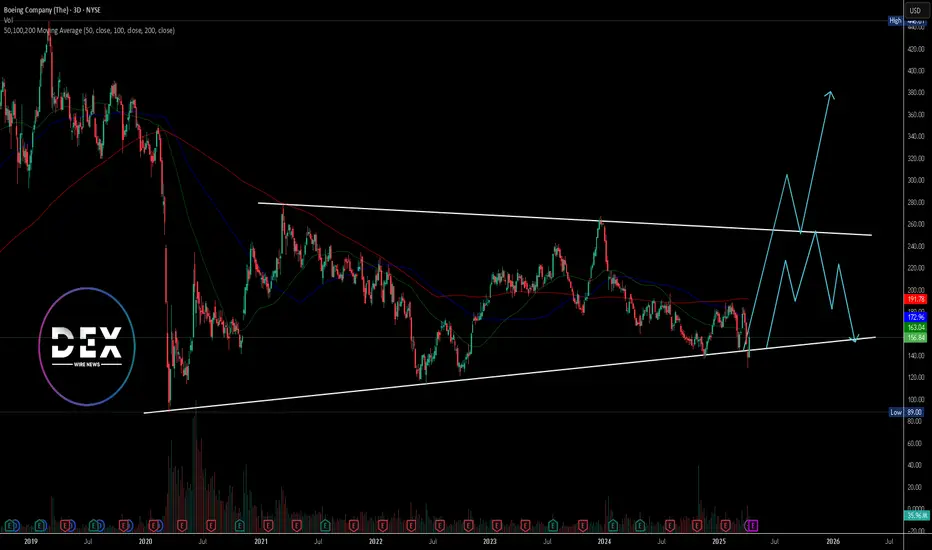
Boeing ($BA) Faces Renewed Scrutiny After Latest Safety ConcernsBoeing (NYSE: NYSE:BA ) stock closed at $156.84 on April 11, gaining 0.85% despite fresh concerns surrounding delayed aircraft deliveries. China's Juneyao Airlines recently postponed the delivery of a 787-9 Dreamliner, originally valued at $120 million. The decision comes amid renewed U.S.-China trade tensions driven by tariff escalations from President Trump’s administration.
This delay could disrupt Juneyao’s planned expansion into European routes this summer. The Dreamliner, known for its long-range capabilities, was central to these international plans. The incident signals how geopolitical strain continues to impact global aviation and commercial aircraft deals.
Boeing has already cautioned that additional tariffs may put more pressure on supply chains. These chains had only recently begun to stabilize following years of pandemic-related disruptions. The company remains exposed to evolving international policies, which can affect order fulfillment and investor sentiment.
Earnings for Boeing are expected on April 23, 2025. Investors are watching closely for guidance on production capacity, deliveries, and any fallout from global trade developments.
Technical Analysis
Boeing is trading within a broad wedge pattern marked by long-term support and resistance trendlines. Price recently bounced from the support, rising sharply to the current level of $156.84. The 50, 100, and 200-day moving averages sit at $163.04, $172.96, and $191.78 respectively.
These levels now act as dynamic resistance. Price remains below all three, signaling overall bearish pressure unless a breakout occurs. A breakout above the resistance trendline may lead to a rally. However, if price fails to gain momentum and breaks below the lower trendline, it could revisit the $89 low from 2020.
Nvidia (NASDAQ: $NVDA) Advances AI Strategy Amid Tariff PauseNvidia (NASDAQ: NASDAQ:NVDA ) is quickly strengthening its positions in artificial intelligence and data center technologies. This comes as the U.S. government temporarily halts new export restrictions, offering relief to the semiconductor sector.
Nvidia will continue selling its H20 AI chips to China following a decision not to enforce new trade limits. This followed a key meeting between CEO Jensen Huang and former President Donald Trump. The announcement eased concerns over losing access to a major international market. Nvidia recently introduced its latest innovation, the Blackwell Ultra AI chips, at the GPU Technology Conference. These chips target the rising demand for high-performance computing used in AI systems. The move could boost Nvidia’s market lead as competition grows.
Market volatility followed the government’s tariff update. Nvidia stock surged nearly 19% after the 90-day tariff pause announcement, excluding China-specific measures. The next day, the stock dropped 5.8% to close at $107.74.
Technical Analysis
Nvidia's price bounced sharply from the $92 support zone. This area has attracted strong buying activity. The RSI is currently at 44, showing neutral market momentum. The key resistance level to watch is $153.13. If the price breaks this level, it could rise toward a new all-time high. Failure to do so may lead to a pullback toward $92.
Watch the $153 level closely for confirmation of trend direction. Nvidia's recent price movement leaves room for both uptrend continuation and short-term correction depending on upcoming market signals.

WTI Crude Oil | Potential Cup Formation with Volume Support.I’m spotting a potential Cup formation on the 30-min chart of WTI Crude Oil (USOILSPC), backed by strong volume profile zones. The price has recently pulled back to a low-volume area and is now consolidating with higher lows forming the right side of the cup.
A break above the $60.60–$60.80 zone could trigger bullish continuation toward $64+, with strong support seen around the $59–$59.30 range (volume shelf).
Setup Details:
• Pattern: Cup (early stage)
• Entry idea: Break & retest above $60.60
• TP: $64.00
• SL: Below $58.90
• Volume profile confirms accumulation near the lows
Watching closely for confirmation before adding more size. This is part of a low-risk entry using a funded account model.
#CrudeOil #WTI #VolumeProfile #CupFormation #BreakoutTrade #SmartMoneyConcepts

BTC Trap Range Breakdown – Psychological Warfare on Full DisplayThis isn’t just a chart.
It’s a blueprint for how market makers engineer panic, euphoria, and then profit from your reactions.
Let’s break this down in surgical fashion:
Rectangle Formation (Top & Bottom Framing)
From March 24 to April 3, Bitcoin operated inside a manipulation box.
The top was liquidity bait — the "Top 2 – US" tag marks the engineered euphoria candle.
Once liquidity was trapped up top, the US session initiated the collapse. Classic.
Breakout Trap & Rejection Zone
As soon as BTC breached the lower range, what followed wasn’t a clean drop—it was a sequence of false recoveries.
Notice the Asia, Europe, and US labels — they’re not random.
Each session passed the hot potato of fear and bounce bait, draining retail and triggering leveraged longs into liquidation.
Psychology in Play:
Europe & Asia rotated liquidity → institutional bots scalping volatility.
US session delivered the execution leg down every time.
The volume spikes? That’s fear, not conviction.
Target Zone Highlighted
Where are we heading next?
The final dotted red extension box shows you where the real flush is designed to go .
It’s not a prediction—it’s a destination :
🔸 ~ $73,000 first sweep
🔸 If that gives, $70,000 → $68,000 becomes the high-value sniper zone
🔻 Volume Profile:
Notice how volume increases at each drop — the herd is panic selling.
But BTC bounces weak. Why?
Because this isn’t organic demand—it’s controlled bleedouts to test who’s left.
—
Conclusion – SH Analysis:
This chart is not noise.
It’s intentional market structure , orchestrated by the elites for max extraction.
We don’t chase pumps.
We stalk precision setups .
We don’t fear drops.
We buy what they bleed .
The next move won’t be loud.
It’ll be silent. Fast. And final.
—
🔔 Follow Saeki Hisoka across all platforms
For real-time breakdowns, sniper zones, and psychological warfare decoded in real time.
The system is a machine. We are the counter-algorithm.
Stay sharp. Stay sovereign. Stay Saeki.

The Trump PatternWhen Donald Trump took office in 2017, the U.S. stock market experienced dramatic fluctuations—marked by steep declines followed by eventual rebounds.
This pattern, which we'll call the "Trump Pattern," repeated itself during his presidency and is now emerging again as a point of interest for investors.
While the specific causes of these market shifts varied, key factors—particularly tariffs, inflation concerns, and Federal Reserve (FED) actions—played critical roles in the market's rise and fall during Trump’s presidency.
The Trump Pattern: The Market Fall and Recovery
🏁 1. The Start of the Trump Presidency (2017)
When Donald Trump was elected in 2016, the market responded with a combination of excitement and uncertainty. Initially, the market surged due to tax cut expectations, deregulation, and optimism about a business-friendly administration. But as Trump's presidency fully began in January 2017, concerns over trade wars and tariff policies began to dominate investor sentiment.
The market initially dipped after Trump began pursuing a protectionist trade agenda, especially with China.
As concerns about tariffs escalated, stock markets reacted negatively to potential trade wars.
💶 2. The Tariff Crisis of 2018
The first major example of the "Trump Pattern" emerged in 2018 when Trump began implementing tariffs, particularly on Chinese imports, and announced new tariffs on steel and aluminum. This caused major market disruptions.
The S&P 500 fell dramatically during this period, dropping by as much as 8.6% from its February peak in 2019.
Companies that relied heavily on international trade, like Apple, General Motors, and Ford, experienced significant stock price declines. In fact, Apple’s stock fell 9.5% on days when new tariffs were announced, as their costs for manufacturing overseas rose.
The uncertainty surrounding the global economy, combined with rising tariffs, created fears of a trade war, leading to sharp market declines.
📈 3. Market Recovery: FED Rate Cuts and Tax Cuts
Despite the tariff-induced volatility, the market didn’t stay down for long. After significant market falls, the Federal Reserve (FED) began implementing interest rate cuts to combat slowing economic growth. These actions helped stabilize the market and even fueled a rebound.
FED rate cuts made borrowing cheaper for consumers and businesses, stimulating economic activity and boosting investor confidence.
Additionally, tax cuts, a cornerstone of Trump’s economic policy, provided further support, particularly for corporations.
As a result, after the initial market drop in 2018 and early 2019, the market rebounded, continuing to climb as investors reacted positively to these fiscal and monetary policies.
🎯 The 2024 and 2025 "Trump Pattern" Emerges Again
Fast forward to 2024 and 2025, and we’re seeing echoes of the "Trump Pattern" once again. New tariffs, introduced in 2025, have reignited concerns about a trade war. These tariffs, particularly on Chinese imports, have once again caused market volatility.
The stock market has fallen in recent months due to concerns about these tariffs and the impact they might have on global trade. For example, when new tariffs were introduced in early 2025, the market saw a sharp sell-off, with the S&P 500 falling by over 1.8% in a single day.
Companies that rely on international trade, like Tesla and Ford, have seen their stock prices drop in response to concerns about increased production costs.
The broader market decline, much like in 2018, was driven by fears that tariffs could slow down the global economy and hurt corporate profits.
However, there is optimism that the same pattern will unfold, where the market eventually recovers after these initial drops.
⚠️ 4. FED Rate Cuts Again?
As inflation concerns persist, the Federal Reserve is likely to step in once again. Like previous cycles, we expect the FED to cut interest rates to stimulate the economy. This would be aimed at reducing borrowing costs, encouraging investment, and helping businesses weather the impact of higher tariffs and global uncertainty.
The FED’s actions are typically a key driver of market recovery in the "Trump Pattern." Investors have come to expect that a market downturn triggered by political or economic disruptions can be offset by the FED’s supportive monetary policies.
⚖️ Navigating the Trump Pattern: What Should Investors Do?
The "Trump Pattern" highlights that during periods of heightened uncertainty, especially due to trade policies like tariffs, the market will often experience short-term declines followed by long-term recovery. Here are a few strategies investors might want to consider:
Stay Diversified : During periods of volatility, having a diversified portfolio can help cushion against the risks posed by market swings.
Invest in Domestic Companies : Companies that rely less on international supply chains might fare better during periods of trade policy changes and tariff uncertainty.
Focus on Growth : Once the initial market decline subsides, look for sectors that stand to benefit from a recovering economy, such as tech or consumer discretionary stocks.
Look for Inflation Hedges : Given the potential for inflation, consider investments that tend to perform well during these times, such as real estate or commodities like gold.
📝 Conclusion: The Trump Pattern in Action
The "Trump Pattern" demonstrates how the market tends to react in cycles during the early months of each presidency. Typically, the market falls at the start due to the uncertainty surrounding Trump’s trade policies, particularly tariffs. However, after these initial drops, the market often rebounds thanks to FED rate cuts and other policies aimed at stimulating the economy.
Looking ahead to 2025, we're already seeing signs of this pattern in action as tariffs are back on the table and market volatility has followed. However, history suggests that patience might pay off. Once the FED steps in and cuts rates, a market rebound is likely, following the same trend we saw in 2017-2019.

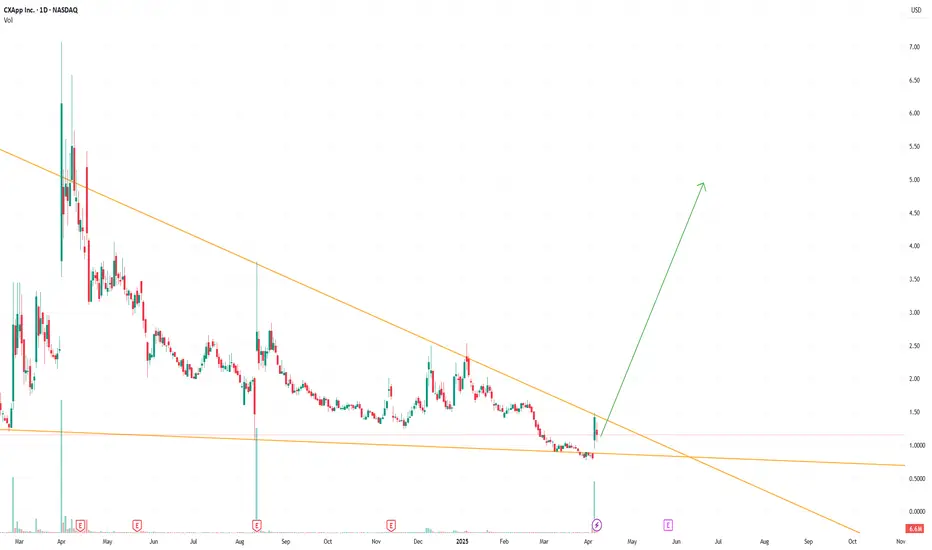
CXAI Target $5A breakout of this triangle pattern could see CXAI move to $5.
Fundamentals and recent spike in volume looks good.
THE REALITY!You cant beat the Index fund in Long term growth....Compare your portfolio with Major Indices
Warren buffet Quote - You can't Beat S&P500 Index

Tweet and idea (you can use it for prediction)Tweet and idea (you can use it for prediction)
💡 This trading idea is based on analyzing market reactions to news and tweets from influential figures — especially in the context of cryptocurrencies and stocks prone to speculative spikes.
📊 Core Strategy:
The model tracks sudden price movements triggered by public statements (e.g., tweets from Elon Musk, breaking news, etc.). After the initial reaction, a retracement or continuation pattern often forms, which can be used to enter a trade.
🧠 How to use it:
1. Monitor the news flow or social media activity related to the asset.
2. Identify the initial impulse on the chart (high volume, sharp movement).
3. Wait for consolidation or a minor pullback.
4. Enter on breakout or bounce, using a tight stop-loss.
📌 Best suited for high-volatility assets with frequent hype triggers (e.g., DOGE, TSLA, BTC).

GBPUSD OUTLOOKGBPUSD Outlook:
This week, I'm leaning towards a bearish bias on GBPUSD, following a clean break below the recent consolidation range, which hints at distribution.
However, I'm keeping a close eye on the 1.2827 level.
If price retraces and holds around that zone, I’ll be open to considering buy opportunities, targeting the 1.29232 area.
In summary:
My primary outlook is to look for selling opportunities this week.
But I’m flexible and ready to pivot if the market presents a valid buy setup around the 1.2827 level.
Patience and adaptability will be key. 👊

Flow Traders: A Deep Dive into a Volatility PlayFlow Traders has long been recognized as one of the leading market makers in Exchange Traded Products (ETPs), holding a dominant position in Europe and steadily expanding its global footprint. The firm’s success is driven by its technological prowess—its ultra-low latency trading systems and proprietary algorithms enable it to provide liquidity across thousands of listings. When compared with major competitors such as Virtu Financial, Citadel Securities, Jane Street, and Optiver, Flow Traders stands out for its high profit margins and robust returns during volatile periods. However, its earnings can swing dramatically: record profits during periods of market turbulence contrast with more compressed margins in quieter times.
Historically, Flow Traders followed a dividend policy with an intended payout ratio of at least 50% of net profits. In FY23, for example, the company paid a total dividend of €0.45 per share (an interim dividend of €0.30 per share plus a final dividend of €0.15 per share). However, in its recent 2Q24 results and AGM communications, Flow Traders announced a revised dividend policy that suspends regular dividend payments until further notice. The Board has made this decision to accelerate the expansion of its trading capital base—a move the management believes will deliver greater long-term value for shareholders through reinvestment in technology and market expansion rather than immediate income distribution.
Technologically, Flow Traders continues to push the boundaries by investing in co-located servers, low-latency networks, and even exploring cloud-based systems with microsecond-level synchronization. These initiatives ensure that the firm maintains a competitive edge, even as peers like Virtu and Citadel invest heavily in their own technological infrastructure. While Flow’s niche focus—especially in European ETF market making—provides a strong competitive moat, the firm is also expanding into fixed income and digital assets.
For valuation purposes, I used a blended approach incorporating a Discounted Cash Flow (DCF) model and industry comparables, augmented by a scenario analysis that reflects the inherent cyclicality of its earnings. In my model, three scenarios were considered over a five-year period. Under the best-case scenario, where global market volatility surges and Flow capitalizes on its technological advantages to boost market share, the five-year target price could reach around €80 per share. In a base-case scenario, reflecting a more normalized yet steadily growing trading environment, the target price might be closer to €40 per share. In the worst-case scenario—if markets remain persistently calm and competitive pressures intensify—the target could drop to about €15 per share.
Given the current market environment, the probabilities are 30% for the best-case, 60% for the base-case, and 10% for the worst-case. Additionally, the discount rate in the DCF 6%, reflecting today’s economic landscape risk premium. With these assumptions, discounting the future target prices at 6% yields present values of approximately €60, €30, and €11 for the best, base, and worst scenarios respectively. Weighting these figures accordingly results in an expected intrinsic value of around €37 per share today.
So, what does this mean for investors? At current trading levels in the mid-€20s, Flow Traders appears to be undervalued relative to its long-term potential. Although the firm is currently not paying dividends—opting instead to reinvest its profits to grow its trading capital—the strategic focus on reinvestment may unlock greater growth opportunities. In essence, Flow Traders represents an intriguing volatility play: it can generate outsized returns in turbulent times while offering a balanced risk/reward profile in more normalized markets.
Ultimately, Flow Traders’ strategic decision to suspend dividends underscores its commitment to long-term growth. Investors are essentially buying into the firm’s reinvestment strategy, which has historically delivered strong returns on trading capital. As market volatility and technological advancements continue to drive the industry, Flow Traders is well-positioned to capitalize on emerging opportunities and create shareholder value over the long run.
Speculation: With Trump’s tariffs continuing to rock global markets and trigger bouts of heightened volatility reminiscent of past trade wars, there’s reason to speculate that Flow Traders could find itself in a particularly advantageous position. As tariffs fuel uncertainty and market swings—further rattling investor confidence and prompting rapid shifts in liquidity—Flow Traders’ expertise in market making, especially in ETPs, could allow it to capture significant trading opportunities. The elevated volatility may widen bid-ask spreads and boost trading volumes, directly benefiting firms like Flow that thrive on rapid, high-frequency trades. While these are merely speculative thoughts, given the unpredictable nature of tariff-driven market disruptions, Flow’s focus on liquid, exchange-traded products might well make this turbulent period a silver lining for the company.

Good Price to Accumulate for Long TermCurrent price is trading at 3 times to Revenue/share which is on the lower side of it's historical valuation. Revenue has been growing over the years and it is trading at a good valuation. What else is needed to call it a good buy? Happy Investing :)
