GRP will provide 100% profit at least 50%BUY GRT/USDT As Spot
Entry: 0.7611
TP 1: At 1.1901(should above 50%+)
TP 2: At 1.7300(should above 100%)
GRT

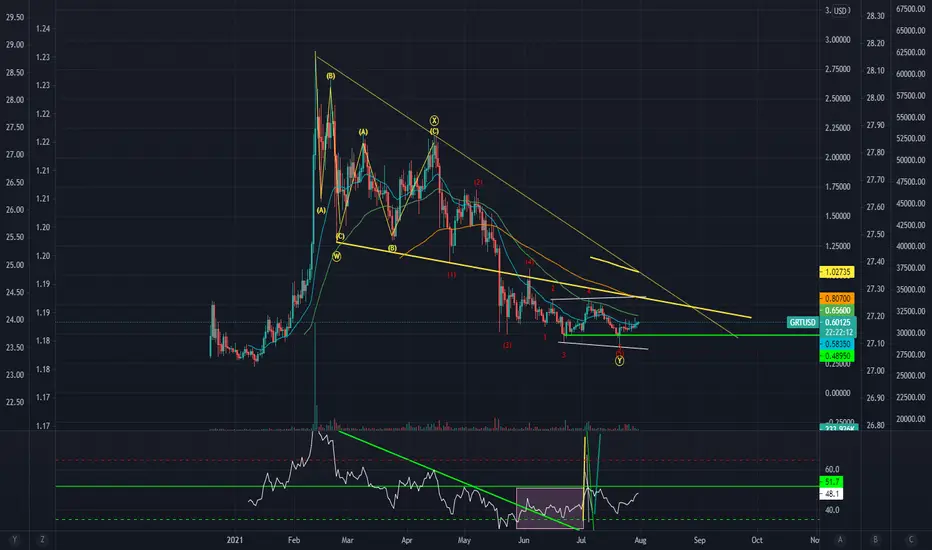
Grt considering exploding upwardsim not buying right now into resistance.
But im watching this closely, because this can explode to.. even 10 dollars
if we get a retrace to near the lower blue line im buying. if we break the line, and get a retrace bounce - im buying.
this all depends on how btc resolves the 46k area.


GRT/USDT { GRT } - BULLISH SETUPANALYSIS 🔎
- GRT/USDT hit an all time high and retraced.
- The downtrend was bounded in the descending channel.
- Price action printed a double bottom pattern.
- A double bottom is a bullish reversal pattern.
- Price brokeout above the double bottom's neckline resistance and the descending channel's resistance.
- This is a bullish signal.
BUY ENTRY ⬆️
- Market entry: current market price.
- Limit entry: possible retest.
TARGETS 🎯
- Horizontal resistance level (@2.1980).
- Horizontal resistance level (@2.8807).
SETUP INVALIDATION ❌
- Breakdown below the previous swing low horizontal support level.

TheGraph Yes but Waiti was surprised by the weakness of one this big project while BTC was correcting.
No impulse, No rage, No Surprise. Stayed in perpetual weak downtrend for now.
------------------------------------------------------------------------------------------------------------------------------------------
- So i will give a trading simple way :
- Should wait GRT break his Downtrend and pass 1$ to invest in.
- TP1 : 2$
- TP2 : 3.5$
- TP3 : 4.8$
- The new GRT Bottom should be around 0.45$ but have to be prudent in cryptos.
- In Any of this cases if BTC makes a fast Dip (BearTrap), i suggest you to keep some Cash to get GRT around 0.2$.
------------------------------------------------------------------------------------------------------------------------------------------
Stay Safe
Happy Tr4Ding !

GRT double bottom ?!I saw an DOUBLE BOTTOM pattern on the THETA/USDT chart. if the price manages to close above the neckline then most likely the price will go up high, if it is also supported by BTC .
If you have any questions write in the comments column.

Ethereum, Litecoin, Bitcoin cash, Graph token#ETH
#LTC
#BCH
#GRT
Strength should not be sold on eth imo

GRT Primed for a big run!!?The graph has been under performing recently even though i still remain long term bullish on this great project, we could be ready for a big run coming soon if we can take out a couple key levels. First being the first pivot point we directly are on as of right now, it would be very ideal for GRT to jump above and secure this level for our daily close, next will be the previous pivot point which is above and to the left of our first one, i think we will continue to face resistance here so getting above on the first attempt may not happen, the most ideal level we need to get above before we can really say we are in an uptrend again is the 0.2 FIB level, we haven't been above this level since late May. Looking at the bollinger bands we actually are looking bullish, price action is starting to cling onto the top band which as you guys know can induce a very nice big run to the upside, if i had to guess on where we could land if this plays out, i would say atleast the first level of resistance (R1). Looking at the MACD we are in bull territory but we need to keep pushing upwards to see our blue MA keep separating away from the orange or we risk having a bearish cross, our histogram seems to be really flattening out with our green bars staying the same or getting less, so looking at that i think we might be in for a bearish cross soon but there is a chance we could get a bounce aswell, definitely need to see some momentum and volume for GRT if we are going to keep pushing up. Not financial advice just my opinion!

GRT/USDTThere is Bullishe MACD-Cross and we above Resistance so we are good I bought Some at 0.68
We should use stop lose
don't long at this zone be carefuly


GRTUSDT Swing Trade Setup!GRTUSDT Technical analysis Update
GRT/USDT currently trading at $0.670
Downtrend Line Breakout
Buy level: Above $0.650
Stop loss: $0.570
TP1: $0.75
TP2: $0.94
TP3: $1.11
Max Leverage 2x
Always keep Stop loss
Note: please do your own research before investing. Never invest money that you can't afford to lose.

The Google of CryptoWanna be rich? Me too.
Not sure if this will do it, but it's better than the other chances I got.
All time low.
Great crypto. Amazing concept with over 3 years of Beta testing before launching just last December.
Downside risk is -50% but the upside reward will be at least +500%.
Let's GOOO!!!
(Not Financial Advice....but yah know...)
GRTUSDTHello to you all. Mars Signals team wishes you high profits at all times.
We are in a 4-hour time frame. As you can see, the price is testing the level after climbing the level it has crossed. We have 2 scenarios. First, the price should be supported from here and start moving upwards. The second scenario the price can not be supported and will start falling until the next support line.
Warning: This is just a suggestion to you and we do not guarantee profits.
Wish you luck!


GRT - 4hr - Long - 27% profit (0.618)We should be recovering from this structure in near term. SL below D point

GRT is turning aroundBeen watching GRT for months now and finally seeing the turnaround start. There is a clear bullish divergence in both the RSI and the MACD. As the price has continued to decline while the RSI and MACD signal lines have been climbing. Finally seeing an RSI breakout (for the moment) and I jumped in with a starter position here.

GRT reversalKeep an eye on GRT. Breaking 0.59 resistance. Next will be 0.68-0.70. Entering on breakout and on re-test of 0.59-0.60 after it reach next SR level.

GRTUSDT Has Broken Above the Resistance
Welcome back Traders, Investors, and Community!
Hi Traders, GRTUSDT on H4 has broken above the Flag it’s expected to go higher to the Resistance.
⬆️Buy now or Buy at 0.538
⭕️SL @ 0.480
✅TP1 @ 0.68
✅TP2 @ 0.88
✅TP3 @ 1.170
We will have more FREE forecasts in TradingView soon
❤️ Your Support is really appreciated!❤️
Have a Profitable Day

GRT Bearish Times AheadGRT looks bearish here as it looks to break below the current Fib support (.382) with decreased volume and looks to be heading towards .60 cents on the USD/Tether pair. GRT bounced off the .382 Fib level last month as it retested the .618 Fib before ultimately making a lower high and looks to be printing lower lows.
GRT has alot of room to fall from here if we fail to bounce off the .382 again. Target 60 cents atleast.


GRT in the mid termCurrently, due to the increase in the bitcoin range and its movements, all altcoins will be affected by it. The analysis is just a series of probabilities.
I hope you find this analysis useful🌹
