GRT

6.66€ By the end of the Month $GRT Looking very Good, very soon we gonna touch 3.5 and then next ath gonna be easily 6.66 with 8.3B Market Cap which is a reasonable target with this fundamentals, this project has a lot give. Let’s see what this Giant can do !!
Not a financial advice do your one research ♥️🤵🏻


Strategies and Insights by Trade Ninja ($GRT)If you like the video please follow and support the channel so I can keep creating content.

GRTUSDTGRTR haven't broken it's ATH since 21 Feb and in consolidation for 2+ Months.
Fundamentals are strong at the moment.
wait for the confirmation candle and 3+$ will be new ATH soon for short term.

GRT HEALTHYGRT seems healthy enough.
The volumes are good and it will probably test the next resistance level soon!
Just my opinion! Take care and trade carefully!

Grt is google for blockchain What Is The Graph (GRT)?
The Graph is an indexing protocol for querying data for networks like Ethereum and IPFS, powering many applications in both DeFi and the broader Web3 ecosystem. Anyone can build and publish open APIs, called subgraphs, that applications can query using GraphQL to retrieve blockchain data. There is a hosted service in production that makes it easy for developers to get started building on The Graph and the decentralized network will be launching later this year. The Graph currently supports indexing data from Ethereum, IPFS and POA, with more networks coming soon.
-Not a financial advice-

$GRT next leg up anyday now. Above $5?Correct me if I'm wrong. I'm a noob at this. if it follows the previous path, we should see the next leg up any day with above $5.
🚀🚀🚀🚀🚀🚀🚀🚀🚀🚀🚀🚀🚀🚀🚀🚀🚀
BINANCE:GRTUSDT #theGraph #grtusdt $grt $kcs $tel $btc $eth $doge $ltc $xrp $ada #crypto

GRT wave 5?You could also see a symmetrical triangle which could break out to the upside, leading to the target of 5 wave

GRT/BTC ready for a parabolic run.As we can see GRT is almost ready for a big run towards the top here, targets are hard to pinpoint but based on the Fibs we should see a nice rise out of it, used the prev run as an indication. It is tightly consolidating now into and near the top trend line, it has already done 2 fakeouts and the 3rd one should be pushing it upwards.
Trade at your own risk, this is not financial advice, just speculation.

ABCD Harmonic Target 1.74
______________________________________________________
Send GRT : 0xe18F7c9F1090d8cE5A6e2668CA794281A5b1c59D

Result of our Team Analyze: Grt Tp1 fullGrt short term and future tp1 tuched.
GRT can very profitable for mid and long term
this analaze publish in 28 March
This is not a financial recommendation.
Do not forget to like and comment.
Follow for further analysis.
message us.


GRT SEEMS READY TO BOUNCE FROM THE RETEST AND MA200I am waiting a bounce after the confirmation with the upper line of the parallel channel. This line also holds MA200 support in this time frame. There is also a strong support behind the upper line of parallel channel. The price may touch there and then bounce.
RSI indicator is also following the trend. Touching the RSI trend line is possible. However the RSI value seems already low. Hence this level of RSI supports a bounce, too.

GRT Pennant breakout - uptrend still valid If we were to break 1.90 with strong pressure it would've been back down to retest. We had a CLEAR EXPLOSIVE BREAKOUT. Resume trajectory to the moon .
Long Live The Graph
_________________________________________________________
If you have a good GPU, consider mining vertcoin with the one click miner. It is an easy process and vertcoin is on an uptrend. vertcoin.org
send vert : VtMbtCWZX7pxkDycn2j5XtEWsvBDQL9vyk
send graph: 0xb1432062d4a8FD975d4bd526F33870134E99F366

$GRT at $6.9420 is what stares back from the abyss.When you look into the abyss, what stares back? $GRT at $6.9420 stares back and you smile. Life is actually fair.


GRTUSDT, new opportunity to growth, THE GRAPH. UPDATE v2.Hello my friends. This is an update of GRT for you. As you can see on the chart, finally the breakout happened and pullback is on. So If pullback is approved, I expect growth to the first target. Good luck.
If you like the idea, do not forget to support with a like and follow me for next analysis :)
Write your comment and opinion below for me

GRTUSDTHello to you all. Mars Signals team wishes you high profits at all times.
We have left a shopping area for you dear ones, which can be said to be a good shopping area for the specified targets.
Warning: This is just a suggestion to you and we do not guarantee profits.
Wish you luck!

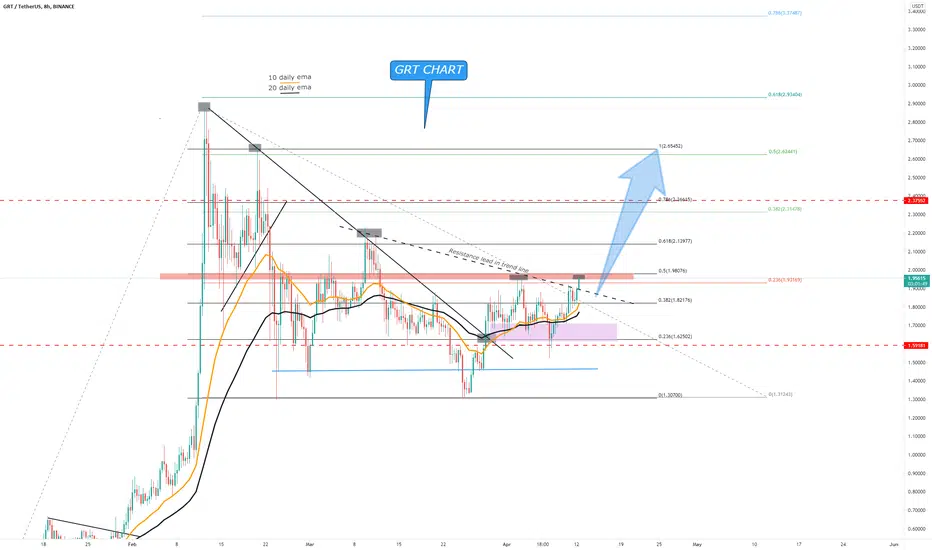
GRT.USDT (Y21.P2.E1).Time to jump inHi Traders,
If you haven't accumulated in this purple zone, then here is your last chance under this red resistance level.
Observations:
2 Trend lines broken with the current red layer as the last main resistance level with confluence at another fib level;
Daily 10 and 20 ema below acting as support;
Hence looking for consolidation below the red resistance layer or a decisive break through it to retest and move up as an entry point
All the best,
S.SAri
🔥 GRT Bullish Price ActionAfter a long slumber, it seems that GRT has finally woken up and is ready to resume its path towards the $3 resistance. The break of the top resistance of the channel is a great buy signal.
Seeing that a large part of the crypto market has seen very strong gains lately, GRT is due to a positive correction. Potentially targeting the current ATH in the near future.
Happy trading!


