GRT Breakout and Back TestThis 4hr chart shows The Graph (GRT) breaking out of a large consolidation.
For me, this is a bull flag with a nice back test of support. The target for this break out is about $4.27.
I think GRT has great upside potential because it is similar to LINK in one key way...it will become a critical component of the cryptoverse infrastructure.
Owhooooo!
GRT


GRTUSDTNext one chart look great.
I set the SL close to entry price - the reason is that I´ve open a couple of trades. You can set SL under trend line (1,5 usd) and manage it after the TP´s will be reached.
Again nice RRR.
Take care and enjoy the weekend.
LbL_CZ

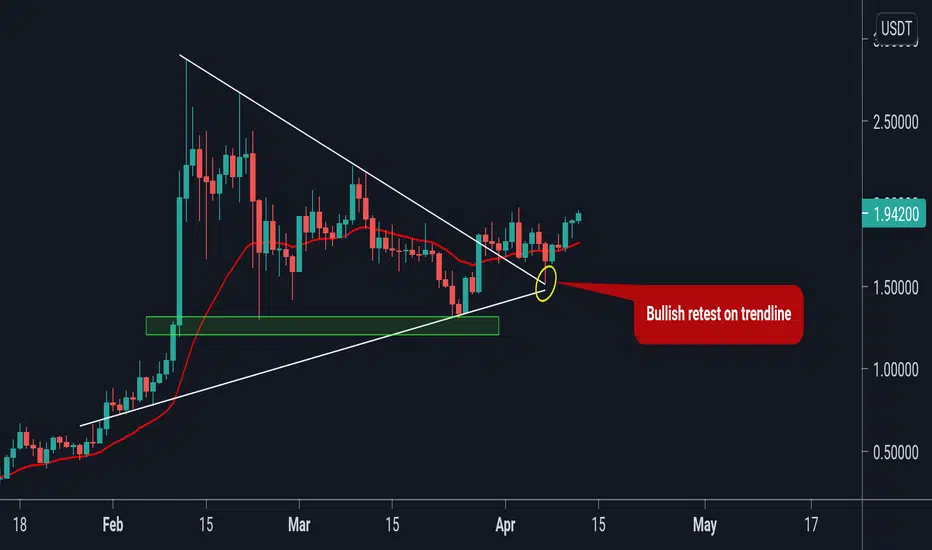
GRT finally time to growth ?GRT / USDT
Chart looking bullish
This is a bit late alert as our buy area was n 1.8$-1.6$
but i think its still has more room for growth :
Bullish restest on trendline
Hold above ma20
Accumulation volume
Inverse h & s in small time frames
Bullish macd
Invalidation : breakdown of 1.5$
Good luck

GRTUSDT Triangle Formation GRTUSDT (30M Chart) Technical Analysis Update
Waiting for the triangle Breakout
GRT/USDT currently trading at $1.85
Buy-level: Above 1.87 (only buy if 30m candle closes above the triangle)
Stop loss: Below $1.80
Target 1: $1.91
Target 2: $1.97
Target 3: $2.08
Target 3: $2.19
Max Leverage: 4X
ALWAYS KEEP STOP LOSS...
Follow Our Tradingview Account for More Technical Analysis Updates, | Like, Share and Comment Your thoughts.

GRT - SPOT SIGNALGRT/USDT
Entry price : $1.8 - $2
Target 1: $3.4
Target 2: $5.4
Target 3 : $8.5
SL : Update


grtusdtgrt retesting the support level
hold this level might start a bullish trend
grt need to break out RSI resistance to pamp
targets on the chart.

GRRRT and RRR 9.8Guys, when printers go **🖨️BRRR🖨️** then crazy goes GRRRT. It's pumpseason and I would say that the Graph is going to have another pump soon!
GRT is trying to break up this triangle, and if successful I think there is chance for run to 3.32 and even more. 😊
SL: range low
TARGET: height of the triangle projected from midpoint of the local range (RANGE HIGH - RANGE LOW)
RRR: 9.8
INVALIDATION: when SL level hit
Like & Enjoy!

Descending Triangle Breakout and RetestWe are still bullish ---> Descending Triangle Breakout + Retest and good support = 2.80$ soon or later just HODL

#GRT buy on #binance futuresThis looks to me like a AB=CD harmonic pattern. Price target is based on the retracement level. Not FinCrypt advice. Always DYOR.

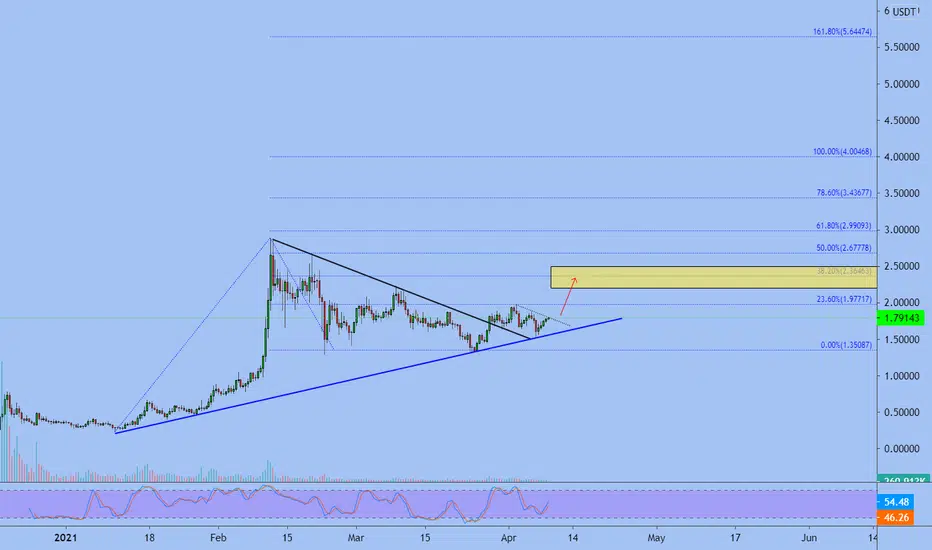
GRT USDT IdeaGrt broke up from this descending triangle with increasing the volume and now 0.236 fib level acting as support after backtesting
so as long as this level holds as support it will go higher
also, there is a hidden bullish divergence in rsi (Daily Timeframe)
There is a bullish cross in macd as well (Daily Timeframe)


GRT/USDT nice rangeGRT seems to be in a downward trend...
look for a test of the bottom trend line for entry point...
Sell at the top trend line...

Graph - GRT GRTUSDT Touched trend line two time and break ou resistance line (black)
We can go to 50-61.8% level fibonacci
GRT still waiting for daily close aboveStill waiting for the daily close above the upper channel's descending trend line/flag.
We touched the trend line drawn from back in Jan 2021 and respected it beautifully with a wick back up. This level was also around the 0.618 fib.
Short term targets once broken for leveraged positions will be as indicated by the two wicks TP1 1.974 & TP2 2.22 as indicated by the horizontal rays.
Once we see this break, it's go time.


GRT LONG? Eliot ? Hello ;
Will GRT follow Eliot? Technically, the purchase area has been entered. Purchase can be attempted from these regions.
Merhaba ;
GRT Eliot u takip edecek mi ? Teknik olarak alım bölgesine girildi Bu bölgelerden alım denenebilir.

GRTUSDT (GRT) - BUY ENTRY ANALYSIS 🔎
- GRTUSDT was bounded in the descending triangle (DT) pattern.
- Price brokeout above the descending triangle's inclined resistance.
- This is a bullish signal.
- The market hit a swing high and retraced.
- Price is retesting the descending triangle's inclined resistance and the key fibonacci retracement zone (0.5 - 0.618 - 0.786).
-There's a relatively high concentration of buyers at this zone.
- The retracement is resisted by the descending trendline resistance (DTR).
- A breakout above this descending trendline resistance could be a bullish signal.
BUY ENTRY ⬆️
- Stop limit entry : breakout above the descending trendline resistance.
- Limit entry : the key fibonacci retracement zone (0.5 - 0.618 - 0.786).
TARGETS 🎯
- Horizontal resistance level (R1).
- Horizontal resistance level (R2).
SETUP INVALIDATION ❌
- Breakdown below the 0.786 fibonacci retracement level.
