We could see a break out to the upside on GRT.Looking at the graph, the potential to the upside could definitely be very soon.
GRT

GRT/USDT moon Barrier being tested!If GRT/USDT can close the hourly above the moon barrier i can see massive gains of upto 60% as long as bitcoin plays nice...
it is trying to break out as i upload this so fingers crossed.
if it cannot break out i can see consolidation for a day or 2 around the upper support level, potentialy another retest of the legacy trend line, this would be a great buy opportuinity.


GRT Friday Fake-outIf GRT breaks down Friday leading into the weekend this is what I would be prepared for... If this happens I expect GRT to pump hard until Sunday, when I think Bitcoin will pump. Not financial advice. Good luck traders.

GRT/USD Analyshere we a head and shoulder pattern that is saying us the bearish trend is going to be end here
so if the price can break the neckline we can complete our long orders
but if we had 4h or D1 close candle below the SL line we should close our orders.
i will be happy to know your ideas about this. COINBASE:GRTUSD


GRTUSDT, new opportunity to growth, THE GRAPHHello my friends, like always everything is clear on the chart for you. Here we have two patterns, the triangle and the head and shoulders. So keep your eyes on the circle, If the price completes the pattern, first target will be activated and then the second target which is 3.8 $. Good luck.
If you like the idea, do not forget to support with a like and follow me for next analysis :)
Write your comment and opinion below for me

GRT looking to breakout of channel.GRT is currently sitting nicely at the top of this channel.
If it breaks up, entry will be at retest of approx $1.85. with a SL underneath the upper channel limit.
My indicators are starting to look bullish again on the daily and 4H timeframes, so potentially a breakup here.
Happy Trading.

GRTBTC - Another possible good opportunity! Not financial advice but someone sharing his trading diary! - Make your own plans and you will do fine in the long run.
I am accumulating GRT in this zone and waiting to take profits on the next impulsive wave.
I believe this is a pretty simple/straightforward setup with a good risk/reward ratio.
Don't forget to take profits and trade level by level => Risk 1% of trading portfolio
#grtbtc #grt #altcoin #crypto

Great trade🔥Have a good and profitable day, wolves🔥
There is an interesting formation on crypto market for you.
Symmetrical triangle on GRTUSDT.
Previous bullish trend was broken and price started to fall. It may be a good signal for bears.
According to Elliott Waves theory Wave D is done and now the price is heading to Wave E.
Follow the chart and look for the breakout carefully.
_____________________________________________________
If you enjoy my FREE Technical Analysis , support the idea with a big LIKE👍 and don't forget to SUBSCRIBE my channel, you won't miss anything!
Feel free to leave comments✉️
And always remember: "we don't predict, we react".


The graph grand master deep insight by matin taherzadeh-Hello everyone
GRT (the graph) looks pretty through its consolidation. So let’s make an deep insight on it.
Between March 23th-28th grt/usdt pair made inverse head and shoulder pattern on 4H time frame not shown on analysis sheet but is obvious, the token completed and confirmed the pattern with the long thick 28th March daily candle. Moreover, in confluence with this, grt broke above the moving average showing us it’s possible too make it bullish.
RSI trendline has broked and the money flow index create bullish scene on Daily time frame.
Another interesting factor about the token is a HVN zone followed by decreasing bar length shown in the analysis sheet.
If the bulls can hold the price above moving average, they will plan an powerful attack to the red zone and then to the last line of defense of bears in 2.2877$ and if can break it, the price of this token retest the high of the swing in 2.89$ and rally to the 3.82$ Will be in the instruction.
Please do your own research before any trade and just believe in your decision for risk management requirements.
The recommended stop loss for this analysis is a rectangle with the high of 1.39$ And the low of 1.35$ and if price broke below the stop loss’s zone low, the analysis become invalid.
Hope you joy from this analysis and with that: happy trading ;)

GRTUSDT To The Moon!GRTUSDT (4H CHART) Technical Analysis Update
GRT /USDT currently trading at $1.70
Buy-level: $1.68 - $1.70
Stop loss: Below $1.45
Target 1: $2.00
Target 2: $2.45
Target 3: $2.85
Target 4: $3.00
Max Leverage: 3X
ALWAYS KEEP STOP LOSS...
Follow Our Tradingview Account for More Technical Analysis Updates, | Like, Share and Comment Your thoughts.


GRT/USDT very bullishGRT has just broken out of a legacy down trend, had a perfect retest of the same trend line and has just retested again off another level of resistance flipped to support...
I see only upside for GRT if bitcoin plays nice...
Happy trading!
WATCH LIST
COTI
THETA/TFUEL
DEGO
XVG
CRV
CAKE

🔥 GRT Potential Bull-Flag BreakoutLike a lot of coins, GRT has been trading inside a descending channel for around 6 weeks now. The most recent bullish push from BTC launched GRT towards the top of the channel, breaking out slightly.
Before entering the trade, wait for confirmation that GRT has actually left the channel.
Happy trading!

GRT/USDT — Potential Triangle — Target $3+- Keeping an eye on GRT here for this potential triangle to play out.
- Wave C could reach a bit lower, maybe as low as the S1.
- Entered at the 4H bullish divergence. Will add more if we flip this orange resistance.
- Target $3.10-$3.35.
- Need BTC/ETH to behave.

GRT Crossed Up the Dynamic Resistance LineGRT broke the dynamic resistance line. Two short-term profit levels have been shown in the chart.
*No financial advice


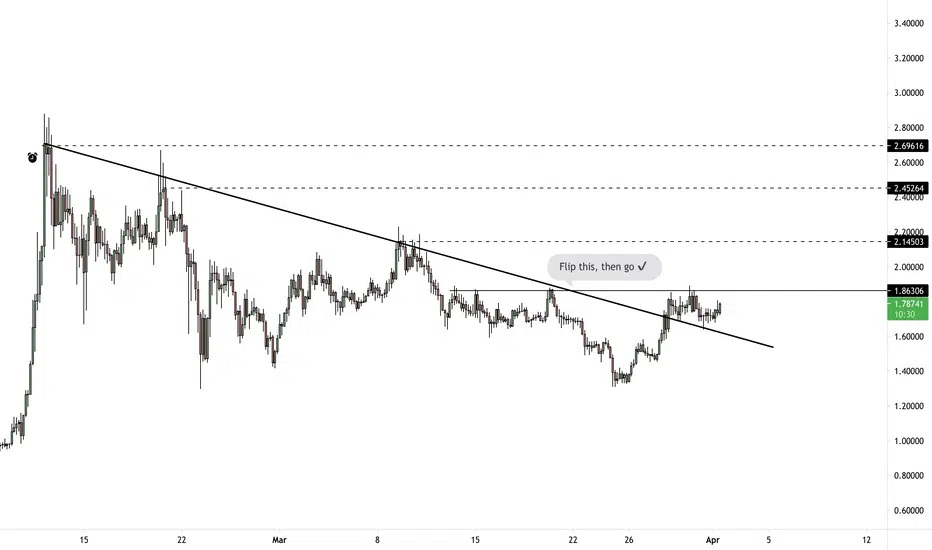
GRT-12h. Ambiguous situation and the likelihood of growth to 3.5For almost a month and a half, the GRT market is undergoing a correction of the previous powerful growth wave. In the range of $1.3-1.35 , buyers organized a liquid zone, from which the GRT price has already bounced twice. However, starting from February 24, trading volumes fell sharply and we cannot say with certainty that there is a strong buyer in this price zone.
At the moment, buyers are trying to break through the local downward trend. The price is at the upper trendline, from which it has rebounded twice already.
Now the situation is not very predictable and it is worth waiting for either a confident breakdown of $1.86 , or a rebound in the GRT price from the upper trend line of the channel.
If buyers manage to test $2.15 and then hold the range of $ 1.65-1.7, we will expect a renewal of the historical maximum and a test of the mark of $ 3.5.
However, do not forget about the alternative scenario . If buyers within this attack fail to break through the upper trend line of the falling channel, a triangle with a flat bottom will form on the chart:
In this case, we will expect a breakdown of this triangle downward with a probable final target of $0.8. If this scenario starts to be implemented, we will make a new idea, since $ 0.8 is the most negative goal that can be within this scenario.
___________________________
We create both short-term ideas (for a local understanding of the market situation) and medium-term forecasts of price movements.
Subscribe to us and get daily concise analytics!

GRT what I see 4h ChartI just wanted to share my idea for GRTUSDT base on my BTC Bitcoin forecast
This is just my personal opinion, I don't have any market background, this is just based on the facts i know about the market for now and what i see in the chart.
I'm doing this kind of charts for 2 weeks now, keep this in mind too.
