GTC good to shortThe price declines after a pump in a falling wedge, a good deal for a fall can be obtained
GTCUSDT

GTC coin could be headed to $40GTC coin had a successful breakout of the symmetrical triangle, which resulted in a +150% gain in a single day. After that it just completed a full retrace of the breakout, now now the breakout looks like a potential bull flag, which could send it up to $40.
Not financial advice, do your own research and make your own decisions.

GTCUSDT RETEST AFTER BREAKOUTGTC/USDT
After impulse , this time for retest
Dont missing out
Lets Catch it !
Goodluck!!

GTCUSDT WILL PUMP SOONGTC ( Daily Chart ) - Technical Analysis
Hello Guys, don't forget with this coin for ALT Season.
Everything clear on the chart, look how beautiful the price succesful holding the trend with keep it stay making lower high
I expecting this coin will pump soon
Entry Point :
7-5 - 8.0
Target 1 - 9.00
Target 2 - 10.40
Target 3 - 11.20
Target 4 - 12.00
Target 5 - 15.00
Stop Loss : 6.00
Keep in mind leverage trading can be highly risky, trade with not more than 5% of your funds in leverage trades.
*Not financial advice.
If you want me to share these trades here, hit the like button and share your views in the comment section.

GTCUSDT - Dont't Miss This!Long Entry Idea for GTC :
Entry point : 16.020 - 15.019
Profit Target : 23.869 - 29.086 - 34.883
Stop Loss below 0.786 Fibo retracement or keep your stop loss tight.
This is not financial advice, im just share my outlook on this chart.
Good Luck!

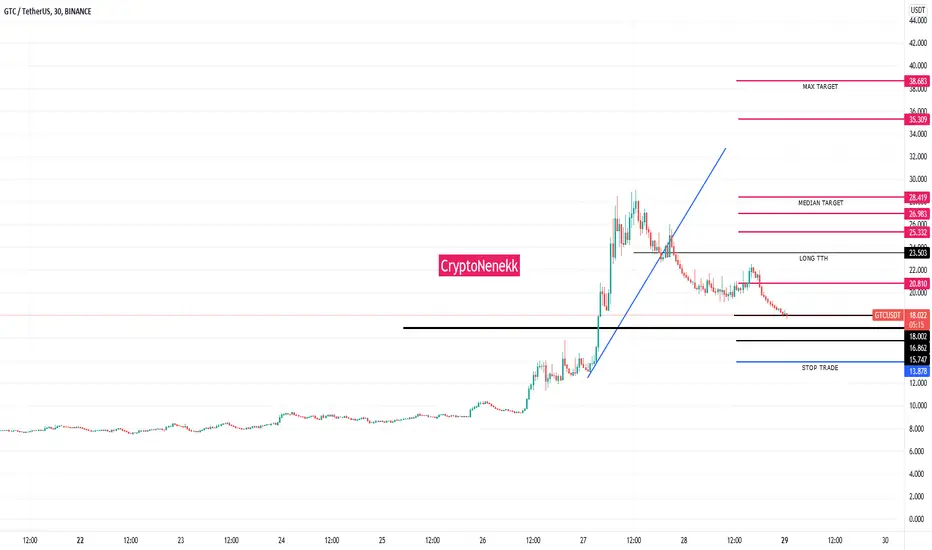
GTCUSDTGTCUSDT Limit Order
LONG Buy In Good Part
Leverage: Cross (20.0X)
Entry Orders:
1) 15.747-16.862-18.002
Take-Profit Orders:
1) 20.810
2) 25.332
3) 26.983
4) 28.419
5) 35.309
6) 38.683
Stop-loss Orders:
1) 13.878
KEEP DESCLAIMER ON
GTC Global Trust Coin LONG Opportunity 20211127Set Alert:
Red -> Green / Blue
Context: Green
More Detail:
DISCLAIMER
This is only a personal opinion and does NOT serve as investing NOR trading advice.
Please make your own decisions and be responsible for your own investing and trading Activities.

₿ GTCUSDT 1W ₿ : 28.Nov.2021 (GTC) Log☑️ Results : +162% ✅
🔥 ALL TARGETS REACHED 🔥
Follow our other analysis & Feel free to ask any questions you have, we are here to help .
⚠️ This Analysis will be updated ...
👤 Arman Shaban : @Ar_M_An_4
📅 28.Nov.2021
⚠️(DYOR)
❤️ To give us energy and motivation , please like and leave a comment. ❤️

GTC made the move and now ? GTC exploded yesterday into the first targets established with Fibo retracement/Extension.
Currently between the 1.3 and 1.45 extension with 1.618 as un top arround 30$.
Prices could go into some consolidation between 21.45$ and 26$, if the support at 21$ hold we could see a move going into 30$ and 44$ top target for now at 70$.
I wouldn't recomande to go long after a coin is 100%+ up but as an intrady trade we can play the momemtum and target another 20/30% move.
For the one that are long since under 10$ i would let it run as there is some serious potentiel for this coin to go into the 100$ mark on long term.

GTCUSDT - Long SignalBuy NOW + Block.
SL - Trigger 1D (Close 1D candle below)
When TP is triggered, SL is transferred to the breakeven

GTC USD $28 TargetGTC is a buy for me
Intial Target $19 then overextension to $28 with BTC breakout
Late Bloomer
Fibs because Fibs

GTCUSDT The best opportunity to enterGTCUSDT trade analysis will give two potential entry points to enter for long position. I have highlighted supply zone areas in the chart. You can enter in either point.

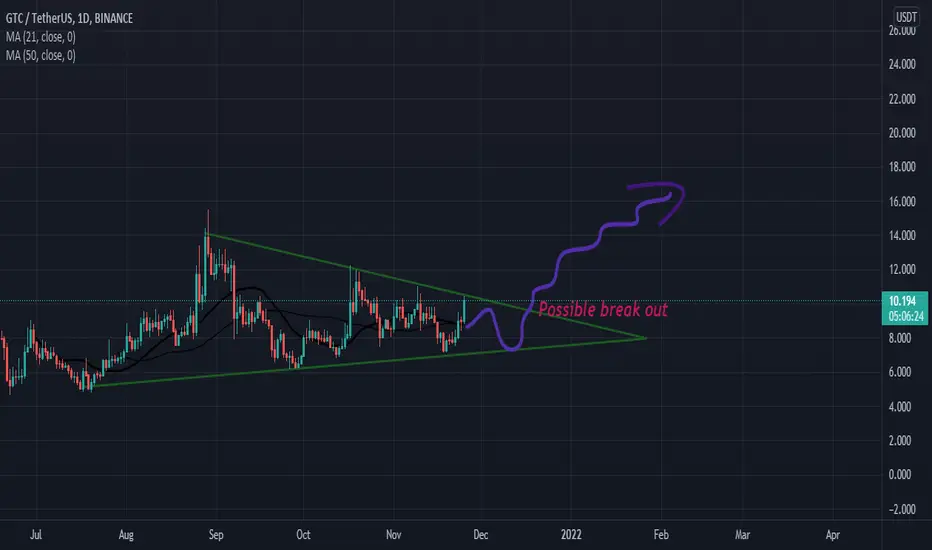
GTCUSDT - Triangle PatternGTCUSDT (1D Chart) Technical analysis
GTCUSDT(1D Chart) Currently trading at $11
Buy level :Above $10.5
Stop loss: Below $7.5
TP1: $12.5
TP2: $15.5
TP3: $18
TP4: $24
Max Leverage 2x / Spot market
Always keep Stop loss
Follow Our Tradingview Account for More Technical Analysis Updates, | Like, Share and Comment Your thoughts.

GTCUSDT is trying to break the triangle .GTCUSDT is trying to break the triangle. I there it decides that what is going to happen. It may break or back towards the support.
GTC fifty-fifty chance to break out or retest. So always wait for the confirmation guys before jumping into any trades.
Always use stop-loss.
Thanks and Happy Trading.
#gtc #GTCUSDT #cryptocurrency
GTCUSDTGTCUSDT has the capacity of touching the mentioned upper levels. Everything is on the chart. If you are short term trader, you can take your profit whenever you are in profit.

GTCUSDT forming a falling wedge patternDisclaimer on,
This is a personal opinion, I am not responsible for your trading results.
Trade with your own risk.
GTC formed a falling wedge pattern on the M30 time frame, the upside target is at USDT 11,485 with a stop loss area at USDT 10,445. An entry can be made when the price is able to break above the USDT 10,635 level. In addition, the EMA (exponential moving average) 90 is also become a dynamic support that can be taken into account to bounce prices back up. The Risk to Reward ratio given is 1:4, I think it is worth considering.

GTC Bullish potentialGTC is in what could looks like an accumulation range and currently on the top part of this range.
Prices have seen an increase in volumes entering and breaking the 9$ mark which is a strong area. The MACD is also well oriented.
The GTCBTC in daily is also looking like it could start an uptrend, Anything between current price and 8.2$ area should be seen as a buy opportunity targeting 13$ as a 1st TP in the coming months.

Short term pop incomingmy chart says popit
support box1 filled
support box 2 tapped and looking to grab final limit buys

GTC/USDT BUY SIGNALNice RR is offered especially after the price bounced off the Fibonacci retracement level. Expecting a fast upside swing...

GTCUSDTANALYSIS 🔎
- GTC/USDT is testing the trendline pattern. IN A GOOD S/R ZONE
- There's a breakout potential.


GTCUSDT LONG Prefect head and shoulder pattern seen here in GTCUSDT after fighting the support level we should be seeing a move to $17 .

GTCUSDTsee and watch :)
The resistance range is broken and it seems it can move up to the specified range ...
