Mastering Buy Side and Sell Side Liquidity - How to trade it!In trading, understanding liquidity is one of the keys to predicting where the market might go next. The Inner Circle Trader (ICT) method teaches traders how to recognize where big players like banks and institutions are likely to enter or exit trades. Two important ideas in ICT trading are buy side liquidity and sell side liquidity. Once you understand what these terms mean and how to spot them on a chart, you can start using them to find better trading opportunities.
What will be discussed?
- What is Buy Side Liquidity?
- What is Sell Side Liquidity?
- How do you see Buy and Sell Side Liquidity?
- Examples
- How to trade BSL and SLL Liquidity?
What is Buy Side Liquidity
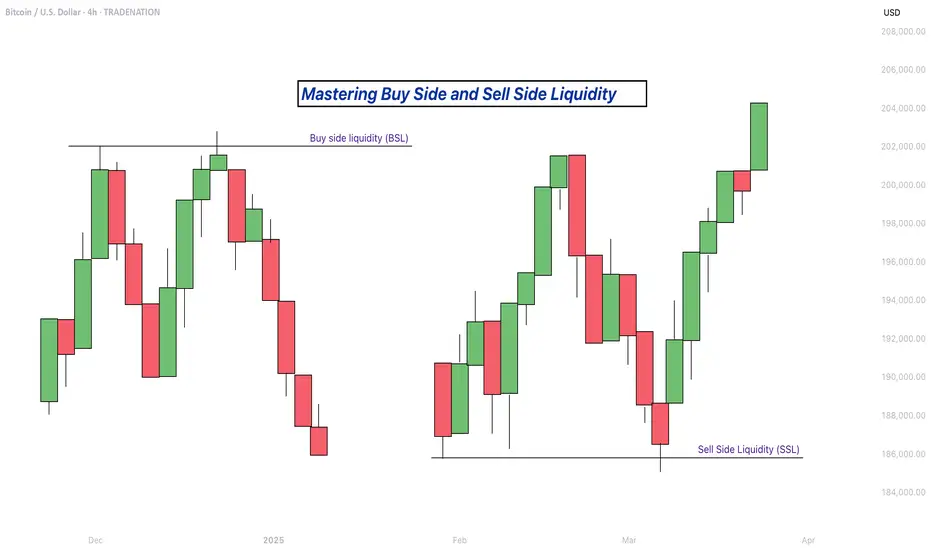
Buy side liquidity is found above market highs. It refers to all the stop loss orders from people who are holding short positions. When the market is going down, some traders sell (or go short) and place their stop losses above recent highs to protect themselves. These stop losses are actually buy orders because closing a short position requires buying. Big institutions know this, so they push price upward to trigger those stop losses and grab that liquidity. That’s why you’ll often see the market spike above a recent high before reversing. That spike is the market grabbing buy side liquidity.
What is Sell Side Liquidity
Sell side liquidity is the opposite. It’s found below recent lows. This is where traders who are buying (going long) place their stop losses. If someone buys a market, they’ll usually put a stop loss just below a previous low. That stop loss is a sell order. Smart money looks at these areas as pools of sell side liquidity. So when the market moves down quickly and breaks a recent low, it’s likely collecting those sell stop orders. After that, you’ll often see a reversal because the liquidity has been taken.
How do you see Buy and Sell Side Liquidity?
You can spot buy side and sell side liquidity by looking at the chart and identifying recent highs and lows where many traders might have placed stop losses. These are usually obvious swing highs and swing lows. If you look at a chart and see a clean high where price previously reversed, that’s likely where traders are placing stops. That makes it a target for buy side liquidity. Same for a recent low, if it’s a clean level where people might have bought in the past, that low probably holds sell side liquidity. The more obvious the level looks, the more likely it’s full of stops and therefore a liquidity target.
Examples
How to trade BSL and SLL Liquidity?
Trading liquidity means watching for the market to run above a recent high (to take buy side liquidity) or below a recent low (to take sell side liquidity), and then looking for signs of reversal. Once liquidity has been taken, the market often changes direction.
When you’re trading the ICT concept of liquidity, the key is not just spotting where liquidity lies, but also knowing when price is likely to reverse after that liquidity has been taken. Reversals don’t happen randomly, they leave clues on the chart. Here’s how you can recognize those signs in a simple way:
1. Market Structure Break
This is one of the clearest signs of a reversal. Let’s say the market grabs sell side liquidity by breaking below a recent low. If price then quickly starts moving up and breaks above the last lower high, that’s a break in structure. It shows that sellers are losing control and buyers are stepping in. It’s the first confirmation that the direction might be changing.
2. Rejection Wicks or Strong Candles
After price runs into liquidity (above a high or below a low), watch the candlesticks closely. If you see a long wick rejecting the level, or a strong candle in the opposite direction right after the liquidity grab, that’s a clue. It means price went there, collected the orders, and got rejected fast. That rejection shows the market might be reversing.
3. Fair Value Gaps (FVGs)
Fair value gaps are small “windows” left in price when it moves quickly in one direction. After liquidity is taken and price starts reversing, it often leaves an FVG behind. If price pulls back into that gap and holds, that can be a great entry point. FVGs act like magnets and support zones in ICT.
4. Displacement
Displacement is a strong, impulsive move that breaks structure. It usually happens right after liquidity is taken. If price moves very fast in the opposite direction after hitting a liquidity level, that’s a good sign smart money is behind the move and it’s not just random noise. That strong push is a hint that a new trend might be forming.
5. Change in Character (CHOCH)
This is a shift in how the market behaves. For example, price might be making lower highs and lower lows (a bearish trend), but after liquidity is taken, it suddenly starts making higher highs and higher lows. That change in character tells you the trend might be reversing.
-------------------------
Disclosure: I am part of Trade Nation's Influencer program and receive a monthly fee for using their TradingView charts in my analysis.
Thanks for your support. If you enjoyed this analysis, make sure to follow me so you don't miss the next one. And if you found it helpful, feel free to drop a like 👍 and leave a comment 💬, I’d love to hear your thoughts!
Guide
Fibonacci Retracement: The Hidden Key to Better EntriesIf you’ve ever wondered how professional traders predict where price might pull back before continuing... the secret lies in Fibonacci Retracement.
In this post, you’ll learn:
What Fibonacci retracement is
Why it works
How to use it on your charts (step-by-step)
Pro tips to increase accuracy in the market
🧠 What Is Fibonacci Retracement?:
Fibonacci Retracement is a technical analysis tool that helps traders identify potential support or resistance zones where price is likely to pause or reverse during a pullback.
It’s based on a mathematical sequence called the Fibonacci Sequence, found everywhere in nature — from galaxies to sunflowers — and yes, even in the markets.
The Fibonacci sequence is a series of numbers where each number is the sum of the two preceding ones, starting with 0 and 1. The sequence typically begins with 0, 1, 1, 2, 3, 5, 8, 13, and so on. This pattern can be expressed as a formula: F(n) = F(n-1) + F(n-2), where F(n) is the nth Fibonacci number.
The key Fibonacci levels traders use are:
23.6%
38.2%
50%
61.8%
78.6%
These levels represent percentages of a previous price move, and they give us reference points for where price might pull back before resuming its trend and where we can anticipate price to move before showing support or resistance to the trend you are following.
💡Breakdown of Each Fib Level:
💎 0.236 (23.6%) – Shallow Pullback
What it indicates:
Weak retracement, often signals strong trend momentum.
Buyers/sellers are aggressively holding the trend.
Best action:
Aggressive entry zone for continuation traders.
Look for momentum signals (break of minor structure, bullish/bearish candles). Stay out of the market until you see more confirmation.
💎 0.382 (38.2%) – First Strong Area of Interest
What it indicates:
Healthy pullback in a trending market.
Seen as a key area for trend followers to step in.
Best action:
Look for entry confirmation: bullish/bearish engulfing, pin bars, Elliott Waves, or break/retest setups.
Ideal for setting up trend continuation trades.
Stop Loss 0.618 Level
💎 0.500 (50.0%) – Neutral Ground
What it indicates:
Often marks the midpoint of a significant price move.
Market is undecided, can go either way.
Best action:
Wait for additional confirmation before entering.
Combine with support/resistance or a confluence zone.
Useful for re-entry on strong trends with good risk/reward.
Stop Loss 1.1 Fib Levels
💎 0.618 (61.8%) – The “Golden Ratio”
What it indicates:
Deep pullback, often seen as the last line of defense before trend reversal.
High-probability area for big players to enter or add to positions.
Best action:
Look for strong reversal patterns (double bottoms/tops, engulfing candles).
Excellent area for entering swing trades with tight risk and high reward.
Use confluence (structure zones, moving averages, psychological levels, Elliott Waves).
Wait for close above or below depending on the momentum of the market.
Stop Loss 1.1 Fib Level
💎 0.786 (78.6%) – Deep Correction Zone
What it indicates:
Very deep retracement. Often a final “trap” zone before price reverses.
Risk of trend failure is higher.
Best action:
Only trade if there's strong reversal evidence.
Use smaller position size or avoid unless other confluences are aligned.
Can act as an entry for counter-trend trades in weaker markets.
Stop Loss around 1.1 and 1.2 Fib Levels
⏱️Best Timeframe to Use Fibs for Day Traders and Swing Traders:
Day trading:
Day traders, focused on capturing short-term price movements and making quick decisions within a single day, typically utilize shorter timeframes for Fibonacci retracement analysis, such as 15-minute through hourly charts.
They may also use tighter Fibonacci levels (like 23.6%, 38.2%, and 50%) to identify more frequent signals and exploit short-term fluctuations.
Combining Fibonacci levels with other indicators such as moving averages, RSI, or MACD, and focusing on shorter timeframes (e.g., 5-minute or 15-minute charts) can enhance signal confirmation for day traders.
However, relying on very short timeframes for Fibonacci can lead to less reliable retracement levels due to increased volatility and potential for false signals.
Swing trading:
Swing traders aim to capture intermediate trends, which necessitates giving trades more room to fluctuate over several days or weeks.
They typically prefer utilizing broader Fibonacci levels (like 38.2%, 50%, and 61.8%) to identify significant retracement points for entering and exiting trades.
Swing traders often focus on 4-hour and daily charts for their analysis, and may even consult weekly charts for a broader market perspective.
🎯 Why Does Fibonacci Work?:
Fibonacci levels work because of:
Mass psychology – many traders use them
Natural rhythm – markets move in waves, not straight lines
Institutional footprint – smart money often scales in around key retracement zones
It's not magic — it's structure, and it's surprisingly reliable when used correctly.
🛠 How to Draw Fibonacci Retracement (Step-by-Step):
Let’s say you want to trade XAU/USD (Gold), and price just had a strong bullish run.
✏️ Follow These Steps:
Identify the swing low (start of move)
Identify the swing high (end of move)
Use your Fibonacci tool to draw from low to high (for a bullish move)
The tool will automatically mark levels like 38.2%, 50%, 61.8%, etc.
These levels act as pullback zones, and your job is to look for entry confirmation around them.
🔁 For bearish moves, draw from high to low. (I will show a bearish example later)
Now let’s throw some examples and pictures into play to get a better understanding.
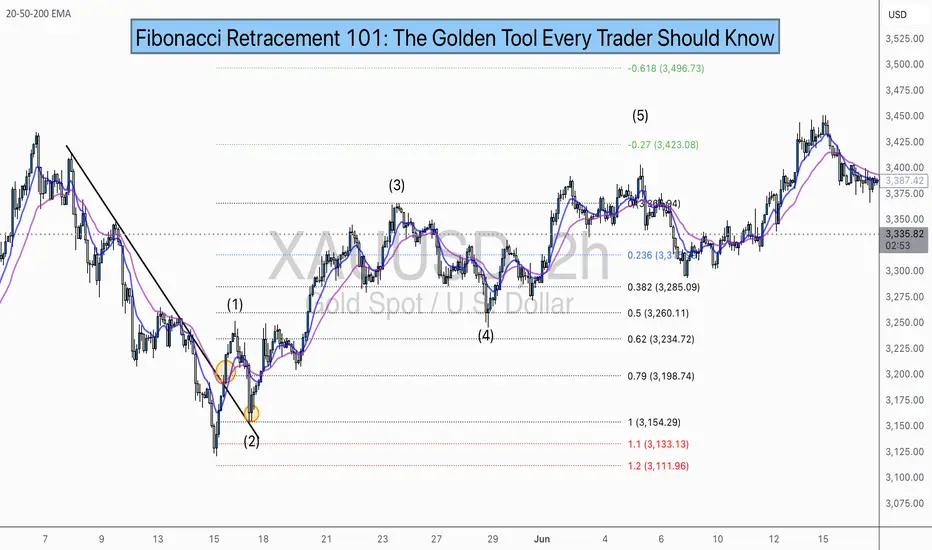
📈 XAU/USD BULLISH Example:
1.First we Identify the direction of the market:
2.Now we set our fibs by looking for confirmations to get possible entry point:
Lets zoom in a bit:
Now that we have a break of the trendline we wait for confirmation and look for confluence:
Now we set our fibs from the last low to the last high:
This will act as our entry point for the trade.
3. Now we can look for our stop loss and take profit levels:
Stop Loss:
For the stop loss I like to use the fib levels 1.1 and 1.2 when I make an entry based upon the 0.618 level. These levels to me typically indicate that the trade idea is invalid once crossed because it will usually violate the prior confirmations
Take Profit:
For the take profit I like to use the Fib levels 0.236, 0, -0.27, and -0.618. This is based upon your personal risk tolerance and overall analysis. You can use 0.236 and 0 level as areas to take partial profits.
Re-Entry Point Using Elliott Waves as Confluence Example:
This is an example of how I used Elliott Waves to enter the trade again from the prior entry point. If you don’t know what Elliott Waves are I will link my other educational post so you can read up on it and have a better understanding my explanation to follow.
After seeing all of our prior confirmations I am now confident that our trend is still strongly bullish so I will mark my Waves and look for an entry point.
As we can see price dipped into the 0.38-0.5 Fib level and rejected it nicely which is also in confluence with the Elliott Wave Theory for the creation of wave 5 which is the last impulse leg before correction.
🔻 In a downtrend:
Same steps, but reverse the direction — draw from high to low and look to short the pullback.
XAU/USD Example:
As you can see the same basic principles applied for bearish movement as well.
⚠️ Pro Tips for Accuracy:
✅ Always use Fib in confluence with:
Market structure (higher highs/lows or lower highs/lows)
Key support/resistance zones
Volume or momentum indicators
Candle Patterns
Elliott Waves, etc.
❌ Don’t trade Fib levels blindly — they are zones, not guarantees.
📊 Use higher timeframes for cleaner levels (4H, Daily)
💡 Final Thought
Fibonacci retracement doesn’t predict the future — it reveals probability zones where price is likely to react.
When combined with structure and confirmation, it becomes one of the most reliable tools for new and experienced traders alike.
🔥 Drop a comment if this helped — or if you want a Part 2 where I break down Fibonacci Extensions and how to use them for take-profit targets.
💬 Tag or share with a beginner who needs to see this!
Mastering supply and demand zones - how to use it in trading?Supply and demand zones are key concepts in technical analysis used by traders to identify potential price reversal areas on a chart. They are based on the idea that prices move due to an imbalance between buyers (demand) and sellers (supply).
-------------------------
What will be discussed?
- What are supply and demand zones?
- How to detect supply and demand zones?
- Examples from supply and demand zones?
- How to trade using supply and demand zones?
-------------------------
What are supply and demand zones?
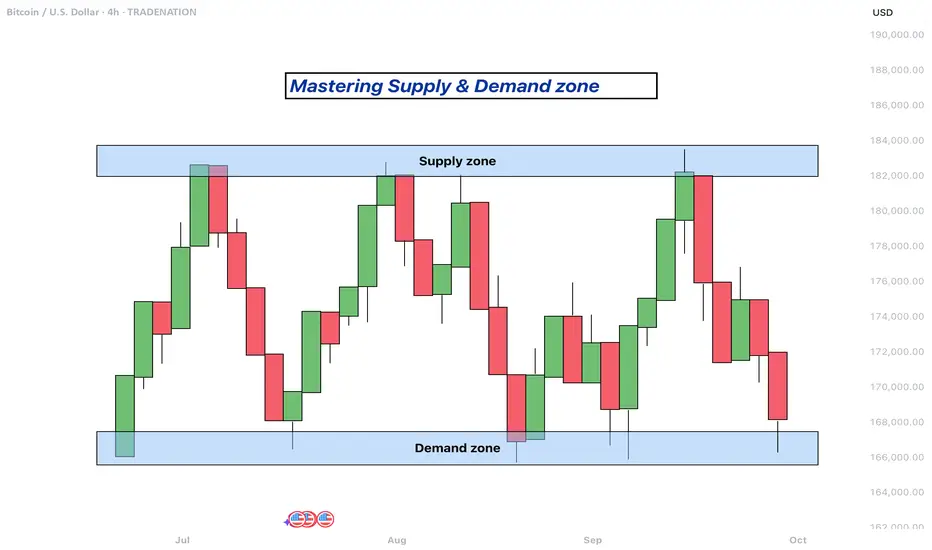
Supply and demand zones are areas on a price chart where the forces of buying and selling are strongly concentrated, causing significant movements in price. In simple terms, a supply zone is an area where selling pressure exceeds buying pressure, often leading to a drop in price. It usually forms when price moves upward into a region where sellers begin to outnumber buyers, pushing the price back down. On the other hand, a demand zone is a region where buying pressure exceeds selling pressure, typically resulting in a rise in price. This occurs when price moves downward into a region where buyers see value and begin to outnumber sellers, causing the price to increase again.
These zones reflect areas of imbalance in the market. In a supply zone, sellers are more eager to sell than buyers are to buy, often due to overbought conditions, news, or fundamental changes. In a demand zone, buyers are more eager to buy than sellers are to sell, often because the price has become attractive or undervalued. Traders look for these zones because they provide clues about where price may reverse or stall, offering potential entries or exits for trades.
-------------------------
How to detect supply and demand zones?
Identifying supply and demand zones involves analyzing price action on a chart, typically using candlestick patterns. A common way to detect a supply zone is to look for a sharp upward move followed by a sudden reversal or strong drop in price. The area where the price stalled before falling sharply is likely to be a supply zone. This zone includes the highest candle body or wick before the drop, and a few candles before it that mark where the selling pressure began.
To identify a demand zone, you would look for a sharp drop in price followed by a strong rally upward. The area where the price paused before rising significantly can be considered a demand zone. Like with supply zones, the demand zone includes the lowest candle before the price reversed and a few candles leading up to it.
These zones are not exact price levels but rather ranges. Price does not have to touch an exact line to react; it often moves within the general area. For more accuracy, traders often refine their zones by identifying them on higher time frames such as the 4-hour or daily chart, then adjusting them slightly on lower time frames like the 1-hour or 15-minute chart.
-------------------------
Examples from supply and demand zones:
-------------------------
How to trade using supply and demand zones?
Trading supply and demand zones involves anticipating how price is likely to behave when it returns to one of these key areas. A common method is to wait for price to enter a zone and then watch for confirmation that it is going to reverse. For example, if price rises into a supply zone, you might look for signs like a bearish candlestick pattern, a drop in volume, or a rejection wick to signal that sellers are stepping in again. This would be an opportunity to enter a short trade with the expectation that price will fall.
Conversely, if price falls into a demand zone, you would wait for bullish signals—such as a strong bullish candle, a double bottom pattern, or clear rejection of lower prices—to confirm that buyers are returning. This would be a potential setup for a long trade, expecting the price to move up from the zone.
Traders often place stop losses just beyond the zone to limit risk in case the level fails. For a supply zone, the stop loss would go just above the zone, while for a demand zone, it would go just below. Targets can be set at recent support or resistance levels, or by using risk-reward ratios like 1:2 or 1:3 depending on the trader’s strategy.
Patience and discipline are important when trading these zones. Not every zone will lead to a reversal, and false breakouts can occur. Therefore, combining supply and demand analysis with other tools such as trendlines, moving averages, or indicators can improve the chances of a successful trade.
In summary, supply and demand zones help traders understand where large buying or selling forces are likely to influence price. By learning to identify these zones and waiting for confirmation signals, traders can enter high-probability trades with clear risk and reward levels.
-------------------------
Disclosure: I am part of Trade Nation's Influencer program and receive a monthly fee for using their TradingView charts in my analysis.
Thanks for your support. If you enjoyed this analysis, make sure to follow me so you don't miss the next one. And if you found it helpful, feel free to drop a like and leave a comment, I’d love to hear your thoughts!
Mastering the Bollinger Bands- How to use it in trading?What is the Bollinger Bands
Bollinger Bands is a popular technical analysis tool developed by John Bollinger in the 1980s. It is designed to measure market volatility and provide signals for potential price reversals or trend continuations. The Bollinger Bands consist of three lines: a simple moving average in the middle, usually calculated over 20 periods, and two outer bands that are placed a set number of standard deviations above and below the moving average. These outer bands automatically adjust to market conditions, expanding and contracting based on price volatility. The indicator is widely used by traders to understand the relative highs and lows of a financial instrument in relation to recent price action.
What will be discussed?
- How does it work with the lower band and upper band?
- What does the narrowing mean?
- What does the widening mean?
- How to trade with the Bollingers Bands?
-------------------------
How does it work with the lower band and upper band?
The upper band and the lower band serve as dynamic levels of resistance and support. When the price of an asset touches or exceeds the upper band, it may be considered overbought, suggesting that a reversal or pullback could be near. Conversely, when the price approaches or breaks below the lower band, the asset may be viewed as oversold, indicating a potential rebound. These bands do not generate definitive buy or sell signals on their own but instead help traders assess market conditions. The interaction of price with the upper and lower bands often provides visual cues about the momentum and direction of the market, allowing for more informed decision-making.
-------------------------
What does the narrowing mean?
The narrowing of the Bollinger Bands occurs when the price becomes less volatile over time. This contraction indicates a period of consolidation or low market activity, where the price is trading in a tighter range. Narrowing bands are often interpreted as a signal that a significant price movement may be coming soon, as low volatility tends to precede high volatility. This phase is sometimes referred to as the "squeeze," and traders closely monitor it to anticipate breakout opportunities. The direction of the breakout, whether upward or downward, is not predicted by the narrowing itself but usually follows shortly after the bands have contracted.
-------------------------
What does the widening mean?
The widening of the Bollinger Bands reflects increasing market volatility. When the price starts to move rapidly either up or down, the bands spread further apart to accommodate this movement. This expansion typically confirms that a new trend is underway or that a breakout has occurred. The wider the bands become, the greater the degree of price fluctuation. During these times, traders may observe stronger momentum in the market, and the continuation of the move may be supported by the growing distance between the bands. However, extremely wide bands may also suggest that a reversal could be nearing, as the market can become overstretched in either direction.
-------------------------
How to trade with the Bollinger Bands?
Trading with Bollinger Bands involves using the bands to identify entry and exit points based on the behavior of price in relation to the upper and lower bands. One common approach is to buy when the price touches or breaks below the lower band and shows signs of bouncing back, and to sell when the price reaches or moves above the upper band and begins to retreat. Another strategy involves waiting for the bands to narrow significantly and then entering a trade in the direction of the breakout that follows. Traders often use Bollinger Bands in combination with other indicators such as RSI, MACD, or volume to confirm signals and reduce the risk of false breakouts. It is important to remember that Bollinger Bands are not predictive on their own but are most effective when used as part of a broader technical analysis framework.
-------------------------
Disclosure: I am part of Trade Nation's Influencer program and receive a monthly fee for using their TradingView charts in my analysis.
Thanks for your support.
- Make sure to follow me so you don't miss out on the next analysis!
- Drop a like and leave a comment!

Understanding Elliott Wave Theory with BTC/USDIntroduction to Elliott Wave Theory:
Elliott Wave Theory is a popular method of technical analysis that seeks to predict the future price movement of financial markets. Developed by Ralph Nelson Elliott in the 1930s, the theory is based on the idea that market movements follow a repetitive pattern, driven by investor psychology.
At the core of Elliott’s theory is the idea that markets move in a 5-wave pattern in the direction of the trend, followed by a 3-wave corrective pattern. These waves can be seen on all timeframes and help traders identify potential entry and exit points in the market.
Key Concepts of Elliott Wave Theory:
1. Impulse Waves (The Trend)
2. These are the waves that move in the direction of the overall trend. They are labeled 1, 2, 3, 4, 5 and represent the price movement in the main direction of the market.
* Wave 1: The initial move up (or down in a bearish market). I like to mark up the first wave how I do my Fibs, from the point where price showed a major impulse.
* Wave 2: A correction of Wave 1 (it doesn’t go lower than the starting point of Wave 1).
* Wave 3: The longest and most powerful wave in the trend.
* Wave 4: A smaller correction in the direction of the trend.
* Wave 5: The final push in the direction of the trend, which can be shorter and weaker than Wave 3.
3. Corrective Waves (The Pullbacks)
4. After the five-wave impulse, the market enters a corrective phase, moving against the trend. This corrective phase is generally a 3-wave pattern, labeled A, B, C:
* Wave A: The initial correction, typically smaller than Wave 3.
* Wave B: A temporary move against the correction (it often confuses traders who think the trend has resumed).
* Wave C: The final move against the trend, usually the strongest and most aggressive.
How to Implement Elliott Wave on BTC/USD:
Let’s break down how you can apply the Elliott Wave Theory to BTC/USD using a simple example.
1. Identify the Trend
2. Start by identifying the current market trend for BTC/USD. Are we in an uptrend or downtrend? This will determine whether you’re looking for a 5-wave impulse up (bullish) or down (bearish).
3. Locate the Waves
4. Look for the five-wave structure in the trend direction. Once you identify a potential impulse move, label the waves accordingly:
* Wave 1: A new uptrend starts.
* Wave 2: A small pullback (usually less than the size of Wave 1).
* Wave 3: A significant surge in price, often the most volatile.
* Wave 4: A smaller pullback or consolidation.
* Wave 5: The final push higher, which might show signs of exhaustion.
5. Corrective Phase
6. After completing the 5-wave impulse, expect a corrective 3-wave pattern (A, B, C). These corrections typically last longer than expected and can often confuse traders.
* Wave A: Price starts to reverse.
* Wave B: A retracement that may confuse traders into thinking the trend is resuming.
* Wave C: A strong pullback that brings the price even lower.
7. Use Fibonacci Levels as confluence
8. One of the most powerful tools in Elliott Wave analysis is Fibonacci retracement levels. You can use these to predict potential levels where Wave 2 and Wave 4 could end, or where Wave C might complete the correction. Common retracement levels are 38.2%-50% for Wave 4, and 50-61.8% For Waves 2 and B but keep in mind, these wave can retrace up to 100% before the wave analysis becomes invalid. But ideally these points are where you look to make an entry.
Wave 2 Example:
This one hit the golden spot (0.5-0.618) perfectly and continued to push upward.
Wave B and C Example:
This example hit closer to the 0.786 level which is also a key level for retracement.
Wave 4 Example:
This one hit the golden spot (0.382-0.5) for Wave 4 perfectly before continue the bullish momentum.
I try to use the RED levels below (1.1 and 1.2) as my invalidation (Stop Loss) levels and the GREEN levels (-0.27 and -0.618) as my Take Profit levels. Depending on your goals you can also use Fib Levels 0.236 and 0 as partial Take Profit levels.
9. Confirm with Indicators
10. To validate your Elliott Wave counts, use other indicators like the RSI (Relative Strength Index), MACD, or Moving Averages. For example, a Wave 3 might occur when the RSI is above 50, indicating strength in the trend.
In this example you can see the RSI cross the 50 threshold and the 3rd Wave form.
Continuation after the Wave is complete:
Tips for Trading with Elliott Wave Theory:
* Stay Flexible: Elliott Wave Theory is not set in stone. If the market doesn’t follow the expected pattern, adjust your wave counts accordingly.
* Don’t Rely on One Timeframe: A 5-wave structure on one timeframe may be part of a larger wave pattern on a higher timeframe. Always analyze multiple timeframes.
* Wave Personality: Waves don’t always look the same as stated earlier. Wave 2 can retrace up to 100% of Wave 1 and Wave 4 should generally not overlap Wave 1 or this may invalidate the Wave structure.
* Risk Management: Always use proper risk management techniques. No theory is perfect, so make sure you have a stop-loss in place to manage your risk.
Conclusion: Using Elliott Wave Theory on BTC/USD:
The Elliott Wave Theory can be a powerful tool for analyzing and forecasting price movements. By identifying the 5-wave impulse and 3-wave corrective patterns, you can gain insights into potential market direction. Just remember to use it alongside other tools and indicators for confirmation, and don’t forget to manage your risk.
As you apply it to BTC/USD or any other asset, remember that the market doesn’t always follow the "ideal" patterns, and flexibility is key. Practice on different timeframes, refine your skills, and use the theory as a part of your overall trading strategy.
Final Thoughts:
If you're just starting, don't get discouraged if you miss a wave or two. Trading is a journey, and with patience and practice, you'll begin to spot these patterns more naturally. Whether you’re analyzing Bitcoin's price action or any other asset, Elliott Wave Theory can give you a deeper understanding of market psychology.
Good Luck and Happy Trading!

Candlestick Patterns - How to read them like a ProOverview
Candlestick charts serve as a cornerstone in technical analysis, presenting price activity in a visually digestible format. By examining how prices move over a given timeframe, traders gain key insights into potential market direction, sentiment shifts, and trend strength.
Mastering candlestick interpretation is essential for identifying bullish or bearish sentiment, as well as for spotting possible trend reversals or continuations. Still, candlesticks alone don’t paint the full picture—using them without broader context increases the risk of false signals.
---
What You'll Learn
What are candlestick charts?
Common bearish candlestick patterns
Common bullish candlestick patterns
How to apply candlestick analysis in trading
---
What is a Candlestick Chart?
A candlestick provides a snapshot of an asset’s price behavior during a specific time interval, whether it's one minute, one hour, or one day. This format allows traders to quickly assess how the price has moved within that period.
Each candle reveals four price points:
* Open – the price at the beginning of the interval
* Close – the price at the end of the interval
* High – the highest price reached
* Low – the lowest price during that time
Anatomy of a Candlestick:
* Body: The thick section between the open and close. A green (or white) body means the close was higher than the open (bullish), while red (or black) means the opposite (bearish).
* Wicks (or Shadows): Thin lines extending from the body to indicate the high and low.
* Upper wick: Marks the highest traded price
* Lower wick: Marks the lowest traded price
---
Bearish Candlestick Patterns
Understanding bearish candlestick patterns helps traders identify moments when buying momentum might be running out—setting the stage for a potential downward shift.
Evening Star
A three-candle formation that signals a shift from buying pressure to selling dominance. It starts with a strong bullish candle, followed by a small-bodied candle of indecision, and concludes with a large bearish candle that cuts deep into the first. This pattern often appears at the end of an uptrend.
Bearish Engulfing
This setup includes a small bullish candle followed by a large bearish candle that completely swallows the previous one. It indicates that sellers have seized control, potentially marking the beginning of a downward trend.
Shooting Star
With a small real body near the low and a long upper wick, this pattern reflects strong early buying that is ultimately rejected by the close—suggesting fading bullish momentum.
Gravestone Doji
This candle opens, closes, and hits its low all around the same price, leaving a long upper wick. It suggests that bulls pushed higher during the session but were overpowered by bears by the close.
Three Crows
Three consecutive bearish candles, all approximately the same size. These indicate that a sell off is coming soon.
---
Bullish Candlestick Patterns
Bullish patterns can alert traders to possible reversals after a downtrend or strengthen conviction during an uptrend.
Morning Star
This three-candle formation marks a potential turning point from bearish to bullish. It begins with a strong bearish candle, followed by a smaller candle showing indecision, and ends with a large bullish candle breaking upward—signaling buying strength is returning.
Bullish Engulfing
This two-candle pattern begins with a bearish candle, then a larger bullish candle that completely envelops the previous body. It reflects a sharp transition in sentiment, suggesting renewed buying pressure.
Dragonfly Doji
A single candle where the open, close, and high are all very close, with a long lower wick. It shows sellers pushed prices lower but buyers stepped in and brought them back up—an early sign of possible reversal.
Hammer
A classic bullish reversal signal that features a small real body near the top and a long lower shadow. It indicates a battle where sellers initially dominated, but buyers managed to close near the open price.
Three soldiers
Three consecutive bullish candles, all approximately the same size. These indicate that a big buy is coming soon.
---
Trading with Candlestick Patterns
Candlestick patterns become more meaningful when they align with major chart areas—such as previous support or resistance, trendlines, or retracement zones. A bullish signal at a support level can hint that the downward pressure is fading, while a bearish pattern at resistance may warn of an upcoming decline.
To increase the reliability of your trades, combine candlestick patterns with other forms of technical analysis:
* Support & Resistance Zones: These are price levels where the market has historically reacted. Candlestick patterns forming near these zones have stronger potential implications.
* Fibonacci Levels : These help identify likely retracement areas. When a candlestick pattern forms near a key Fibonacci level like 61.8%, it adds strength to a potential reversal setup.
* Liquidity Areas: Clusters of orders (buy or sell) tend to create strong reactions. When patterns appear in these zones, they often precede more decisive moves.
* Technical Indicators : RSI, MACD, Moving Averages, and Stochastic RSI can provide confirmation. For instance, a bullish reversal pattern that appears when RSI is oversold strengthens the signal.
💡 Tip: Don’t rush into trades based on one candlestick alone. Always wait for the next candle or price confirmation (e.g., a break of a previous high/low) to validate your signal.
---
Thanks for Reading!
✨ If you found this helpful, show some love by liking or commenting!
🔔 Don’t forget to follow for more technical breakdowns and trading insights coming soon!

Mastering the RSI - How to use it in trading?What will be discussed?
- What is the RSI?
- RSI overbought
- RSI oversold
- RSI divergences
- How to use the RSI
- How to trade with the RSI
What is the RSI?
The Relative Strength Index (RSI) is a popular momentum oscillator used in technical analysis to measure the speed and change of price movements. Developed by J. Welles Wilder Jr., it ranges from 0 to 100 and helps traders evaluate whether a security is overbought or oversold. The RSI typically uses a 14-period timeframe and is calculated based on the average gains and losses over that period. A rising RSI suggests increasing buying momentum, while a falling RSI indicates growing selling pressure.
RSI overbought
When the RSI rises above 70, the asset is generally considered overbought. This condition indicates that the price may have risen too quickly and could be due for a correction or pullback. However, being overbought doesn't automatically mean a reversal will occur, it signals that bullish momentum is strong, and traders should be cautious of potential trend exhaustion.
RSI oversold
Conversely, an RSI reading below 30 is typically seen as a sign that the asset is oversold. This condition suggests the price may have fallen too sharply and could be primed for a rebound. Just like with the overbought condition, an oversold RSI doesn’t guarantee an immediate reversal but serves as a warning that bearish momentum may be overextended.
RSI divergences
Divergences occur when the RSI and the price of the asset move in opposite directions. A bullish divergence happens when the price makes a lower low, but the RSI forms a higher low, potentially signaling a reversal to the upside. A bearish divergence occurs when the price makes a higher high, but the RSI creates a lower high, possibly indicating a downward reversal. Divergences are often used to spot early signs of trend changes.
How to use the RSI?
To use the RSI effectively, traders typically look for overbought and oversold conditions to time entries and exits, combine it with other technical indicators for confirmation, and watch for divergences as a sign of potential reversals. RSI can also be adapted for different timeframes or strategies, depending on whether the trader is looking for short-term swings or long-term trend analysis. While it’s a powerful tool, RSI should not be used in isolation, it works best as part of a broader trading plan that considers market context and risk management.
How to trade with the RSI?
The RSI can be a powerful tool for identifying potential trade setups. When the price approaches a key support zone while the RSI remains in overbought territory, this may signal an early warning of a possible market reversal. However, rather than acting immediately, it's wise to wait for confirmation. A clear candlestick reversal pattern, such as a bullish engulfing candle or a pin bar, a provide stronger evidence that momentum is shifting. By combining RSI readings with price action and support levels, traders can improve the accuracy and timing of their entries.
Disclosure: I am part of Trade Nation's Influencer program and receive a monthly fee for using their TradingView charts in my analysis.
Thanks for your support.
- Make sure to follow me so you don't miss out on the next analysis!
- Drop a like and leave a comment!

Mastering Inverse Fair Value Gaps (IFVG) - How to use them?In this guide, I’ll explain the concept of the Inverse Fair Value Gap (IFVG), how it forms, and how you can use it to identify high-probability trading opportunities. You'll learn how to spot the IFVG on a chart, understand their significance in price action, and apply a simple strategy to trade them effectively.
What will be discussed?
- What is a FVG
- What is an IFVG
- What is a bullish IFVG
- What is a bearish IFVG
- How to trade the IFVG
-------------------------------
What is a FVG?
A FVG is a technical concept used by traders to identify inefficiencies in price movement on a chart. The idea behind a fair value gap is that during periods of strong momentum, price can move so quickly that it leaves behind a "gap" where not all buy and sell orders were able to be executed efficiently. This gap creates an imbalance in the market, which price may later revisit in an attempt to rebalance supply and demand.
A fair value gap is typically observed within a sequence of three candles (or bars). The first candle marks the beginning of a strong move. The second candle shows a significant directional push, either bullish or bearish, often with a long body indicating strong momentum. The third candle continues in the direction of the move, opening and closing beyond the range of the first candle. The fair value gap itself is defined by the price range between the high of the first candle and the low of the third candle (in the case of a bullish move), or between the low of the first candle and the high of the third (in a bearish move). This range represents the area of imbalance or inefficiency.
-------------------------------
What is an IFVG?
An Inverse Fair Value Gap (IFVG) occurs when a traditional Fair Value Gap (FVG) is not respected by price, and instead of acting as a support or resistance zone, price breaks through it with strength. Normally, a Fair Value Gap represents a price imbalance left by a strong move, and when price returns to this area, it often reacts by respecting the gap, bouncing off it or reversing, because it's seen as a high-probability level where orders may rest.
However, in the case of an IFVG, price does not respect this imbalance. Instead, it slices through the FVG in the opposite direction, showing that the initial momentum behind the imbalance has weakened or reversed. This breach is a strong indication that market sentiment is shifting. What was once a zone of strength now becomes invalid, and this failed reaction signals that the opposite side of the market (buyers or sellers) has taken control.
The IFVG highlights a key transition in momentum. It tells traders that the prior bias, bullish or bearish, is breaking down, and the new dominant force is pushing price beyond levels that would typically hold. This makes the IFVG useful not only as a sign of failed structure but also as a potential confirmation of a trend reversal or strong continuation in the opposite direction. Essentially, where an FVG usually acts as a wall, an IFVG is what’s left after that wall gets knocked down.
-------------------------------
What is a bullish IFVG?
A bullish Inverse Fair Value Gap (IFVG) occurs when price breaks through a bearish Fair Value Gap (FVG) instead of respecting it. In a typical bearish FVG, the expectation is that when price retraces into the gap, it will react to the imbalance, usually by reversing lower, as the area represents previous selling pressure or inefficiency caused by aggressive sellers.
However, when price does not react bearishly and instead breaks cleanly through the bearish FVG, it signals a shift in market sentiment and momentum. This breakout through the imbalance suggests that buyers are now in control and that the bearish pressure in that zone has been absorbed or invalidated. What was once considered a resistance area is now being overpowered, often leading to continued bullish movement.
-------------------------------
What is a bearish IFVG?
A bearish Inverse Fair Value Gap (IFVG) occurs when price breaks through a bullish Fair Value Gap (FVG) instead of respecting it. In a normal bullish FVG, the expectation is that when price returns to the gap, it will act as support and prompt a move higher, as this area represents a previous imbalance created by strong buying pressure.
However, when price fails to respect the bullish FVG and instead breaks down through it, this signals a shift in momentum to the downside. The anticipated support fails to hold, suggesting that buyers are no longer in control or that their efforts have been overwhelmed by aggressive selling. This kind of move transforms the bullish FVG into a bearish signal, as it confirms weakness in what was previously considered a demand zone.
-------------------------------
How to trade the IFVG?
Trading the Inverse Fair Value Gap (IFVG) requires patience, precision, and clear confirmation of a shift in momentum. The process involves waiting for key conditions to form before entering a trade. Here's how to approach it step-by-step:
First, you need to wait for a liquidity sweep. This means price must take out a recent high or low, typically a short-term liquidity pool, trapping traders on the wrong side of the market. This sweep sets the stage for a potential reversal and indicates that the market is ready to shift direction.
After the liquidity sweep, watch for a 1-minute Fair Value Gap (FVG) to form and then get broken in the opposite direction. This break is crucial, it’s what creates the Inverse Fair Value Gap. The invalidation of this initial FVG confirms that momentum has switched and that the market is no longer respecting the previous imbalance.
Once the IFVG has formed, your entry comes on the close of the candle that breaks and closes beyond the IFVG, above it in a bullish scenario, or below it in a bearish one. This close confirms that the gap has not held and that price is likely to continue in the new direction.
Place your stop loss below the low (for a bullish setup) or above the high (for a bearish setup) of the structure that formed the IFVG. This gives you protection just beyond the level that would invalidate the setup.
-------------------------------
Thanks for your support.
- Make sure to follow me so you don't miss out on the next analysis!
- Drop a like and leave a comment!

Mastering the Death cross and Golden cross - How to use it!In this guide I will discuss the Death crosses and Golden crosses. The next subjects will be described:
- What SMA to use?
- What is a Death cross?
- What is a Golden cross
- Is a Death cross always bearish and a Golden cross always bullish?
- How did the Death crosses and Golden crosses play out this cycle?
What SMA to use for Deathcross and Golden cross on the daily timeframe
In technical analysis, when identifying Golden Crosses and Death Crosses on the daily timeframe, the most commonly used moving averages are the 50-day and the 200-day simple moving averages (SMA). The 50-day moving average represents the average closing price of an asset over the past 50 trading days and reflects medium-term market trends. The 200-day moving average, on the other hand, represents the average over a longer period and is used to gauge the broader, long-term trend.
What is a Deatch cross?
A death cross is a bearish technical analysis signal that occurs when a short-term moving average crosses below a long-term moving average. Most commonly, it refers to the 50-day simple moving average crossing below the 200-day simple moving average on a daily price chart. This crossover suggests that recent price momentum is weakening relative to the longer-term trend, which can be an early indication of a potential downtrend or extended period of market weakness.
The death cross is often interpreted as a sign of increasing selling pressure and a shift in investor sentiment toward caution or pessimism. While it does not predict immediate declines, it is closely watched because it has historically preceded some significant market downturns. However, like all technical indicators, it is not infallible. Since it is based on past price data, the death cross is a lagging indicator, meaning it often appears after a downward trend has already begun.
What is a Golden cross?
A golden cross is a bullish technical analysis pattern that signals the potential beginning of a long-term uptrend. It occurs when a short-term moving average, typically the 50-day simple moving average (SMA), crosses above a long-term moving average, most commonly the 200-day SMA, on a daily price chart. This crossover suggests that recent price momentum is strengthening in relation to the longer-term trend, indicating growing investor confidence and increasing buying interest.
The golden cross is widely viewed as a positive signal by traders and investors, often marking a shift from a downtrend or consolidation phase to a more sustained upward movement. It reflects a change in market sentiment where shorter-term gains begin to outweigh longer-term losses.
Is a Death cross always bearish and a Golden cross always bullish?
The death cross is not always a purely bearish signal. While it reflects that price momentum has shifted to the downside, it's important to remember that moving averages are lagging indicators. By the time the crossover occurs, much of the downward move may already be priced in. As a result, it's common to see a relief rally shortly after the signal appears. This bounce can catch traders off guard, especially those who enter short positions expecting immediate continued weakness.
On the other hand, the golden cross often sparks a wave of bullish sentiment. Many traders see it as confirmation of a strong uptrend, leading to increased buying pressure. However, just like with the death cross, the lagging nature of the signal means that much of the initial move may have already happened. It's not unusual for the price to stall or even retrace shortly after the crossover, especially if the market has become overextended. In both cases, the market often reacts in a counterintuitive way in the short term, which is why these signals are best used alongside other tools and indicators.
How did the Death crosses and Golden crosses play out this cycle?
In this cycle, we’ve seen three death crosses and three golden crosses on the daily timeframe, with a fourth golden cross currently in the making. Interestingly, all three of the previous death crosses have not led to sustained downside as many might expect. Instead, each one has marked a local bottom, followed by strong upward movement in the weeks and months that followed. These signals, rather than being a reason for bearishness, turned out to be contrarian indicators. The most recent death cross occurred when Bitcoin was trading around 80k. From there, it managed to rebound impressively, climbing back above 111k, a clear reminder that death crosses, especially in this cycle, have not been reliable signals for further downside.
The golden crosses, on the other hand, have behaved a bit differently than usual in this cycle. The first golden cross actually marked a local top, with Bitcoin facing rejection shortly after. During the second golden cross, price action was more neutral, BTC moved sideways for a period before eventually continuing its upward trend. The third golden cross was followed by only a shallow pullback, after which Bitcoin pushed to new all-time highs.
Now, we are approaching the formation of the fourth Golden cross. Based on the pattern of past crosses and current market sentiment, a minor pullback could be on the horizon. It’s not guaranteed, but given the level of euphoria in the market right now, some cooling off would not be surprising. Even if a pullback does occur, the larger trend remains intact, and this golden cross may end up reinforcing that momentum.
Thanks for your support.
- Make sure to follow me so you don't miss out on the next analysis!
- Drop a like and leave a comment!

Mastering the MACD - How to use it in trading?The MACD, or Moving Average Convergence Divergence, is one of the most widely used technical indicators in trading. It was developed by Gerald Appel in the late 1970s and is designed to reveal changes in the strength, direction, momentum, and duration of a trend in a stock's price. At its core, the MACD is a momentum oscillator, though it is commonly plotted as a line chart rather than the traditional bounded oscillators like the RSI. Despite being unbounded, traders use the MACD primarily to identify potential buy and sell signals.
What will be discussed?
- How does the MACD work?
- How to use the MACD in trading?
- Divergences
- Conclusion
How does the MACD work?
The MACD is calculated by subtracting the 26-period Exponential Moving Average (EMA) from the 12-period EMA. The result of this calculation is the MACD line. A nine-period EMA of the MACD line, known as the signal line, is then plotted on top of the MACD line. The third component is the MACD histogram, which represents the difference between the MACD line and the signal line. The histogram gives traders a visual cue about momentum: when the histogram bars are growing in height, momentum is increasing in the direction of the MACD line; when they shrink, momentum is slowing down.
How to use the MACD in trading?
Understanding how to use the MACD in trading requires some interpretation of the relationships between these components. One of the primary signals traders look for is a crossover between the MACD line and the signal line. When the MACD line crosses above the signal line, it is considered a bullish signal, suggesting that it might be a good time to buy. Conversely, when the MACD line crosses below the signal line, it indicates a bearish signal and potentially a good time to sell. These crossovers tend to be more significant when they occur below or above the zero line, which is where the MACD and signal line are equal. A crossover below the zero line followed by a move above it could signal the beginning of an uptrend, while a crossover above the zero line followed by a move below it might signal a downtrend.
Divergences
Another important application of the MACD is identifying divergence between the MACD and the price action of the asset. Divergence occurs when the price is moving in one direction and the MACD is moving in the opposite. For instance, if the price makes a new high but the MACD forms a lower high, it can be a warning sign that the upward momentum is weakening and that a reversal could be on the horizon. Similarly, if the price hits a new low but the MACD makes a higher low, it might suggest a potential bullish reversal.
Conclusion
In summary, the MACD is a versatile and powerful indicator that helps traders analyze the momentum and direction of a market trend. Its ability to provide both trend-following and momentum signals makes it a valuable tool in a trader’s toolkit. While it is not a standalone solution, when used properly and in conjunction with other strategies, the MACD can greatly enhance the accuracy and confidence of trading decisions.
Thanks for your support.
- Make sure to follow me so you don't miss out on the next analysis!
- Drop a like and leave a comment!

Mastering Fair Value Gaps (FVG) - How to use them in trading?In this guide, I’ll explain the concept of the Fair Value Gap (FVG), how it forms, and how you can use it to identify high-probability trading opportunities. You'll learn how to spot FVGs on a chart, understand their significance in price action, and apply a simple strategy to trade them effectively.
What will be explained:
- What is a FVG?
- How can a FVG occur?
- What is a bullish FVG?
- What is a bearish FVG?
- How to trade a FVG?
-------------------------------
What is a FVG?
A FVG is a technical concept used by traders to identify inefficiencies in price movement on a chart. The idea behind a fair value gap is that during periods of strong momentum, price can move so quickly that it leaves behind a "gap" where not all buy and sell orders were able to be executed efficiently. This gap creates an imbalance in the market, which price may later revisit in an attempt to rebalance supply and demand.
A fair value gap is typically observed within a sequence of three candles (or bars). The first candle marks the beginning of a strong move. The second candle shows a significant directional push, either bullish or bearish, often with a long body indicating strong momentum. The third candle continues in the direction of the move, opening and closing beyond the range of the first candle. The fair value gap itself is defined by the price range between the high of the first candle and the low of the third candle (in the case of a bullish move), or between the low of the first candle and the high of the third (in a bearish move). This range represents the area of imbalance or inefficiency.
-------------------------------
How can a FVG occur?
There are several factors that can trigger a fair value gap
- Economic news and announcements
- Earnings reports
- Market sentiment
- Supply and demand imbalances
-------------------------------
What is a bullish FVG?
A bullish FVG is a specific type of price imbalance that occurs during a strong upward move in the market. It represents a zone where the price moved so aggressively to the upside that it didn’t spend time trading through a particular range, essentially skipping over it.
This gap usually forms over the course of three candles. First, a bullish candle marks the beginning of upward momentum. The second candle is also bullish and typically has a large body, indicating strong buying pressure. The third candle opens higher and continues moving upward, confirming the strength of the move. The bullish fair value gap is the price range between the high of the first candle and the low of the third candle. This area is considered an imbalance zone because the market moved too quickly for all buyers and sellers to interact at those prices.
-------------------------------
What is a bearish FVG?
A bearish FVG is a price imbalance that forms during a strong downward move in the market. It occurs when price drops so rapidly that it leaves behind a section on the chart where little to no trading activity happened.
This gap is identified using a three-candle formation. The first candle typically closes bearish or neutral, marking the start of the move. The second candle is strongly bearish, with a long body indicating aggressive selling pressure. The third candle opens lower and continues the move down. The bearish fair value gap is the price range between the low of the first candle and the high of the third candle. That range is considered the imbalance zone, where price skipped over potential trade interactions.
-------------------------------
How to trade a FVG?
To trade a FVG effectively, wait for price to retrace back into the gap after it has formed. The ideal entry point is around the 50% fill of the FVG, as this often represents a balanced level where price is likely to react.
During the retracement, it’s helpful to see if the FVG zone aligns with other key technical areas such as support or resistance levels, Fibonacci retracement levels, or dynamic indicators like moving averages. These additional confluences can strengthen the validity of the zone and increase the probability of a successful trade.
Enter the trade at the 50% level of the FVG, and place your stop loss just below the most recent swing low (for a bullish setup) or swing high (for a bearish one). From there, manage the trade according to your risk-to-reward preferences—whether that’s 1:1, 1:2, or a higher ratio depending on your strategy and market conditions.
-------------------------------
Thanks for your support.
- Make sure to follow me so you don't miss out on the next analysis!
- Drop a like and leave a comment!

Mastering Order Blocks: How to Trade Like Smart MoneyIntroduction
Order Blocks (OBs) are one of the most critical concepts in Smart Money trading. They represent areas where institutional traders have entered the market with significant volume, typically leading to strong price movements. Identifying and trading Order Blocks gives traders an edge by aligning with the footprints of Smart Money.
What is an Order Block?
An Order Block is the last bearish candle before a bullish move for bullish OBs, or the last bullish candle before a bearish move for bearish OBs. These candles represent areas where institutions accumulated or distributed large positions, leading to a market shift.
Types of Order Blocks
A Bullish Order Block appears at the end of a downtrend or during a retracement just before the price moves sharply upward. It is typically represented by the last bearish candle prior to an impulsive bullish move. Price will often return to this level to mitigate institutional orders before continuing upward.
A Bearish Order Block, in contrast, forms at the end of an uptrend or retracement where price begins a downward reversal. It is characterized by the last bullish candle before a strong bearish move. Price tends to revisit this level to mitigate before continuing lower.
How to Identify a Valid Order Block
The key to identifying a valid Order Block is first observing a strong impulsive move, also known as displacement, that follows the OB candle. The move must also result in a break of market structure or a significant shift in direction. Order Blocks that produce Fair Value Gaps (FVGs) or Market Structure Shifts (MSS) tend to be more reliable. Another important sign is when price returns to the OB for mitigation, offering a potential entry.
Entry Model Using Order Blocks
After locating a valid OB, the next step is to wait for price to return to this area. The ideal entry happens within the OB body or near its 50% level. For extra confirmation, look for a Market Structure Shift or Break of Structure on a lower timeframe. Entries are more powerful when combined with additional elements like Fair Value Gaps, liquidity grabs, or SMT Divergences. The stop-loss should be placed just beyond the OB’s high or low, depending on the direction of the trade.
Refinement Techniques
To increase precision, higher timeframe OBs can be refined by zooming into lower timeframes like the 1M or 5M chart. Within a broad OB zone, identify internal market structure, displacement candles, or embedded FVGs to determine a more precise entry point. One effective refinement is the Optimal Trade Entry (OTE), which is often found at the 50% level of the Order Block.
Order Blocks vs. Supply and Demand Zones
While they may seem similar, Order Blocks are more narrowly defined and specifically related to institutional order flow. Supply and Demand zones are broader and typically drawn around areas of price reaction, but OBs are derived from the final institutional candle before a large move and are often confirmed by structure shifts or displacement. This makes OBs more precise and actionable in the context of Smart Money concepts.
Target Setting from Order Blocks
Targets after entering from an OB should align with liquidity objectives. Common targets include internal liquidity like equal highs or lows, or consolidation zones just beyond the OB. External liquidity targets such as previous major swing highs or lows are also ideal, especially when they align with imbalances or Fair Value Gaps. It's important to adjust targets based on the current market structure and trading session.
Common Mistakes to Avoid
A frequent mistake is treating any candle before a move as an OB without verifying key signals like displacement or a Break of Structure. Entering without other confirmations, such as an MSS or liquidity sweep, can lead to poor trades. Another common error is placing the stop-loss too tightly within the OB, instead of just beyond it, increasing the chance of premature stop-outs. Traders should also avoid executing OB trades during low-liquidity sessions where price action can be unpredictable and wicky.
Final Thoughts
Order Blocks are foundational to Smart Money trading. They allow you to enter where institutions have placed large positions and offer clear invalidation and entry logic. With practice, you can identify high-quality OBs and combine them with other concepts like FVGs, MSS, and SMT for powerful, precise trades.
Practice on different timeframes and assets, and always look for clean displacement and structure confirmation. Mastering OBs is a big step toward becoming a consistently profitable trader.
Trust the Blocks. Trade with Intention.

Mastering chart patterns - How to use them in trading!Chart patterns are visual formations created by the price movements of a financial asset—like a stock, currency, or cryptocurrency, on a price chart. Traders use these patterns in technical analysis to predict future market direction based on historical behavior. The main chart patterns are the reversal and continuation patterns.
-------------------------------
What will we discuss?
- Bullish reversal patterns
- Bearish reversal patterns
- Bullish continuation patterns
- Bearish continuation patterns
-------------------------------
Bullish reversal patterns:
Double bottom
A double bottom in trading is a bullish reversal pattern that signals the potential end of a downtrend and the beginning of an uptrend. It forms when the price of an asset falls to a low, bounces back up, then drops again to roughly the same low before rising once more. This creates a "W" shape on the chart.
How to trade it:
Before entering a trade, wait for the price to break back above the neckline with strong volume, as this indicates a potential bullish reversal. Once the breakout is confirmed, look for an entry on the pullback to the neckline.
Inverted head and shoulders
An inverted head and shoulders is a bullish reversal pattern that typically forms after a downtrend and signals a possible shift to an uptrend.
It consists of three parts:
* The left shoulder, where the price makes a low and then bounces.
* The head, which is a deeper low followed by another bounce.
* The right shoulder, a higher low similar in level to the left shoulder.
How to trade it:
Before entering a trade, wait for the price to break above the neckline with strong volume, as this confirms the pattern and signals a potential upward move. After the breakout, it's important to wait for a retest of the neckline to look for an entry. Traders typically place a stop-loss just below the right shoulder to manage risk.
Falling wedge
A falling wedge is a bullish chart pattern that often signals a potential reversal or continuation of an uptrend, depending on where it forms in a price trend.
It appears when the price is moving lower but within a narrowing range, creating two downward-sloping, converging trendlines. Both the highs and lows are falling, but the lower highs are coming down faster than the lower lows, which shows that selling pressure is losing strength over time.
How to trade it:
Wait for the falling wedge to break above the downward trendline and for the price to reclaim the most recent lower high. A breakout alone isn’t always reliable, sometimes the price moves briefly above the trendline without making a higher high, resulting in a fake-out. To confirm the move, wait for a clear higher high and then look to enter on the retracement that follows.
-------------------------------
Bearish reversal patterns
Double top
A double top is a bearish reversal pattern that signals a potential shift from an uptrend to a downtrend.
It forms when the price reaches a high, pulls back, then rallies again to the same or similar high but fails to break above it. This creates an "M" shape on the chart. The neckline is the support level at the low point between the two peaks. When the price breaks below this neckline with strong volume, it confirms the pattern and suggests that selling pressure is taking over.
How to trade it:
Before entering a trade, wait for the price to break below the neckline with strong volume, as this indicates a potential bearish reversal. Once the breakout is confirmed, look for an entry on the pullback to the neckline.
Head and shoulders
A head and shoulders is a bearish reversal pattern that typically forms after an uptrend and signals a potential shift to a downtrend.
It consists of three peaks:
* The left shoulder, where the price rises and then falls.
* The head, which is a higher peak followed by another decline.
* The right shoulder, a lower high that is roughly equal in height to the left shoulder.
How to trade it:
Before entering a trade, wait for the price to break below the neckline with strong volume, as this confirms the pattern and signals a potential downside move, After the breakout, it’s important to wait for a retest of the neckline to look for an entry. Traders typically place a stop-loss just above the right shoulder to manage risk
Rising wedge
A rising wedge is a bearish chart pattern that often signals a potential reversal or continuation of an downtrend, depending on where it forms in a price trend.
It appears when the price is moving higher but within a narrowing range, creating two upward-sloping, converging trendlines. Both the highs and lows are rising, but the highs are increasing at a faster rate than the lows. This suggests that buying pressure is weakening over time, and the market may be preparing for a downturn.
How to trade it:
Wait for the rising wedge to break below the upsloping trendline and for the price to reclaim the most recent high low. A breakout alone isn’t always reliable, sometimes the price moves briefly below the trendline without making a lower low, resulting in a fake-out. To confirm the move, wait for a clear lower low and then look to enter on the retracement that follows.
-------------------------------
Bullish continuation patterns
Bullflag
A bull flag is a continuation pattern that signals the potential for a price to continue moving upward after a brief consolidation or pullback.
It forms when the price experiences a strong upward move (the flagpole), followed by a period of consolidation or a slight downward movement (the flag). The flag typically slopes downward or moves sideways, and the consolidation phase usually occurs within two parallel trendlines, creating a rectangle or slight downward channel.
How to trade it?
Before entering a position, wait for the price to break above the downsloping trendline and establish a higher high. If the price doesn’t make a higher high, it could be a fake-out. Once a higher high is confirmed, look for an entry on the retracement. The target is typically the length of the flagpole projected upward from the breakout point.
Bullish pennant
A bullish pennant is a continuation pattern that indicates the potential for a price to continue its upward trend after a brief consolidation. It forms when a strong upward move (the flagpole) is followed by a period of consolidation, where the price moves within converging trendlines, creating a small symmetrical triangle or pennant shape. The consolidation typically shows lower highs and higher lows, and the pattern suggests that the market is taking a "breather" before continuing its upward momentum.
How to trade it?
Before entering a position, wait for the price to break above the downsloping trendline and establish a higher high. If the price doesn’t make a higher high, it could be a fake-out. Once a higher high is confirmed, look for an entry on the retracement. The target is typically the length of the flagpole projected upward form the breakout point.
Ascending triangle
An ascending triangle is a bullish continuation pattern that typically forms during an uptrend, signaling that the price is likely to continue moving higher.
It is characterized by a horizontal resistance line at the top, formed by a series of peaks at roughly the same price level, and an ascending support line at the bottom, formed by higher lows. This creates a triangle shape, where the price is gradually compressing between the horizontal resistance and the rising support.
How to trade it?
Before entering a position, wait for the price to break above the horizontal resistance level with strong volume. Once the breakout occurs, look for an entry on the retracement back to this area.
-------------------------------
Bearish continuation patterns
Bearflag
A bear flag is a bearish continuation pattern that suggests the price is likely to continue moving downward after a brief consolidation or upward pullback.
It forms when there is a strong downward move (the flagpole), followed by a period of consolidation or slight upward movement (the flag). The flag typically slopes upward or moves sideways, and the consolidation occurs within two parallel trendlines, creating a rectangular or upward-sloping channel. This pattern shows that, despite the short-term pullback, the overall downtrend remains intact.
How to trade it?
Before entering a position, wait for the price to break below the upsloping trendline and establish a lower low. If the price doesn’t make a lower low, it could be a fake-out. Once a lower low is confirmed, look for an entry on the retracement. The target is typically the length of the flagpole projected downward for the breakout point.
Bearish pennant
A bearish pennant is a bearish continuation pattern that signals a potential continuation of a downtrend after a brief consolidation.
It forms when there is a strong downward move (the flagpole), followed by a period of consolidation where the price moves within converging trendlines, creating a small symmetrical triangle or pennant shape. The consolidation typically shows lower highs and higher lows, indicating that the price is taking a pause before continuing its downward movement.
How to trade it?
Before entering a position, wait for the price to break below the upsloping trendline and establish a lower low. If the price doesn’t make a lower low, it could be a fake-out. Once a lower low is confirmed, look for an entry on the retracement. The target is typically the length of the flagpole projected downward for the breakout point.
Descending triangle
A descending triangle is a bearish continuation pattern that typically forms during a downtrend, indicating that the price is likely to continue moving lower after a period of consolidation.
The pattern is characterized by a horizontal support line at the bottom, formed by a series of lows at approximately the same price level, and a descending resistance line at the top, formed by a series of lower highs. The price contracts between these two trendlines, creating a triangle shape with a downward-sloping upper boundary and a flat lower boundary.
How to trade it?
Before entering a position, wait for the price to break below the horizontal support level with strong volume. Once the breakout occurs, look for an entry on the retracement back to this area.
-------------------------------
Thanks for your support.
- Make sure to follow me so you don't miss out on the next analysis!
- Drop a like and leave a comment!

The Hidden Power of the Silver Bullet Strategy - Full GuideIntroduction
The Silver Bullet Strategy is a high-probability intraday trading technique popularized within the Smart Money Concepts community. It focuses on taking precision trades during specific times of the day when liquidity is most active. Mastering this strategy can help traders consistently capture high-quality setups with minimal risk.
In this guide, we will cover:
- What the Silver Bullet Strategy is
- Key Times to Watch
- Entry Models
- Target Setting
- Risk Management
- Real Chart Examples
---
What is the Silver Bullet Strategy?
The Silver Bullet Strategy is based on trading within a "window" of high-probability price action, typically during key liquidity times. It looks to capture moves after liquidity sweeps, order block mitigations, and Fair Value Gap (FVG) plays.
Key Principles:
- Focuses on high-probability windows (New York session especially)
- Waits for a liquidity grab and displacement
- Entries are often on FVGs, OBs, or MSS points
---
Silver Bullet Timing Windows
Timing is crucial to this strategy. The "Silver Bullet" typically occurs in these windows (New York time):
- First Window: 10:00 AM - 11:00 AM (New York)
- Second Window: 2:00 PM - 3:00 PM (New York)
These times capture major moves post-liquidity sweeps or reversals after news/market manipulation.
---
Silver Bullet Entry Model
The classic sequence for a Silver Bullet setup:
1. Identify Liquidity Sweep: Look for price to grab liquidity above a swing high or below a swing low.
2. Look for Displacement: A strong move away from the sweep, creating a Fair Value Gap (FVG) or Breaker Block.
3. Entry in FVG or OB: Enter on a retracement into the FVG or Order Block after displacement.
4. Confirmation: Use lower timeframe MSS or BOS to confirm the reversal.
Liquidity sweep and FVG at the 5m:
MSS + Displacement candle at the 1m:
So all 4 steps completed!
Example Entry Checklist:
- Liquidity sweep
- Strong displacement creating an FVG
- Price retraces into FVG or OB
- MSS/BOS confirmation
- Execute trade with tight stop-loss
---
Where to Set Targets
Targets should be logical based on market structure:
- First Target: Recent internal liquidity (equal highs/lows)
- Second Target: External liquidity zones (major swing highs/lows)
- Optional: Use 1R/2R/3R scaling based on risk-to-reward goals
---
Risk Management for Silver Bullet Trades
Golden Rules:
- Risk less than 1% per Silver Bullet setup
- Set stop-loss beyond the liquidity sweep (not too tight, not too loose) or above FVG
candle
- Stick to one or two trades per window maximum
- Avoid revenge trading outside the windows
---
Common Mistakes to Avoid
- Trading outside the specified time windows
- Entering without a confirmed sweep and displacement
- Overleveraging because the strategy "looks easy"
- Ignoring higher timeframe bias (HTF context is still critical!)
Pro Tip: Combine Silver Bullet entries with SMT Divergences, MSS, and IFVGs for maximum confluence.
---
Final Thoughts
The Silver Bullet Strategy is one of the cleanest ways to approach intraday trading. By mastering liquidity concepts, timing, and precision entries, traders can catch powerful moves with strong risk-to-reward setups.
Be patient, wait for your window, and always trade with discipline.
Happy Sniping!
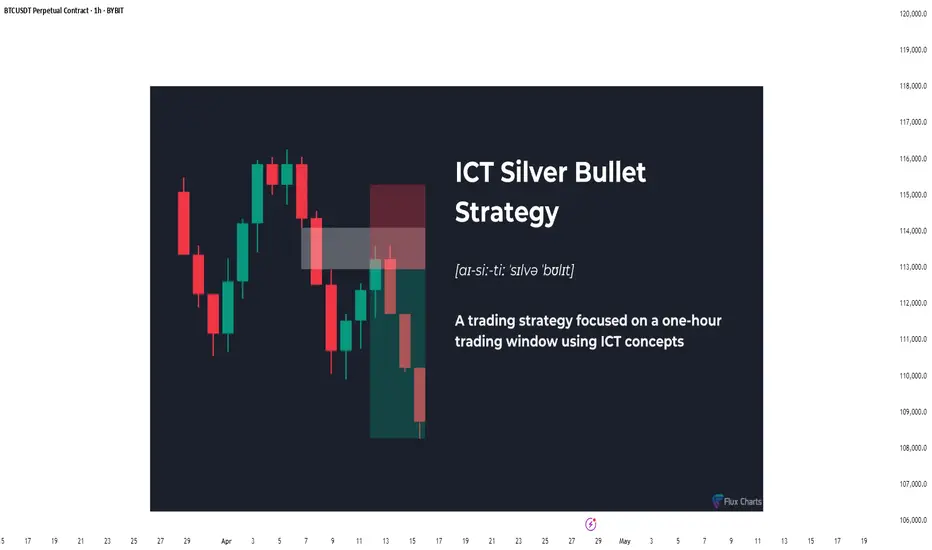
Mastering volume bars – How to read and use volume bars!When it comes to trading, price action often takes the spotlight, but volume is the quiet force behind the scenes that tells the real story. Volume bars show how much trading activity occurs during a given time period and can offer valuable insight into the strength or weakness of a price move. In this guide, we’ll break down how to read volume bars, what the different colors represent, and how to use them to make more informed trading decisions. Whether you're a beginner or looking to sharpen your strategy, understanding volume is a key step toward becoming a more confident and capable trader.
-------------------------------
What will we discuss:
- What is the volume indicator?
- What are the green and red volume bars + the MA line?
- How does the volume indicator work?
- How to use volume during Support/resistance flips?
- How to use volume while trading pattern breakouts?
- How to use volume while trading inside a pattern?
-------------------------------
What is the volume indicator
The volume Bar indicator is a simple but yet essential tool that helps traders understand the level of activity behind every price movement. When you add the Volume Bar indicator to your chart, you will see vertical bars appear beneath each candlestick under in your chart. This represents the total volume during that time period. These bars show how much buying and selling occurred, but not whether it was mostly buying or mostly selling. The taller the bar, the more active the market was during that candle.
-------------------------------
What are the green and red volume bars + the MA line?
A green volume bar means the price closed higher than it opened during that period, indicating bullish sentiment and suggesting that buying pressure was stronger. A red volume bar means the price closed lower than it opened, reflecting bearish sentiment and suggesting that selling pressure dominated. While the volume itself shows how much was traded, the color tells you whether that activity occurred mostly during upward or downward price movement. It's important to note that the color doesn't directly show the number of buyers or sellers, since every trade has both.
The MA line in a volume bar indicator stands for “Moving Average.” It represents the average trading volume over a specific number of past periods, smoothing out short-term fluctuations to show the overall trend in volume activity. This helps traders see whether the current volume is unusually high or low compared to the average. For example, if the current volume bar is significantly higher than the MA line, it could signal strong interest or momentum behind a price move. Conversely, if volume is consistently below the MA line, it may indicate weak market participation or a lack of conviction behind recent price changes.
-------------------------------
How does the volume indicator work?
Using volume effectively in trading involves looking at how it behaves in relation to price. For example, if price is moving up and volume is increasing , that usually confirms strong buying interest, suggesting the move is valid. On the other hand, if price rises on low volume, it could be a sign of weakness or a potential reversal. The same logic applies to down moves, if price drops on high volume, it is more likely a strong selling move. If it drops on low volume, it could just be a temporary pullback.
-------------------------------
How to use volume during Support/resistance flips?
Volume can also play a key role when trading support and resistance levels. When the price breaks through a key resistance level with strong volume, it often signals a shift in market sentiment and increases the likelihood that this level will now act as support. The high volume behind the breakout indicates strong conviction from buyers, meaning bulls were actively stepping in to push price higher.
Because of this, if the price comes back down to retest that zone, it's likely that buyers will defend it, turning the former resistance into solid support. This concept is often referred to as a "break and retest" strategy, and volume is what helps confirm whether the breakout was strong enough to validate the level as a new base.
Without significant volume, the breakout might lack follow-through, and the price could easily fall back below the level, failing to establish it as support. But when the breakout is backed by high participation, the probability of that level holding increases. I’ve included an example to show exactly how this plays out in action.
-------------------------------
How to use volume while trading pattern breakouts?
When trading chart patterns, volume can be a powerful tool to confirm whether a breakout is genuine or likely to be a fake-out. Patterns like triangles, flags, head and shoulders, or rectangles often lead to breakouts, but not all of them are trustworthy. That’s where volume comes in.
If price breaks out of a pattern, it's important to look at the volume at that moment. A strong breakout is usually accompanied by a noticeable increase in volume. This surge in volume indicates that more market participants are getting involved, adding weight to the move. Essentially, higher volume reflects stronger conviction. It means traders aren’t just watching the breakout, they’re actively trading it.
On the other hand, if the price breaks out but the volume remains low or even drops, that’s a red flag. Low volume suggests a lack of interest or commitment, and the breakout may not have enough strength to continue. In such cases, the price might quickly fall back into the pattern, turning what looked like a breakout into a fake-out.
-------------------------------
How to use volume while trading inside a pattern?
You can also use volume to gain insights while the price is still developing within a chart pattern, such as a rising wedge. In these situations, volume can help reveal the strength, or lack of strength, behind the price movement, even before a breakout occurs.
For example, if the price drops sharply with high volume and then starts moving upward again in a rising wedge formation, but this upward move happens on low or declining volume, it can be a sign of potential weakness. The initial high-volume drop shows strong selling pressure, and the lack of buying volume on the recovery suggests that buyers are not fully supporting the move.
This imbalance between strong selling and weak buying can indicate that the upward movement is not sustainable. It often means the rising wedge is forming as a corrective or weakening structure, increasing the chances of a breakdown once the pattern completes. In this way, volume becomes a clue, not just for breakouts, but for spotting when a move might be running out of steam even before it happens.
-------------------------------
Thanks for your support.
- Make sure to follow me so you don't miss out on the next analysis!
- Drop a like and leave a comment!

Market Structure Shift (MSS) & Break of Structure (BOS) - GuideIntroduction
Understanding market structure is fundamental to becoming a consistently profitable trader. Two key concepts that Smart Money traders rely on are the Break of Structure (BOS) and the Market Structure Shift (MSS) . While they may seem similar at first glance, they serve different purposes and signal different market intentions.
In this guide, we will break down:
- The difference between BOS and MSS
- When and why they occur
- How to identify them on your charts
- How to trade based on these structures
- Real chart examples for visual clarity
---
Break of Structure (BOS)
A Break of Structure is a continuation signal. It confirms that the current trend remains intact. BOS typically occurs when price breaks a recent swing high or low in the direction of the existing trend .
Key Characteristics:
- Happens with the trend
- Confirms continuation
- Can be used to trail stops or add to positions
Example:
In an uptrend:
- Higher High (HH) and Higher Low (HL) form
- Price breaks above the last HH → BOS to the upside
---
Market Structure Shift (MSS)
Market Structure Shift signals a potential reversal . It occurs when price breaks a significant swing level against the prevailing trend and is often followed by a shift in the internal structure (e.g., lower highs after higher highs).
Key Characteristics:
- Happens against the trend]
- Signals possible trend reversal
- Often occurs after a liquidity grab or stop hunt
- Optional: is created by a displacement candle
Example:
In an uptrend:
- Price takes out a significant high (liquidity grab)
- Then aggressively breaks the most recent HL → MSS to the downside
---
How to Identify BOS and MSS
For BOS:
1. Determine the current trend.
2. Identify swing highs/lows.
3. Look for price breaking past these levels in the same direction as the trend .
For MSS:
1. Look for signs of exhaustion or liquidity grabs near swing highs/lows.
2. Watch for price to break against the trend structure .
3. Confirm with a shift in internal structure (e.g., lower highs start forming in an uptrend).
---
Using BOS and MSS in Your Trading Strategy
With BOS:
- Use it to confirm trend continuation
- Add to your position after a retracement into an OB or FVG
- Trail your stop-loss below the most recent HL or above LH
With MSS:
- Look for confluence (liquidity sweep + MSS = strong signal)
- Use it to spot early reversal entries
- Wait for a confirmation candle or structure shift on LTF (1m, 5m, 15m)
- If the displacement candle is too big you can wait for the retest
---
Common Mistakes to Avoid
- Confusing BOS with MSS
- Ignoring higher timeframe context
- Trading MSS too early without confirmation
- Chasing BOS without waiting for a proper retracement
Pro Tip: Use BOS/MSS with confluences like SMT Divergence, IFVGs, or key session times for higher probability setups.
---
Final Thoughts
Mastering BOS and MSS will give you an edge in understanding price delivery and anticipating market moves. BOS confirms strength in the current trend, while MSS warns of a possible reversal and new trend forming. Combine these with smart money tools, and you’ll be equipped to enter the market like a pro.
Happy Trading!

Mastering Candlestick Patterns - How to use them in trading!Introduction
Candlesticks are one of the most popular and widely used tools in technical analysis. They offer a visual representation of price movements within a specific time period, providing valuable insights into market trends, sentiment, and potential future price movements.
Understanding candlestick patterns is crucial for traders, as these formations can indicate whether a market is bullish or bearish, and can even signal potential reversals or continuations in price. While candlesticks can be powerful on their own, trading purely based on candlestick patterns can be challenging and risky.
-----------------------------------------------------------------------------------------------
What are we going to discuss:
1. What are candlesticks?
2. What are bullish candlestick patterns?
3. What are bearish candlestick patterns?
4. How to use candlestick patterns in trading?
-----------------------------------------------------------------------------------------------
1. What are candlesticks?
A candlestick in trading is a visual representation of price movement in a specific time period on a chart. It is a fundamental element used in technical analysis to study market trends, determine price levels, and predict potential future price movements. A single candlestick consists of four main components: the open, close, high, and low prices for that time period.
Here’s how a candlestick works:
- The Body: The rectangular area between the open and close prices. If the close is higher than the open, the body is green, indicating a bullish (upward) movement. If the close is lower than the open, the body is red, signaling a bearish (downward) movement.
- The Wick (high and low of the candle): The thin lines extending above and below the body. These represent the highest and lowest prices reached during the period. The upper wick shows the highest price, while the lower wick shows the lowest price.
- The Open Price: The price at which the asset began trading in that time period (for example, the start of a day, hour, or minute depending on the chart timeframe).
- The Close Price: The price at which the asset finished trading at the end of the period.
-----------------------------------------------------------------------------------------------
2. What are bullish candlestick patterns?
What is a Hammer Candlestick Pattern?
A hammer candlestick pattern has a small body near the top of the candle and a long lower wick, typically two to three times the length of the body. There is little to no upper wick. This formation shows that during the trading session, sellers managed to push the price significantly lower, continuing the downward momentum. However, buyers eventually stepped in with strong demand and drove the price back up near the opening level by the close.
What is an Inverted Hammer?
An inverted hammer has a small body near the bottom of the candle with a long upper wick, usually at least two to three times the size of the body, and little to no lower wick. This unique shape resembles an upside-down hammer, hence the name.
What is a Dragonfly Doji?
A dragonfly doji has a unique shape where the open, close, and high prices are all at or very close to the same level, forming a flat top with a long lower wick and little to no upper wick. This gives the candle the appearance of a "T," resembling a dragonfly.
What is a Bullish Engulfing?
A bullish engulfing candlestick consists of two candles. The first candle is bearish, indicating that sellers are still in control. The second candle is a large bullish candle that completely engulfs the body of the first one, meaning it opens below the previous close and closes above the previous open. This pattern reflects a clear shift in market sentiment. During the second candle, buyers step in with significant strength, overpowering the previous selling pressure and reversing the momentum. The fact that the bullish candle completely engulfs the previous bearish candle indicates that demand has taken over, signaling a potential trend reversal.
What is a Morning Star?
The morning star consists of three candles. The first is a long bearish candle, indicating that the downtrend is in full force, with strong selling pressure. The second candle is a small-bodied candle, which can be either bullish or bearish, representing indecision or a pause in the downtrend. Often, the second candle gaps down from the first, indicating that the selling pressure is subsiding but not yet fully reversed. The third candle is a long bullish candle that closes well above the midpoint of the first candle, confirming that buyers have taken control and signaling the potential start of an uptrend.
-----------------------------------------------------------------------------------------------
3. What are bearish candlestick patterns?
What is a Shooting Star?
A shooting star has a smal body near the low of the candle and a long upper wick, usually at least twice the size of the body, with little to no lower wick. This shape shows that buyers initially pushed the price higher during the session, continuing the upward momentum. However, by the close, sellers stepped in and drove the price back down near the opening level.
What is a Hanging Man?
A hanging man has a distinct shape, with a small body positioned near the top of the candle and a long lower wick, usually at least twice the length of the body. There is little to no upper wick. The appearance of this candle suggests that although there was strong selling pressure during the session, buyers managed to bring the price back up near the opening level by the close. Despite the recovery, the long lower wick shows that sellers were able to push the price down significantly at one point. This introduces uncertainty into the uptrend and can indicate that bullish momentum is weakening.
What is a Gravestone Doji?
A gravestone doji has a distinctive shape where the open, low, and close prices are all at or near the same level, forming a flat base. The upper wick is long and stretches upward. This shape resembles a gravestone, which is where the pattern gets its name.
What is a Bearish Engulfing?
A bearish engulfing candlestick pattern is a two-candle reversal pattern that typically appears at the end of an uptrend and signals a potential shift from bullish to bearish sentiment. The first candle is a smaller bullish candle, reflecting continued upward momentum. The second candle is a larger bearish candle that completely engulfs the body of the first one, meaning it opens higher than the previous close and closes lower than the previous open. This indicates that bears have taken control, overpowering the buyers, and suggests a potential downside movement.
What is an Evening Star?
An evening star is a bearish candlestick pattern that typically signals a potential reversal at the top of an uptrend. It consists of three candles and reflects a shift in momentum from buyers to sellers. The pattern starts with a strong bullish candle, showing continued buying pressure and confidence in the upward move. This is followed by a smaller-bodied candle, which can be bullish or bearish, and represents indecision or a slowdown in the uptrend. The middle candle often gaps up from the first candle, showing that buyers are still trying to push higher, but the momentum is starting to weaken. The third candle is a strong bearish candle that closes well into the body of the first bullish candle. This candle confirms that sellers have taken control and that a trend reversal could be underway. The more this third candle erases the gains of the first, the stronger the reversal signal becomes.
-----------------------------------------------------------------------------------------------
4. How to use candlestick patterns in trading?
Candlestick patterns are most useful when they appear at key levels, such as support, resistance, or significant trendlines. For instance, if a bullish reversal pattern like a hammer or bullish engulfing forms at a support level, it may indicate that the downtrend is losing momentum, and a reversal could be coming.
Trading based on candlestick patterns alone can be risky. To improve your chances of success, always seek additional confirmation from other technical analysis tools. Here are some common ones:
- Support and Resistance Levels: Look for candlestick patterns that form near key support or resistance levels. For instance, if the price reaches a support zone and a bullish reversal candlestick pattern forms, this may suggest a potential upward reversal.
- Fibonacci Retracement: Use Fibonacci levels to identify potential reversal zones. If a candlestick pattern appears near a key Fibonacci level (such as the Golden Pocket), it adds confirmation to the idea that the price may reverse.
- Liquidity Zones: These are areas where there is a high concentration of buy or sell orders. Candlestick patterns forming in high liquidity zones can indicate a stronger potential for a reversal or continuation.
- Indicators and Oscillators: Incorporating indicators like the Relative Strength Index (RSI), Moving Averages, MACD, or Stochastic RSI can help confirm the momentum of the price. For example, if a candlestick pattern forms and the RSI shows an oversold condition (below 30), this could indicate a potential reversal to the upside.
It’s crucial to wait for confirmation before entering a trade. After a candlestick pattern forms, it’s important to wait for the next candle or price action to confirm the signal. For example, if you spot a bullish reversal candlestick like a hammer at support, wait for the next candle to close above the hammer’s high to confirm that buyers are in control and a reversal is likely.
-----------------------------------------------------------------------------------------------
Thanks for your support.
- Make sure to follow me so you don't miss out on the next analysis!
- Drop a like and leave a comment!

Mastering the Stochastic RSI - Guide to Spotting Momentum ShiftsIntroduction
In the world of technical analysis, momentum indicators are essential tools for understanding market sentiment and potential price movements. One such tool is the Stochastic RSI (Stoch RSI), a unique and highly sensitive variation of the traditional Relative Strength Index (RSI). While the standard RSI focuses on price, the Stoch RSI takes it a step further by measuring the momentum of the RSI itself. This makes it a faster-reacting and more dynamic indicator that many traders use to anticipate trend shifts and spot overbought or oversold conditions earlier.
What is the Stochastic RSI?
The Stochastic RSI (Stoch RSI) is a momentum oscillator that operates similarly to the RSI but with a twist — instead of measuring the price of an asset, it measures the movement of the RSI. Because of this, the Stoch RSI is typically more sensitive and quicker to respond to changes in market momentum.
It consists of two lines:
* The blue line: The primary line that reacts quickly and shows when the RSI is gaining or losing momentum.
* The orange line: A moving average of the blue line, which acts as a smoother version to help filter out noise and highlight potential turning points.
How to Read the Stoch RSI
The Stoch RSI moves between 0 and 100, and traders often focus on the 20 and 80 levels as key thresholds:
Above 80 (Overbought): Indicates that the RSI has been running hot compared to recent values. This suggests strong upward momentum that could be due for a slowdown or minor correction. However, it doesn’t necessarily mean the price will drop immediately, just that conditions are extended.
Below 20 (Oversold): Suggests the RSI has been suppressed, signaling weakening bearish momentum and a possible reversal upward. Again, this isn’t a guaranteed bounce but rather a situation where a shift may be more likely.
How to Trade with the Stoch RSI
While entering overbought or oversold zones can offer insight, trading solely based on those levels is risky. Instead, look for crossovers between the blue and orange lines:
Bearish signal: When the Stoch RSI is above 80 and the blue line crosses below the orange line, it can indicate that bullish momentum is fading — a potential short entry.
Bullish signal: When the Stoch RSI is below 20 and the blue line crosses above the orange line, it may suggest that bearish momentum is weakening — a potential long entry.
These crossover points provide more reliable signals than the levels alone, especially when confirmed by price action or other indicators.
What Timeframes to Use
The Stoch RSI can be applied to any timeframe, but its effectiveness varies. On lower timeframes (like 1-minute or 5-minute charts), it generates many signals, including plenty of false or weak ones. For stronger and more reliable signals, it’s best used on higher timeframes such as the 4-hour, daily, weekly, or monthly charts. Generally, the higher the timeframe, the more significant the signal becomes.
Conclusion
The Stochastic RSI is a powerful indicator that combines the strengths of the RSI and Stochastic Oscillator to deliver sharper, more responsive momentum signals. While it’s tempting to act on overbought or oversold readings alone, true effectiveness comes from understanding the behavior of the two lines and using it in conjunction with other analysis tools. Whether you're a short-term trader or a long-term investor, mastering the Stoch RSI can add depth to your strategy and help you make more informed decisions.

Smart Money Technique (SMT) Divergences - The Ultimate GuideIntroduction
SMT Divergences are a powerful concept used by professional traders to spot inefficiencies in the market. By comparing correlated assets, traders can identify hidden opportunities where one market shows strength while the other shows weakness. This guide will break down the major SMT divergences: EURUSD/GBPUSD, US100/US500, and XAUUSD/XAGUSD .
---
What is SMT Divergence?
SMT Divergence occurs when two correlated assets do not move in sync, signaling potential liquidity grabs or market inefficiencies. These divergences can be used to confirm trend reversals, identify smart money movements, and improve trade precision.
Key Concepts:
- If one asset makes a higher high while the correlated asset fails to do so, this suggests potential weakness in the pair making the higher high.
- If one asset makes a lower low while the correlated asset does not, this suggests potential strength in the pair that did not make a lower low.
- Smart Money often exploits these inefficiencies to engineer liquidity hunts before moving price in the intended direction.
---
EURUSD vs. GBPUSD SMT Divergence
These two forex pairs are highly correlated because both share the USD as the quote currency. However, when divergence occurs, it often signals liquidity manipulations.
How to Use:
- If GBPUSD makes a higher high but EURUSD does not, GBPUSD may be trapping breakout traders before reversing.
- If EURUSD makes a lower low but GBPUSD does not, EURUSD might be in a liquidity grab, signaling a potential reversal.
---
US100 vs. US500 SMT Divergence
The NASDAQ (US100) and S&P 500 (US500) are both major indices with a strong correlation, but tech-heavy NASDAQ can sometimes lead or lag the S&P.
How to Use:
- If US100 makes a higher high but US500 does not, it suggests US100 is extended and may reverse soon.
- If US500 makes a lower low but US100 does not, US500 might be experiencing a liquidity grab before a reversal.
---
XAUUSD vs. XAGUSD SMT Divergence
Gold (XAUUSD) and Silver (XAGUSD) have a historic correlation. However, due to differences in volatility and liquidity, they can diverge, presenting trading opportunities.
How to Use:
- If Gold makes a higher high but Silver does not, Gold might be overextended and ready to reverse.
- If Silver makes a lower low but Gold does not, Silver might be in a liquidity grab, signaling strength.
---
Indicator Used for SMT Divergences
To simplify the process of identifying SMT divergences, this guide utilizes the TradingView indicator TehThomas ICT SMT Divergences . This tool automatically detects divergences between correlated assets, highlighting potential trade opportunities.
You can access the indicator here:
Why Use This Indicator?
- Automatically plots divergences, saving time on manual comparisons.
- Works across multiple asset classes (Forex, Indices, Metals, etc.).
- Helps traders spot Smart Money inefficiencies with ease.
---
Final Tips for Trading SMT Divergences
1. Use Higher Timeframes for Confirmation: SMT Divergences on 1H or 4H hold more weight than those on lower timeframes.
2. Combine with Other Confluences: ICT concepts like Order Blocks, FVGs, or liquidity sweeps can strengthen the SMT setup.
3. Wait for Market Structure Confirmation: After spotting SMT divergence, look for a market structure shift before entering trades.
4. Be Mindful of Economic Events: Divergences can appear due to news releases, so always check the economic calendar.
---
Conclusion
SMT Divergences are a valuable tool for traders looking to gain an edge in the markets. By analyzing inefficiencies between correlated assets, traders can anticipate smart money movements and improve trade precision. Practice spotting these divergences on real charts, and soon, you'll develop a keen eye for hidden liquidity traps.
Happy trading!

How Leverage Works in Forex TradingDear readers, my name is Andrea Russo, and today I want to talk to you about one of the most discussed topics in trading: leverage in Forex. This tool, both powerful and delicate, allows traders to amplify their gains with small investments but also carries significant risks if not used prudently. In this article, I will guide you step by step, explaining how leverage works, its advantages and risks, and how you can start trading safely.
What is leverage in Forex?
Leverage is a tool that allows traders to control much larger positions than the capital actually invested. For example, with a leverage of 1:100, you can open a $100,000 position with an initial investment of just $1,000.
Here’s a simple example:
You invest $1,000 with a leverage of 1:100.
Your market exposure will be $100,000.
If the market moves 1% in your favor, you will earn $1,000 (equal to 100% of your capital).
If the market moves 1% against you, you will lose your entire capital.
As you can see, leverage amplifies both gains and losses, which is why it’s essential to understand how it works before using it.
Advantages of leverage
Leverage offers several advantages that make it an attractive tool for those who want to invest in Forex:
Access to the market with small capital: You can start trading even with modest sums, thanks to leverage.
Diversification: With limited capital, you can open multiple positions on different currency pairs.
Maximization of profits: Even small price movements can translate into significant gains.
The risks of leverage
Despite its advantages, leverage carries important risks:
High losses: The same amplification that generates profits can multiply losses.
Margin Call: If losses exceed the available margin, the broker may automatically close your positions.
Emotional stress: High leverage can lead to impulsive decisions, often driven by anxiety.
How to start trading in Forex with leverage
If you want to use leverage effectively and safely in Forex, follow these steps:
1. Educate yourself and learn the basics
First of all, study how the Forex market works. It’s important to understand what influences exchange rates and which strategies to adopt. Dive into key concepts such as:
Major currency pairs
Spread and commissions
Technical and fundamental analysis
2. Choose a reliable broker
The broker is your trading partner, so ensure that it is regulated and offers transparent conditions. Look for brokers with:
Competitive spreads
Flexible leverage options
User-friendly platforms
3. Start with a demo account
To practice, use a demo account. You can test your strategies without risking real money and gain confidence with the platform.
4. Set up a trading strategy
A good trader doesn’t leave anything to chance. Define a trading plan that includes:
Realistic goals
Percentage of risk per trade (1-2% of capital)
Risk management tools like stop-loss and take-profit
5. Start with low leverage
If you’re a beginner, use moderate leverage, such as 1:10 or 1:20. This will allow you to limit losses while learning to manage risk.
6. Monitor positions and manage risk
Risk management is the key to successful trading. Invest only what you can afford to lose and constantly monitor your positions.
Conclusion
Leverage is an incredible tool, but it must be used cautiously. It can open the doors of the Forex market even to those with limited capital, but it requires discipline, education, and good risk management.
Thank you for reading this article. If you have any questions or want to share your experiences in Forex, feel free to write in the comments.
And remember: trading is a marathon, not a sprint! Happy trading!

Common Mistakes in Forex Trading: How to Avoid ThemForex trading is the largest and most liquid market in the world, but precisely because of this, it is also one of the most complex and challenging. Many traders, especially beginners, often make mistakes that can jeopardize their profits or even wipe out their capital. However, with proper planning and greater awareness, it is possible to avoid the most common pitfalls and build a successful trading career.
In this guide, we will explore the 10 most frequent mistakes in Forex trading and provide concrete strategies to overcome them.
1. Not Having a Trading Plan
A trading plan is essential for any trader. Without a clear plan, it is easy to get carried away by emotions, make impulsive decisions, and lose money.
An effective trading plan should include:
Trading goals: Decide how much you want to earn and within what timeframe.
Risk tolerance: How much are you willing to lose in a single trade?
Entry and exit rules: Set criteria for opening and closing a position.
Capital management strategy: Determine how much of your capital to invest in each trade.
Practical example: if your goal is to earn 10% in a month, the plan should specify how many trades to make, which currency pairs to monitor, and the risk levels for each trade.
2. Inadequate Risk Management
A common mistake is risking too much capital in a single trade. This is a fast way to lose all your money. A good rule of thumb is to follow the 1-2% rule, meaning you should not risk more than 1-2% of your capital on a single trade.
For example, if you have a capital of €10,000, the maximum risk per trade should be between €100 and €200. This approach allows you to survive a series of consecutive losses without jeopardizing your account.
Additionally, it is essential to diversify your trades. Avoid focusing on a single currency pair or a specific strategy to reduce overall risk.
3. Not Setting Stop-Loss Orders
Stop-loss is an essential tool to protect your capital. It allows you to limit losses by automatically closing a position when the market moves against you.
Many traders, out of fear of closing at a loss, avoid setting stop-loss orders or adjust them incorrectly. This behavior can lead to losses much larger than expected.
Effective strategy: Set the stop-loss level based on your trading plan and never change this setting during a trade. For example, if you are trading EUR/USD and your risk level is 50 pips, set the stop-loss 50 pips away from the entry price.
4. Excessive Trading (Overtrading)
Overtrading is a common mistake, especially among beginner traders. The desire to "make money quickly" leads many to execute too many trades, often without a clear strategy.
Each trade comes with costs, such as spreads or commissions, which can quickly add up and reduce profits. Furthermore, excessive trading increases the risk of making impulsive decisions.
How to avoid it:
Stick to your trading plan.
Take a break after a series of trades, especially if they have been losing trades.
Set a daily or weekly limit on the number of trades.
5. Using Too Many Indicators
Many traders rely on a multitude of technical indicators, hoping that more information will lead to better decisions. In reality, excessive use of indicators can create confusion and conflicting signals.
It is better to choose 2-3 indicators that complement each other. For example:
Moving Average to identify trends.
RSI (Relative Strength Index) to measure market strength.
MACD (Moving Average Convergence Divergence) to identify entry and exit points.
6. Not Understanding Leverage
Leverage is a powerful tool that allows traders to control large positions with relatively small capital. However, it can amplify both profits and losses.
Many beginner traders use excessive leverage, underestimating the risks. For example, with 1:100 leverage, a small market fluctuation can result in significant losses.
Practical advice: Use low leverage, especially if you are a beginner. Start with leverage of 1:10 or 1:20 to limit your risk exposure.
7. Ignoring Economic News
Economic and political events have a profound impact on the Forex market. Ignoring the economic calendar is a serious mistake that can lead to unexpected surprises.
For example, interest rate decisions, employment data, or monetary policy announcements can cause significant market movements.
Strategy:
Regularly check an economic calendar.
Avoid trading during high-volatility events unless you have a specific strategy for these scenarios.
8. Not Backtesting Strategies
Backtesting is the process of testing a strategy on historical data to verify its effectiveness. Many traders skip this step, entering the market with untested strategies.
Backtesting allows you to:
Identify strengths and weaknesses in your strategy.
Build confidence in your trading decisions.
There are numerous software and platforms that allow you to perform backtesting. Be sure to test your strategy over a long period and under different market conditions.
9. Uncontrolled Emotions
Fear and greed are a trader's worst enemies. Fear can lead you to close a position too early, while greed can make you ignore exit signals.
To manage emotions:
Establish clear rules for each trade.
Take regular breaks from trading.
Consider using a trading journal to analyze your decisions and improve emotional control.
10. Not Staying Updated
The Forex market is constantly evolving. Strategies that worked in the past may no longer be effective. Not staying updated means falling behind other traders.
Tips to stay updated:
Read books and articles about Forex.
Attend webinars and online courses.
Follow experienced traders on social media and trading platforms.
Conclusion
Avoiding these mistakes is the first step to improving your performance in Forex trading. Remember that success requires time, discipline, and continuous learning. Be patient, learn from your mistakes, and keep refining your skills.
Happy trading!
Why I Invest Exclusively in Forex: A Strategic ChoiceInvesting in the currency market (forex) has gained popularity among investors worldwide due to its liquidity, accessibility, and profit potential. If you're wondering why I prefer to focus solely on forex and not diversify into other markets like stocks or cryptocurrencies, here are some reasons explaining my choice to concentrate exclusively on the currency market.
Unmatched Liquidity
Forex is the largest and most liquid financial market in the world, with a daily trading volume exceeding 6 trillion dollars. This extraordinary liquidity means I can enter and exit positions at any time without worrying about slippage or difficulty finding a buyer or seller for my trades. The high liquidity also makes the market more stable, reducing the risk of price manipulation and increasing transparency.
24/7 Accessibility
Forex is a global market that operates 24 hours a day, five days a week. This provides a flexibility that few other markets can match. I can decide to trade at any time of the day, fitting it into my schedule and routine without worrying about the fixed hours of other markets, like stock exchanges. This constant accessibility makes forex perfect for those with busy lives or those who prefer to trade during specific sessions, such as the Asian, European, or American sessions.
Low Barrier to Entry
Another significant advantage of forex is the low barrier to entry. You don’t need a large capital to start trading forex. Thanks to leverage, I can control a much larger position than my initial investment, potentially increasing returns. Additionally, many trading platforms offer free demo accounts, allowing me to learn and refine my skills without risking real money. The ability to start with modest amounts makes forex accessible to a wide range of investors, even those with limited budgets.
Less Volatility Than Cryptocurrencies
While cryptocurrencies promise high returns, they are notoriously volatile and risky. In comparison, forex tends to be more stable, especially when dealing with the most traded currencies like the US dollar, the euro, or the Japanese yen. While cryptocurrencies can experience price fluctuations of 10% or more in a single day, forex, though influenced by economic and political events, tends to move more predictably and in a controlled manner. For those seeking a less speculative and more regulated market, forex is a preferred choice over cryptocurrencies.
Predictability and Fundamental Analysis
In forex, currency movements are mainly influenced by economic factors such as interest rates, central bank monetary policies, inflation, and macroeconomic data. This predictability makes it easier to anticipate price movements compared to other markets. With a solid understanding of fundamental analysis, it’s possible to develop trading strategies based on economic events and government policies, providing a relatively clear basis for forecasting. On the other hand, the cryptocurrency market is influenced by unpredictable factors, including technological adoption, regulation, and speculation, making it harder to analyze.
International Diversification
Investing in forex gives access to a wide range of currencies from different countries and regions. This geographic diversification can protect the portfolio from risks related to individual stock markets or local economic crises. Furthermore, currencies behave differently based on global economic and political developments, offering multiple investment opportunities in different macroeconomic environments.
Less Dependence on Companies or Sectors
In stock trading, results are heavily dependent on the performance of individual companies or sectors. For instance, a corporate crisis or regulatory change can significantly affect stock values. In forex, however, performance depends on global macroeconomic factors, not individual entities. More stable currencies are influenced by monetary policies and economic data, making them easier to analyze and predict.
Risk Management
In forex, there are several risk management tools such as stop-loss and take-profit orders that help limit losses and protect gains. Furthermore, the ability to use leverage allows for higher returns but must be managed with caution. Risk management in forex is well-developed and allows for safer trading compared to other markets like cryptocurrencies, where volatility can lead to larger losses in a short amount of time.
Conclusion
Investing in forex offers numerous advantages, including liquidity, accessibility, relative stability, and the ability to trade 24/7. While every market has its risks, forex seems to be the most balanced for those seeking an investment that combines stability with profit opportunities. Though not without risks, forex offers greater predictability compared to cryptocurrencies and flexibility that allows for adaptation to changing market conditions. For these reasons, I’ve decided to focus my portfolio exclusively on this asset class.

AlgoTrading Basics for Beginners and Advanced StrategiesHello,
1 Introduction
Algotrading or Algorithmic trading has brought about a revolution in the financial markets: automation of trades with the help of complex algorithms. These algorithms execute trades according to predefined rules and are quicker in capturing market opportunities compared to manual trading. HFT in gold HFT-based algotrading has also greatly skewed the transaction volumes in recent years, but even though these trades are very short-term, they can tell us something about longer-term trading strategies.
---
2 What is Algorithmic Trading?
Algorithmic trading is a method of executing orders using automated, pre-designed trading instructions that account for variables such as trade timing, price, and volume. The platform has found application in the work of large financial institutions, hedge funds, and individual traders to facilitate the ease of trading strategy selection and optimization.
One might be, a set of rules that tells it to buy the gold if it falls below a certain level and sells as soon as the price of that gold hits a specified level. Traders can take advantage of small price movements without sitting in front of their screens all day.
---
3 Why use Algorithmic Trading?
There are various reasons as to why one would engage in Algotrading:
Speed: It is obvious that technology is used to carry out trades and computers do this faster than people. This proves extremely useful in fast markets like gold trading where prices may change in milliseconds.
Emotionless Trading: An individual does not deviate from the proposal; emotional elements like fear and greed that affect traders do not affect its operation.
Backtesting: Trading systems risk analyses can be done using test histories which access the performance of trading systems on historical figures, thus preventing any risk when trading.
Precision and Consistency: Algorithms maintain accuracy levels in trade initiation with almost never deteriorating without human intervention as only information is required regarding trading and no emotions.
---
4 Core Principles of Algorithmic Trading
Apart from trading in shares, forex or even taking a position in gold (XAUUSD) there are a few primary principles common to all algorithmic trading:
a Data Mining And Data Management
Technical Indicators – Besides backtesting and strategy optimization, algorithms employ very prominent technical indicators such as Moving Averages (MA), Relative Strength Index (RSI), Bollinger Bands, or other indicators associated with detecting trends or momentum.
Price Patterns – Other factors that might be of influence include pattern recognition algorithms which can be trained to identify specific shapes such as heads and shoulders, flags, or triangles, and thereby predicting price movements.
Volume Analysis – Volume analysis can be instrumental in price movement validation. Volumes increase during up-trend or down-trend and their analysis is essential when confirming trends or reversals.
b Machine Learning Models
Machine learning models aim to work in this way in modern algorithms with a view to predicting price changes in the near future. Algorithms that one develops or wires are fed with data sets and they learn patterns and devise methods of trading faster or more efficiently anyway as the case might be. There are other strategies like SVM, Random Forests, and Neural Networks that one can use to enhance predictive power.
c High-Frequency Trading
HFT involves placing numerous orders and getting them executed in split seconds and on some occasions microseconds. That is particularly attractive in cash markets like a gold market where there are narrow price bands in which one can place determinants and capitalize on the fluctuations.
---
5 Advanced Techniques in Gold (XAUUSD) Algorithmic Trading
Trading gold presents unique challenges and opportunities in the algorithmic trading world. Here are some advanced techniques tailored to the XAUUSD market:
Reinforcement learning has emerged as a powerful technique in gold trading. RL works as the trading systems interact with the market and improvise over the strategy by solving the problem by trying it in the market. This is useful for gold trading, as RL strategies are adaptable to external shocks such as economic news or investor sentiment changes.
They include sentiment predictions around precious metals.
Gold as an asset class has a unique character because it is a ‘safe-hoard’ asset and hence its price is subject to global and domestic conditions, military conflicts and general investor feel. Sentiment algorithms incorporate news, social networks, and reports on economics and stock markets to identify the mood of the investor's community. If there is a piece of news pointing to some uncertain or negative times ahead, then the algorithm predominantly directed by the sentiment may initiate purchases of gold.
---
6 The Future of Algorithmic Trading
Although this form of trading has not yet reached widespread use, the potential of quantum computing in investment strategies including gold markets is promising. Quantum calculations have been demonstrated to outperform classical computation in solving combinatorial optimization problems and processing big data. This can allow the development of new and better trading strategies and more effective utilization of unnecessary.
---
7 Practical Use of the Traders on Platforms like TradingView
With the inception of platforms like TradingView, algorithmic traders have been aided with a design, a test, and an automated strategy submission in the most reliant fashion.
a Algorithmic Strategies Implemented Using Pine Script
On its part, TradingView accepts user-written trading algorithms. Pine Script programming language is based on TradingView. These traders favor strategies resting on either technical indicators, patterns, or custom conditions. For instance, one can formulate a strategy to place a gold (XAUUSD) order whenever the price rises above its 50-day moving average and a closing order whenever the price goes down.
b Strategic Testing
Strategies (algorithms) are tested using back-testing methods incorporated in the trading software, this process is known as back-testing. A feature of the TradingView platform is that a trader can run their algorithms on record and see how those algorithms would have played out on historical data. This is important for adjusting the entry and exit plus the risk control parameters and further the performance of a strategy.
c Community Insights
Another benefit of using the TradingView platform is the community of traders around it who can post their strategies, exchange ideas, and learn from each other. You will be able to learn how other traders have taken to algorithmic trading with gold and other assets and be able to develop better strategies.
---
8 Tactics to Consider for New and Intermediate Trading Positions
The strategies provided for algorithmic trading may vary from simple to complex in levels. Below are some typical strategies that every trader should consider implementing in their trading practice:
a Trend Following
This is perhaps the most basic type of algorithmic trading. The idea is very simple; one buys those assets that are on the uptrend (bullish) and sells those that are on the downtrend (bearish). For example, in gold trades, a strategy for a trader may be quite simple: moving averages. For instance, an algorithm could be designed in such a way that it buys gold whenever the 20-day moving average of gold crosses the 50-day moving average upwards and sells when this situation is reversed.
b Arbitrage
Arbitrage strategies, as the very definition suggests, enable traders to exploit all such situations which emerge, due to the mispricing corrects routinely. In gold trading, for instance, this would refer to the action of selling short shares in an exchange retrieved in one exchange, where that price, would include a premium orchestrated by other markets.
c Mean Reversion
Mean reversion strategies originate from the classic concept that there is a high likelihood of prices returning to their average or mean. For instance, an algorithm buys an asset such as gold if its average is lower than the over its certain period moving average and sells whenever it is above that average.
d High-Frequency Trading (HFT)
HFT although it calls for many resources, there are traders who have this kind of approach to gold markets in that they seek to benefit from price changes within seconds or rather milliseconds HFT. This strategy also calls for other aspects such as having very good network connectivity to enable very fast execution of trades as well as high volume trades.
---
9 Conclusion
Algorithmic trading opens a world of opportunities for all kinds of traders. It doesn't matter whether you're a beginner looking into simple tactics such as trend-following or a seasoned trader putting more sophisticated approaches to work with gold (XAUUSD), there has never been a time that the tools and methods are more readily available to you for successful algotrading. Traders can use existing platforms such as our TradingView to develop, back & optimize their strategies to keep up with today’s fast-moving financial markets.
The financial world is evolving and staying up to date with these new breakthroughs in technology, including machine learning, sentiment analysis, and quantum computing will help give the traders the edge. Algorithmic trading can become everyone’s thing if one is patient, disciplined, and keeps learning.
Regards,
Ely
