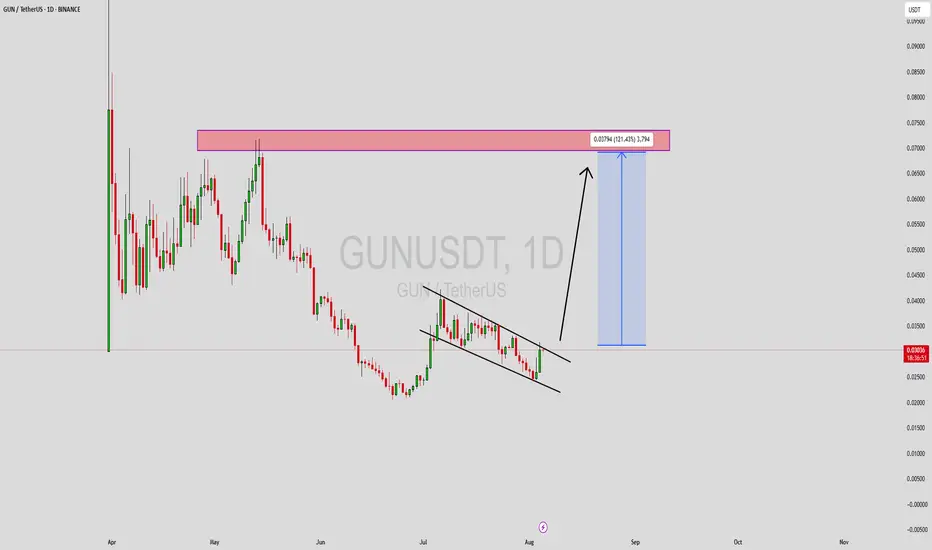
GUNUSDT Forming Descending ChannelGUNUSDT is forming a Descending Wedge Pattern, which is a strong bullish signal often seen before major upward breakouts. This pattern typically signifies decreasing selling pressure and builds up buying momentum. As the price moves closer to the apex of the wedge, a breakout becomes increasingly likely. In the case of GUNUSDT, this setup is showing strong potential for a sharp price reversal, particularly with volume backing the move.
The volume analysis on GUNUSDT supports this bullish scenario. Consistent and increasing buy-side interest in recent sessions suggests accumulation by smart money ahead of a potential breakout. When price action aligns with strong volume behavior in a descending wedge, it often results in an explosive rally. Based on the pattern structure and current trend dynamics, a projected gain of 90% to 100%+ is highly plausible once the breakout is confirmed.
GUN is also gaining traction due to its unique use case and increasing community involvement. As interest continues to grow in niche sectors of crypto, coins like GUN that are backed by strong fundamentals and community support tend to outperform during bullish phases. This project is now on the radar of technical traders and investors looking for breakout plays.
With a technically sound formation and bullish sentiment building across the market, GUNUSDT presents a high-reward setup. Watching closely for confirmation of a breakout could offer a timely entry into what may be a powerful upside move.
✅ Show your support by hitting the like button and
✅ Leaving a comment below! (What is You opinion about this Coin)
Your feedback and engagement keep me inspired to share more insightful market analysis with you!
GUNBTC
GUN Analysis (4H)By analyzing he GUN chart, a large wave B can be identified, which started from the point marked with a green arrow.
This wave appears to be a diametric, and we are currently at the end of wave F of this diametric. It is expected that wave F will complete at the green zone and wave G of the diametric will begin from there. Wave G is bullish.
The targets are marked on the chart.
A daily candle closing below the invalidation level will invalidate this analysis.
For risk management, please don't forget stop loss and capital management
When we reach the first target, save some profit and then change the stop to entry
Comment if you have any questions
Thank You

GUN Up 40% – Bullish Momentum Ahead? (2H)We have a bullish structure on the chart, and an interchange zone in the upper areas has been cleared, but the price hasn't formed a new low. A trigger line and a flip zone have been broken.
We expect a move toward the targets from the demand box.
The closure of a 4-hour candle below the invalidation level will invalidate this analysis.
For risk management, please don't forget stop loss and capital management
When we reach the first target, save some profit and then change the stop to entry
Comment if you have any questions
Thank You

GUN New Update |Bearish (4H)This analysis is an update of the analysis you see in the "Related publications" section
We are still within the green zone from the previous analysis; however, due to the formation of supply bases and the current candlestick structure, the previous scenario is now invalid.
Based on the latest data, it appears we are in an ABC correction where wave B has formed a triangle. This presents an opportunity to enter a Sell/Short position.
A daily candle closing above the invalidation level will invalidate this analysis.
For risk management, please don't forget stop loss and capital management
When we reach the first target, save some profit and then change the stop to entry
Comment if you have any questions
Thank You
