EURGBP: What Are You Anticipating With This Volatile Pair?I am a swing trader, as you can probably tell from the timeframes I use in my posts. However, I do believe that EURGBP lends itself better to day trades or position trades, if you can stomach the movement. Considering it has made, for me, surprising reverses just when you think it would push further, I offer a couple of scenarios for both a sell and buy possibility. I do see EURGBP selling further but this is a pair you want to be prepared for movement in the opposite direction as well. Game plan, ready! What would be your move?
H4chart

double zig zag abc wxy wave near $2720 resistance levelbefore last fomc meeting gold collapsed in big but since fomc rate cut last time
gold is constantly going up making higher highs with higher lows a clear up trend
wxy waves subdivided into small degree abc waves has reached big static horizontal resistance level $2720
a blue parallel channel with upper line tested near resistance on last friday
projection for wave Y near resistance level

golden trend lineprice collapsed on fed hawkish dot plot but since than it is doing up side correction
this yellow trend line has become strong support level on h4 intraday chart

FACT(NSE) Stock - Applying Bullish Breaker Concept on TradingTrading is simple!
All you need to know is Premium / Discount Arrays to understand market dynamics.
Choose the Higher Time Frame (HTF) PD array and trade Lower Time Frame (LTF) PD array.
Time Frame Alignment
HTF - H4
LTF - M15
HTF PD ARRAY - Bullish Breaker
LTF PD Array - Bullish Breaker
Higher Time Frame gives you market direction.
Lower Time Frame gives you entry opportunity

BTC USDT DIAMOND PATTERN H4if the price breaks the right upper line, you get a confirmation of the trend reversal, set a sl below the latest bottom that has formed within the diamond formation.

trend line vs fed cutgold price are rising making higher high with lows
price is making strong support on yellow trend line
first static support $2530
fomo buyers are happy because trend is their friends
until one day changes everything

gold 2590 vs 50bps cutgold price were range bound in $60 price area but suddenly it breakout on wsj and ft news article on 50bps first cut size possibility.
after years of ZIRP and QE big size cut can spark second inflation wave risk
since usa economy has not reached into deflation like china
this year alone fed has ignored second inflation wave risk two times
first in march by saying January effect and inflation bump and second times in Jackson hole speech
if fed start cutting rate while ignoring second inflation wave risk is the reason gold breakout the range and trading near $2590
on this h4 time frame - there are two support
yellow line dynamic support
$2530 static horizontal support
if final message of speech stay dovish than gold will stay above $2590
if hawkish then price will retrace back to $2530

Multi-Timeframe Live TradingThis strategy follows a multi-timeframe approach, using the 4-hour (H4), 1-hour (H1), and 15-minute (M15) charts.
We start with the H4 timeframe, which gives us the overall market direction. It’s important to trade in line with this timeframe whenever possible.
If there’s no change in direction on the H4, we move to the H1 to guide our next trade decision. If both the H4 and H1 show no change, we continue to follow the H4 trend.
For the Tokyo session, we're focusing on CAD/JPY, which has shifted into a short-term uptrend, despite the H4 and H1 remaining in a downtrend.
The potential trade for the London session is GBP/USD, aiming to trade the end of a bearish wave on the 15-minute chart.
Happy Trading!

intraday key levelsgold price are going on global central bank rate cut news
currently trading few dollar below all time high
all big level on h4 time frame
horizontal support and yellow trend line (dynamic support)

Bearish Butterfly H4Open - 1.10158
TP - 1.9169
SL - 1.10728
Please note that my setups are not signals to trade but my own personal analysis and predicted direction. To enter a trade it must be validated by multiple different indicators and confluence factors.
Happy trading!!!

Comprehensive GBPUSD Analysis Ahead of UK General ElectionThis is a comprehensive analysis of the GBPUSD ahead of the UK General Election scheduled for Thursday, 4th July 2024. The chart has been marked to highlight key levels (Decision-Making Points) on the weekly, daily, and H4 timeframes. Below is a summary based on the price analysis:
Weekly: Strong Bearish
The wave structure on the weekly chart indicates a bearish expectation.
Daily: Bearish Wave Structure
The daily chart shows a second bearish wave structure with a lower low.
H4: Bearish Wave Structure with Pullback
The H4 chart has completed a bearish wave structure and shows a valid pullback.
H1: Bearish Momentum
This morning, a momentum low was made, and the current pullback aligns with the second bearish wave structure.

ICT Longsetup HK50👋Hello Traders,
Our 🖥️ AI system detected that there is an H1 or higher timeframe ICT Long setup in HK50.
Please refer to the details Stop loss, FVG(Buy Zone),open for take profit.
For more ideas, you are welcome to visit our profile in tradingview.
Have a good day!
Please give this post a like if you like this kind of simple idea, your feedback will bring our signal to next better level, thanks for support!

big intraday support level before big newsgold price dropped $100 in friday last week on china central banking stopped buying gold and hot nfp number which risk fed projecting 2 cuts instead of 3 and first cut after election
price now side near 2300 psychological number after big dump
price has failed to breakout big yellow support zone near $2280 in first attempt

strong trend in goldgold price dumped in big way on strong nfp number
but price mostly came down before news
but still you can't ignore 4% ur after long time
you have declining trend line tested 5 time while rising rsi
price have not even tested 2300 psychology level but sentiment are bad for gold right white first cut shift post election
overall white trend line is your big dynamic support level

If this breaks H4 zone in H1Bullish momentum is strong, News striked our first Entries but we can enter as soon as H1 breaks the zone and comes back within the first 10 or 15 min. Do not take reentries. Wait for candle close in H1. 300pip SL and for Exit 1 hit before setting BE.

A US stock: CVX, Long setup, Swing trade H4 or above timeframe👋Hello Traders,
Our 🖥️ AI system detected that there is an H4 or higher timeframe ICT Short setup in US stock : CVX for Swing trade.
Please refer to the details Stop loss, FVG(Buy Zone),open for take profit.
For more ideas, you are welcome to visit our profile in tradingview.
Have a good day!
Please give this post a like if you like this kind of simple idea, your feedback will bring our signal to next better level, thanks for support!

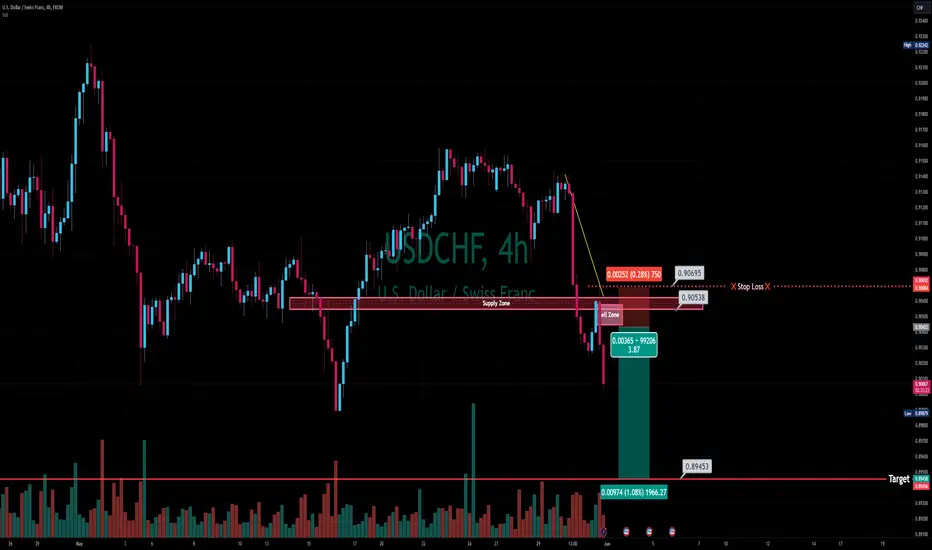
Swing trade, short setup USDCHF👋Hello Traders,
Our 🖥️ AI system detected that there is an H4 or higher timeframe ICT Short setup in USDCHF for Swing trade.
Please refer to the details Stop loss, FVG(Sell Zone),open for take profit.
For more ideas, you are welcome to visit our profile in tradingview.
Have a good day!
Please give this post a like if you like this kind of simple idea, your feedback will bring our signal to next better level, thanks for support!
simple trendline gold price are going sideway correction above 2150 support but below white trend line
before big news fed fomc

XAU/USD 12 Feb 2024 Intraday AnalysisH4 Analysis:
-> Swing: Bullish.
-> Internal Bearish.
-> Has reached EQ.
Price printed double bullish iBOS to confirm swing pullback phase is complete.
Currently internal structure remains bearish.
I have now started to map all CHoCh's to gain a micro-view of structure due to the nature of price action and the size of ranges.
Expectation remains as H4 analysis, for price to continue to trade bearish to target weak internal low.
H4: Chart:
M15 Analysis:
-> Swing: Bullish.
-> Internal: Bullish.
-> Sub-Internal: Bearish.
-> Has reached EQ.
Following swing BOS price very aggressively pushed to the upside.
Price printed a bullish iBOS where we are now in the pullback phase.
Sub-structure to internal structure, which is marked in red printed bullish iiBOS followed by a bearish iiBOS.
Intraday expectation -Price to target weak internal low at 2001.895.
M15 Chart:

XAU/USD 22 Jan 2024 Intraday Analysis-> Swing: Bullish.
-> Internal Bearish.
-> Has reached EQ.
After the swing BOS price aggressively moved to the upside.
Price printed double bullish iBOS to confirm swing pullback phase is complete.
Currently internal structure remains bearish following second bearish iBOS. Price pulled back to premium 50% EQ.
Expectation is for price to continue to trade bearish to target weak internal low.

XAU/USD 19 Jan 2024 Intraday Analysis -> Swing: Bullish.
-> Internal Bearish.
-> Has reached EQ.
After the swing BOS price aggressively moved to the upside.
Price printed double bullish iBOS to confirm swing pullback phase is complete.
Currently internal structure is bearish. First aggressive structural indication that pullback is underway (CHoCH) where price is reacting at H4 supply zone.
Await for bearish structure formation to target weak swing low priced at 2001.795.

golden trend line price are coming down from 2088 level on h4 time frame
price is making lower low with lower high a clear down trend below yellow
if trend line breakout instant bullish from 2016 but until breakout it is bearish

EU outlook for this weekI have a lot on this week outside of the markets. This is my thoughts on EU which follow on from last week's idea. I'll be looking for M15 zones to hook in and ride price action when time allows. I'll update below when I'm at the charts and see anything interesting so be sure to subscribe to this idea, below.
