TSLA: What's next?Hello traders and investors! As its Friday, let’s do our usual Multi Time Frame Analysis (MTFA) on Tesla! It did a phenomenal movement today, just when everybody thought it would finally drop!
The situation is more complex than usual. The hourly chart is still bearish , and today’s movement could be just a pullback to the 21 ema, which is pointing downwards, and after it lost the purple trendline , we only see descending tops and bottoms. As long we don’t see ascending tops and bottoms, Tesla will continue to fall. This is quite bearish. Also, we have this blue line at $ 372.20, which we will talk about later.
On the other hand, we have the daily chart:
After Tesla triggered the Dark Cloud Cover candlestick pattern on Sep. 2, it just did what it was supposed to do: It looked for its supports. The first target was the 21 ema , and it held the price very well today!
I see the purple line at $ 359 as a very important support, but since the pullback was very weak today, Tesla didn’t even hit it. Right now, the candlestick is a Hammer , which is a bullish pattern ( at least in theory ), especially now that it is close to a support level.
The hourly chart is bearish, the daily chart is bullish. How about the weekly chart?
See why I find this purple line important? It is a pivot point in the weekly chart. If Tesla loses it, the next target is the 21 ema, and it will be an indicator that the trend is finally losing it strength in the mid/long-term.
Remember the blue line seen in the hourly chart? If TSLA loses it, could trigger a pivot that would lead it to the purple line seen on the daily/weekly chart. The fight will be very intense if Tesla hit this point!
And if this purple line will be lost, Tesla will frustrate the bullish pivot seen in the weekly chart , and it could sink down the price a little bit more.
Either way, the decisive movement can be spotted on the hourly chart first. Let’s keep our eyes open! And if this idea helped you, please, support it! And I invite you to follow me to keep in touch with my daily analyses. I’m sure you’ll find something helpful around here.
Stay safe.
Hammer

📖 Japanese candlestick charts. Part 1We are beginning a new theme “Trading strategy’s most important technical analysis tools”.
Today we are going to tell you about the most important things in trading, candlesticks!
📌Japanese candlestick charts were developed in the 17th-18th centuries by the Japanese rice traders. They were introduced to trading by Steve Nison in the 20th century. It's a simple, but very important tool for technical analysis, as these candlesticks contain different information about the market. I guess that everyone in this channel already knows how to read candlesticks, so we are going to talk about their usage.
⚡️First — its form, this shows market participants’ state and mood. It could show their doubts/balance (doji) or trend exhaustion (graph looks like a hammer or a falling star). There are only a few main models, and we are going to talk about them in the future. However, you can start learning about them yourself by saving the screenshot below.
⚡️Candlesticks show reversals and it is what we need in trading. By trading reversals you are catching the trend, it could be short or long. However, you will be able to understand when the trend is exhausting and you will be able to leave trade when there is a reversal. In addition to the presence of the reversal pattern itself, the preceding trend is important, you have to have at least 3 candles. If there isn’t a clear trend, then there is no trade. Additionally, we are looking at the candlesticks’ volumes and how trading continues after the last reversal pattern. We are entering position not on the reversal candlesticks, but on the following ones after the trade (or candlestick above/below fixation, depending on a situation)! Reversal setup is a needed factor, but it's not enough to enter a trade.
📌 And these are not all of the necessary conditions for implementation! You have to understand that you are getting rid of risky positions that not only will give you headache but could also result in losses. You should only trade in situations where you are confident in, the confidence is achieved by fulfilling very certain conditions, of which only few people in the market know about. Continued in part 2.

📖 Japanese candlestick charts. Part 2Hello, we continue to study candlesticks.
⚡️ Maximal/minimal
🔶 For this it is desirable for reversal candlestick to have its own high/low. In addition to the convenience of placing stop-loss on them, its own minimum/maximum also increases the chances for a long term trend after such reversal. The reason for this is in the market reflectivity, all the patterns don’t just work on their own, but they also contain market’s psychology and the methodology of huge amounts of smart money. When there is a decrease in demand and supply, smart money form the least resistant trend, and they trade!
🔶 You have probably noticed a few times that the figure’s/pattern’s price could move into the opposite direction that you expected. There are reasons for that, patterns have the necessary to complete conditions, simply of which not many know about. Even if all the necessary conditions are complete while forming a pattern, there is always a chance that the price will go opposite direction due to a number of reasons, of which we are going to talk about later. Now, you should note that its important to analyse candlesticks, as they help you to minimize risk while trading patterns.
🔶 Even though candlesticks look simple, they are a solid foundation for successful trading. They help you to find the optimal points to enter and exit trading in any patterns or whether you are trading using levels, or even if you are witnessing “third Elliott wave”... This is just a small bit of information about such a simple tool called Japanese candlesticks.
📌 Hint: if a trend is moving into a higher timeframe, you should also move to the same timeframe and start searching for reversal candlestick models at a long distance. This gives you the opportunity to trade for the entire trend duration.
⚡️ Harami
🔶 "Uptake", "Hammer" and "Cloud Silver Lining" models are common reversal patterns. There are many more forms in candlestick analysis that indicate an forthcoming reversal. One of them is the "Harami" pattern: the first candlestick is large, and the second one is small, it may be a "Spinning Top" or a "Doji", but in any case, the figure of the second candlestick is inside the first one's figure. They appear both at the top of the market and at the bottom.
🔶 The peculiarity of the "Harami" model is the uncertainty of the market at the time of its appearance. Therefore, it is recommended to wait for confirmation.
📌 The following candlestick of the corresponding color can act as confirmation: green for a bullish reversal, and red for a bearish one.

Gold short term trend reversalNext week may also be bearish, but I see a strong move regaining the losses of the last 2 weeks coming soon.

Short FTSE100 - Hammer forming?It looks like a hammer could be forming in the FTSE100 today. I am short here and adding until the 50dMA at 6165 area. Looking for a pull back to 6050. Good luck!

AUDJPY best time to BUY? Reasons :
In AUD/JPY price protected by serveral important factors which:
1. As you can see , price react to EMA 22 very well, EMA 22 currently price: 1.7100
2. This Pair Price protected from bears by very important static support ( this support was a resistance , when it breaks turn in to support ) :1.7060
3. Our Trade Stoploss protected by nice trend line ( DYNAMIC support ) near static support.
4. After hanging man candel stick , we saw a full engulfing candel but bulls use any chance to buy at our setup entry price ! it means there is a great DEMAND area!
1:2 RR

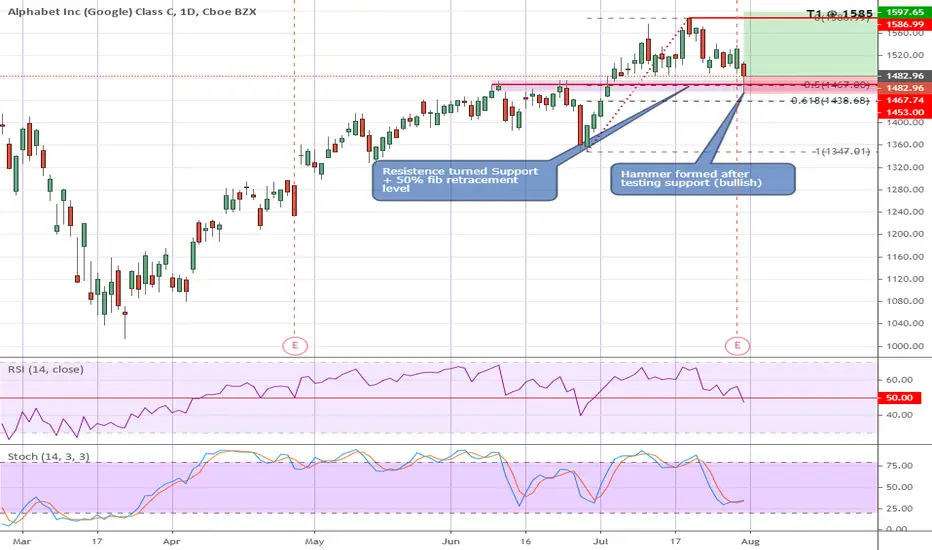
GOOG - the case for reboundGOOG retraced 50% of it's recent swing up last Friday and closed with a hammer candlestick above this level. Despite being a "red" hammer, it is potentially bullish as it initially pierced below the 50% fib level @ 1467 but closed above @ 1482.
Incidentally, 1465-1485 is also a prior "resistence" zone turned support.
Long at 1482 with initial stop @ 1450 (a few ticks below Last candle's low) with near term profit @ 1585 (recent high). Protect profits with trailing stops should the trade goes our way.
Disclaimer: This is just my own analysis and opinion for discussion and is not a trade advice. Kindly do your own due diligence
Swing trade entry using hammer candlestickEntry above the hammer as indicated by the
arrow. The price will probably come down for
the next several days before reversing(I am
anticipating a bear trap at around $164). If bulls
begin appearing then it should rise to the order
entry. At this point it will make another
attempt to break all time highs. I will take some
profit here and expect a small rest before
breaking ATH, and eventually reaching target 2.

AUDNZD 4hr bullish butterfly and hammer combination longThe dollar had been fluctuating a lot for the past few days,
it's not a bad idea to look for some minor pairs' trading opportunity.
Here we got this AUDNZD bullish pattern,
I'll be willing to take the breakout long on the hammer.
Let's see how it goes yo!

BTC Targets for the next 15 hours.looks like it's formed another flag and is bouncing off the top of the green fib channel.
Keep an eye on the purple trend line. Btc has been rejected off of it time and time again over the past month.
I believe it could reject again down to 9,080, or break out into the 9,700 area.


Possible bull continuation at the bottom of a forming triangleTriangle formation at 1D time frame. It is resisted three times to the long side along the trendline. It also supported two times the second time with a hammer at the bottom. I could possibly continue up to the bull side if we get one or preferably two more confirmations to enter. It could also retest and continue down to the main upward trendline, but again we need more confirmation to enter either side, but for now I am inclining myself more to the bull side.

CCL Swing Trade for Monday 6/15Bullish breakout stop limit at 20.33, stop loss exit at 18.35.
Based on the hammer candle from June 12th.

#US500 #SNP500 #SPX Bearish Hammer Candle Trader, there is a Bearish Hammer Candle #US500 #SNP500 #SPX.
____________________________________________________
Traders! if you like my ideas or have your own ideas to share on this market, comment below so that we can discuss.
Disclaimer:
The content on this analysis is subject to change at any time without notice, and is provided for the sole purpose of education only. Not a financial advice or signal. Please make your own independent investment decisions.
____________________________________________________

PTON Hanging Man Close Gap Bellow Hammer Pull Back ReversalPTON Hanging Man Close Gap Bellow Hammer Pull Back Reversal Canlesticks

ETH giving BTC the Hammer, LiterallyETHBTC has thrown a very bullish signal from trendline support today in the form of a large bullish hammer. I like this setup for a number of reason 1)the hammer that formed was large in size 2) price bullishly reversed from a key support level 3) there was almost no upper wick on the candle. I think the chances are very high that ETHBTC rallies into the resistance area marked on my chart.

AMD - Correction Is Over, AlphaOverBeta Technical AnalysisHello Traders,
Analyzing AMD from the technical perspective, we see that the peak was reached at 57$,
After that, the stock retraced some of the gains and went back to the support of 52$ and the stock is now ready for the next leg up.
Our stop loss is set at 49$, a healthy 3$ spread, there is a greater chance that the stock will move to the upside but in case it does not and the correction turned into a downtrend, we close the entire position at 49$
Today (May 27th) is an interesting day for the price pattern of the stock, a clear hammer is formed supporting the uptrend hypothesis,
The support of the 52$ is also the 50 days EMA which also served as support since April 2020.
Trade Smartly,
Alon, AlphaOverBeta

GBPJPY - H1 - Double Top - SELLGBPJPY - H1 -Double Top - SELL
We have a breaish trend on the H1 chart and price made a Double Top with a Pullback under the 200 MA,
with long wicks candles: a Hammer and a shooting star this tell us that de Bears are taking the lead.
We enter short @ 130.75.
■■■■■■■■■■■■■■■■■■■■■■■■■■■■■■■■■■■■
Entry: 130.75 | Stoploss: 131.25 | Takeprofit1: 130.05 |
■■■■■■■■■■■■■■■■■■■■■■■■■■■■■■■■■■■■
■■■■■■■■■■■■■■■■■■■■■■■■■■■■■■■■■■■■
If you like this idea please click the like button to support this channel, thanks.
■■■■■■■■■■■■■■■■■■■■■■■■■■■■■■■■■■■■■
Disclaimer: All information and ideas provided is for educational purposes only. It is not a recommendation to buy or sell.
■■■■■■■■■■■■■■■■■■■■■■■■■■■■■■■■■■■■■

SUM: Unusual volume off a rising TL SUM has bounced off a rising TL with a hammer candlestick and an unusually daily volume. In H1 chart, we have a nice breakout offering good levels for entry and stop loss.


(Vision is needed)ALERT; Look for a break above the HAMMERs before entering into a position move to the upside watch for volume, and the tape. GL

Price action & Psychology - Triple bottom, rejectionHello !
Key points:
Triple bottom
Rejection at support
Spike in volume
That price rejection actually tells us that people were afraid and panic sold at open, driving the price down until it encountered some buying pressure and price went back up.
When gauging this candlestick pattern, it is important that :
It is at a support level
Occurs after a selling wave
Shadow/wick goes below previous swing point low
A volume increase
An obvious wider price range
Look at the previous candlestick, it clearly tells us that there was some buying pressure but not enough momentum to carry the price up. Furthermore, it pulled back, I'd guess, halfway at previous "resistance" from the second bottom.
Thanks for reading and if you have suggestions or wanna discuss the idea, just leave a comment, I'll be happy to answer.
***Disclaimer : This is not an advice to buy the stock. Please, be aware that trading is a matter of probabilities and that it takes only ONE trader to deny your trade.***
