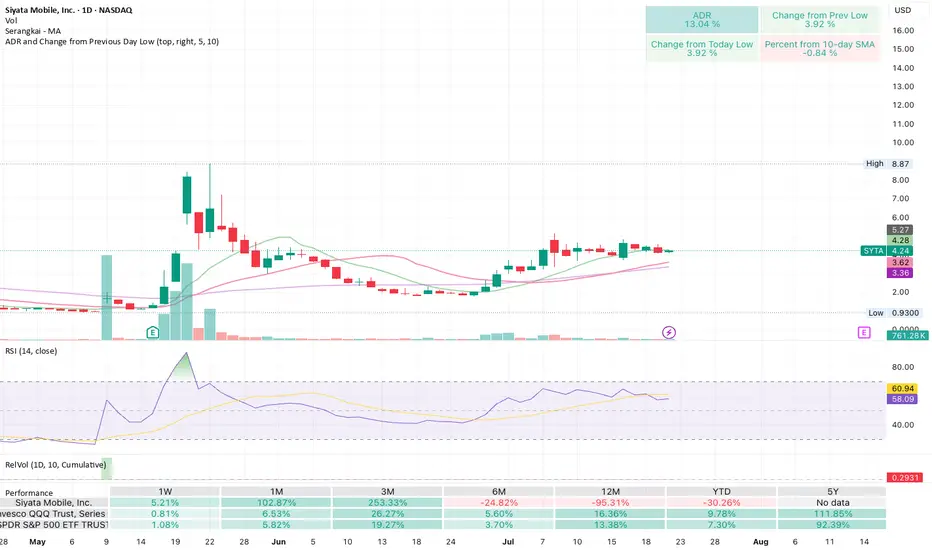
Getting ready to blow! Cup and handle after positive surprisesSiyata makes 2-way telecoms for things like first responders, miltary, construction crews.
Had big earnings and revenue surprises a few weeks ago, and now looks to be forming a cup and handle. Low volume yesterday shows a squeeze pattern like it's getting ready to go.
Handle
Cup and Handle Formation in Angelone ChartDisclaimer : Do your own research before investing. This is just a chart analysis for education purpose only. No recommendation to buy and sell.
In Dec 2024, AngelOne made high of Rs.3500 and pull back to level of Rs.1941 in March 2025.
After touching level of Rs. 3288 , its now trading at Rs. 2805.
I can see a cup and handle chart pattern formation in this stock. to me , it will be bullish in near to long term.
I have mentioned my targets along with stop loss.

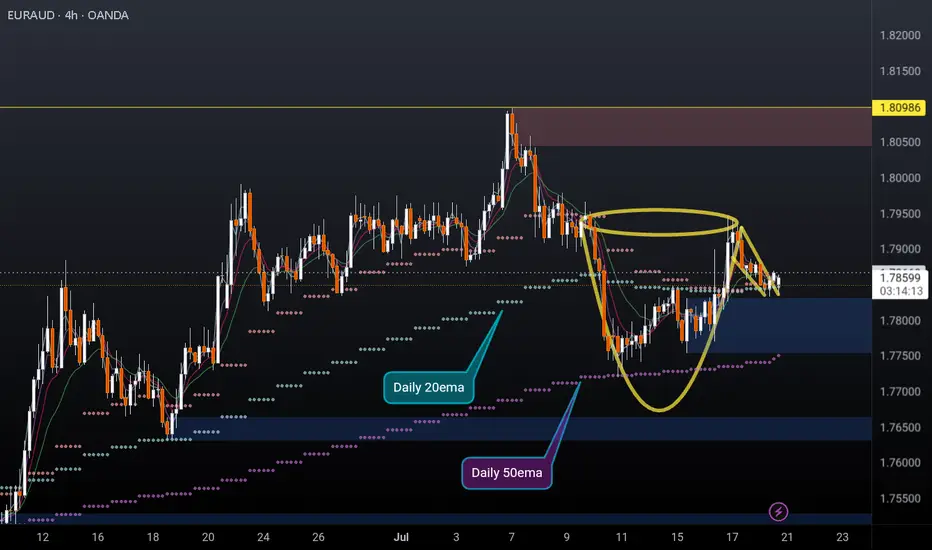
EURAUD 4H cup and handleEURAUD 4H cup and handle formed and possibly breaking out to the upside. Price recently found support off the daily 50ema (overlayed on this 4h chart) and is holding above the daily 10 & 20EMAs (overlayed).
I'm a cat not a financial advisor.
Arkham (ARKM) Structure Analysis (1D)Interesting chart for BINANCE:ARKMUSDT
Apologies for the trendlines mess, but they're all potentially relevant.
Watch for
• Bounce at ~$0.49 (0.786 Fib)
• Break above the yellow and orange resistance trendlines (~$0.57)
These conditions could form a Cup & Handle pattern and lead to a retest of the $0.80-$0.85 supply zone.
If that it broken, it could set the next target to ~$1.25.

ApeCoin (APE) Cup Pattern (1D)After a deviation below demand, BINANCE:APEUSDT formed a clean rounded bottom, reclaimed the zone, briefly consolidated, and it's now attempting to break above resistance.
Key Levels
• $0.79: Current resistance
• ~$0.65: Current support, breaking it might lead to the formation of a handle
• $0.50-$0.60: Main demand zone and logical pullback target in case of a handle
• $1.20: Measured breakout target, and previous swing high
Worth watching it closely for a daily close above $0.79 with good volume to activate the target.
Alternatively, look at the $0.50-$0.60 area for a reversal in case of a rejection here.

Curve (CRV) Structure Analysis (1D)BINANCE:CRVUSDT formed a rounded bottom (cup) and a minor rectangle, and it's currently attempting to break above the local $0.83 resistance.
Key Levels to Watch
• $0.64: Current support and minor rectangle lower boundary
• $0.83: Current resistance, cup and rectangle upper boundary
• $1.00: Measured target from the minor rectangle pattern
• $1.30: Measured target from the cup pattern (within a key supply zone)
Other Important Levels
• $0.20: Key demand zone, and 2024 low
• $0.40-$0.50: Key S/R dating back to November 2022, aligned with the cup bottom
• $1.20-$1.30: Main supply zone, dating back to February 2023
A daily close above $0.83 with volume would confirm the breakout and trigger the targets.

Solana (SOL) Cup & Handle (1W Log)BINANCE:SOLUSDT has formed a Cup & Handle pattern on the weekly chart, and arguably already broke out of the handle.
The measured move target based on the linear depth of the cup is ~$510.
Key Levels to Watch
• ~$100: Local low and 0.618 Fib of the cup depth, a typical handle retracement in a Cup & Handle pattern.
• $260: Cup & Handle neckline and key horizontal resistance. A decisive weekly close with strong volume above this level would confirm the pattern and activate the measured move target.
• $510: Measured move target based on the depth of the cup from the neckline.
Considerations
Volume confirmation remains key. A breakout above $260 with strong volume could validate the pattern and open the path to $510.

Silver-led profit-taking weighing on goldGold reached a fresh record high above USD 3,050 an ounce before some end-of-week profit-taking, led by silver and platinum, helped trigger another, so far shallow, correction. The recent rally has pushed the price of a standard 400-ounce (12.4 kg) gold bar—held by central banks globally—above USD 1,200,000, a tenfold increase since the start of the 21st century. Beyond reinforcing gold’s status as a long-term buy-and-hold asset, this surge reflects growing global instability, which has fueled strong demand for safe havens like gold and, to some extent, also silver.
Since the November 2022 low, gold has rallied by around 80%—a phenomenal performance by an asset often criticized by Warren Buffett, famously calling it an unproductive asset, with his argument being that gold does not generate income, unlike stocks, bonds, or real estate, which can produce dividends, interest, or rental income.
While managed money accounts have been net sellers during the past seven weeks, reducing their net long by 5.2 million ounces to 18.2 million, potentially signalling a short-term peak, asset managers and other more long-term-focused investors have increased total holdings across exchange-traded funds by 2.9 million ounces to 86.2 million—still a far cry from the pre-US rate hike peak at 106.8 million ounces—highlighting plenty of room for additional demand should the underlying trends continue to support. Read more in our latest gold update here.
Technical analysis suggests that gold’s short-term peak is around USD 3,100, potentially followed by a period of consolidation before a renewed attempt toward our year-end target of USD 3,300 per ounce. After three failed attempts, last year’s breakout above USD 2,074 confirmed the completion of a cup and handle formation, developed over a 13-year period (2011–2024). Using the distance from the cup’s bottom (large box) to the handle’s top (small box), the technical target is USD 3,100.

XCN beautiful 2000% gainWith XCN popping off and everyone now wanting a piece of the action. XCN is not finished. I entered XCn on the 3 vertical orange lines. Every entry and exit was more beautiful than the last first 125% then 230% or so then 2000%. We are now at $0.012 roughly and holding above the 200EMA
Forming a clear cup and handle, (if your new to the game check out DIMO, the cup and handle formed right before multiple major take offs)
Bitcoin is showing support, and we all know what happens when that happens. Now is a better entry than ever, we could se a bit lower but I doubt past $0.01
However looking at June 15th 2022 we see a major push down followed by an immediate rejection, this is still possible but overall I believe this will hit its ATH and more being $0.10, $0.18, $0.35, $0.50 potential
Not financial advice but if your kicking yourself for missing a very very easy 2000%
It’s not over.
Good luck and have fun with it
Not Financial Advice

TOTAL CRYPTO MARKET CAP is back-testing the cup & handle patternIt's no mystery that the crypto market has been getting hit pretty hard since mid-December. However, the total market cap—which had previously broken out of a nice cup-and-handle pattern—is now backtesting the rim line and looks to be setting up for what could be an incredible move upward over the next 6 to 9 months, with the potential for a double within that timeframe.
Good luck, and always use a stop loss!

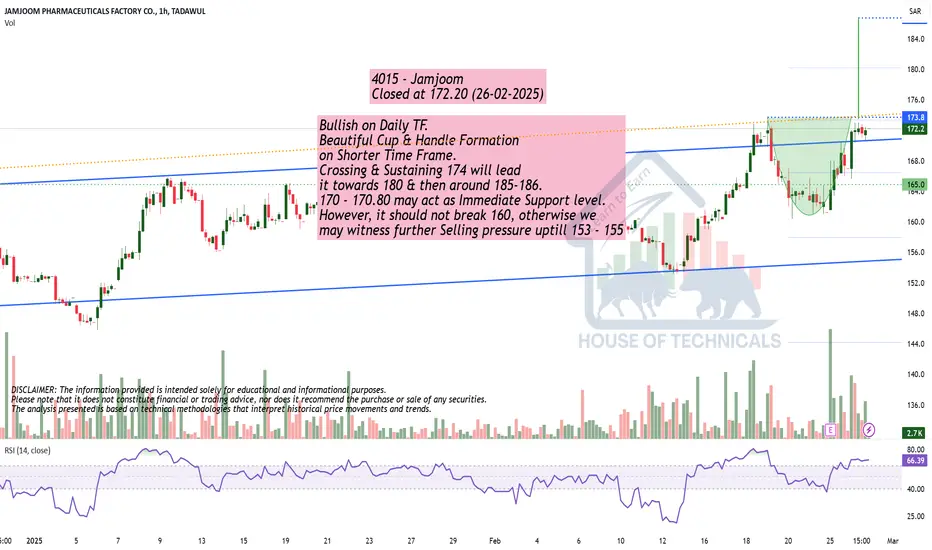
Bullish on Daily TF.Bullish on Daily TF.
Beautiful Cup & Handle Formation
on Shorter Time Frame.
Crossing & Sustaining 174 will lead
it towards 180 & then around 185-186.
170 - 170.80 may act as Immediate Support level.
However, it should not break 160, otherwise we
may witness further Selling pressure uptill 153 - 155
Salesforce (CRM) – Bullish Setup AnalysisWeekly Chart – Cup and Handle Formation
• The stock has formed a classic cup and handle pattern on the weekly timeframe.
• Moving Averages (20 & 150) are trending upwards, supporting bullish momentum.
• After breaking out, CRM retested the breakout level as support and is now showing signs of continuation.
• The potential long-term target stands at +60% upside, aligning with the measured move projection.
Daily Chart – Consolidation & Breakout Retest
• The stock is currently trading within a converging channel, stabilizing near the breakout level.
• A wick rejection at the breakout price suggests strong demand at this level.
• Stochastic oscillator is turning upwards, indicating the start of a potential bullish cycle.
Final Thoughts
If momentum continues, CRM has the potential for a strong bullish move. Watching for confirmation and volume increase on continuation.
What’s your take on this setup? Let me know in the comments!

BTC is looking like more down, but a great buy opportunity Head and shoulders for BTC was invalidated recently leaving a short term play that looks like some more downside than up, for the very short term in any case. It looks like the green trend line was broken of late. Typically when there's a break, the price action comes back down to buffet on it for a short while before taking off agian. Let's see what happens, it looks like a great buying opportunity though. Cycles in green semi circles also pervail to there being more down than up to go. Follow and share for more.

ALGD, cup and handle could see this coin soarI prefer to keep things simple when conducting analysis. I sift through a number of indicators until I find my favourite few that when used together often 'jive' creating a harmony and increased confidence in an up, or downward trajectory. This time, the most standout items is the Cup and Handle, a labelled in the diagram. Drawing a line that is equal to the height of the cup to the neckline and repositioning it to the neckline and up, we could see significant all time new highs here. The pattern is robust and holds up well. Other coins have seen similar patterns such as BTC, so it would make sense also here. Good luck, follow for more.

Total Crypto Cap: "A Rising Tide Lifts All Boats"Beautiful Cup & Handle pattern (yellow) has been built on the chart.
Price broke above the Handle this month confirming the bullish stance
Total Crypto Capitalization ( CRYPTOCAP:TOTAL ) could reach $4.53 Trillion.

Massive Cup & Handle on Solana about to pop!Solana has been building an absolutely massive cup & handle for the past four years, and with the market perking up since the elections, it may just be the time for it to pop!
Good luck, and always use a stop-loss!

Apar Industries - Cup and HandleApar Industries - Cup and Handle is confirmed on the daily basis. The cup is formed, no overhead. trending --30% up , cup formed 15% down. RS Positive. Above 21 and 50 DMA

BTC/USD – Cup and Handle Formation with Major Breakout PotentialBitcoin is showing a classic Cup and Handle formation on the daily chart, a bullish continuation pattern. After the completion of the cup, Bitcoin has formed a downward sloping handle, which suggests the market is consolidating before a potential breakout.
Using technical analysis, the projected target after the breakout is around $112,000 , based on the height of the cup added to the breakout point.
The breakout from the handle is expected to push BTC beyond the $70,000 range, aiming for the next significant resistance levels. As we wait for confirmation, a close above the handle's trendline would signal the start of a new bullish phase for Bitcoin.
This setup follows the historical price pattern and could be a long-term opportunity for traders and investors watching BTC/USD.

NWSA - Cup & Handle to Long?NWSA long term profit ? Cup & Handle pattern + Above the average line 150. Caution - results report in a few days! Only an idea and not a recommendation for trading!

SIZZLING-YINN-HANDLE!!!! There's been a global paradigm shift As Biden's re-election prospects diminish and recent events are raising concerns. While US and Europe valuations are within fair value range based on forward P/E ratios the tremendous laggard China has turned its corner in cracking the chip after Pres Xi spent about $2T equivalent in US dollar that is a lot but at least he accomplished what he intended when he came in office and announced the "common prosperity initiative" to solve demographic generational chasm from the one child policy before and thee are not enough producers to support the rest and to solve this make home affordable again as children live with their parents until age 55 on average and this is not ideal for starting a family they need their own home. Well fold housing down 95% mission accomplished lol Tech Sector crackdown and sanctions on top of a strong US dollar also beat down China tech index clubbed like a baby seal down 75% . many have contemplated is China investable. We ladies and gentlemen. Bottom Line = YES! .........PLAY BALL!
Notice: Think for yourself before comparing your analysis. Past does not equal future, same goes with price discovery. Leverage ETF products have additional risks and design for short term trading and speculation and someone who has a system with automations and watching the Bloomberg. This is not intended to be a recommendation in absolute. If you do not fully understand please consult an advisor, make sure you have adequate cash reserve and can afford to lose as invest like this leverage 3x so that is a notional value of 300% of a potential 25%83=74% in one handle (move). Remember to cut your losses because it takes a 100% return to break even from a 50% loss. I would expect this trade to take 2 weeks to mature but could take a month and it may be down at first, but the paradigm has changed, and this is the trade for now.

$JASMY tested Bull Flag support, plus Cup & Handle formationHere on SEED_DONKEYDAN_MARKET_CAP:JASMY , a classic Cup & Handle formation, target 0.0345
But at the same time, we have a Bull Flag with already tested support, with target on 0.046!

CUP n HANDLE An illustration of Cup and Handle pattern
First look for an initial uptrend of the stock
Later a small pull back
And later reversal of the pull back ....
Breakout of the highest point of the pull back
At retest , look for reversal candles like doji.... Look for tight price action
Enter the trade just above the high of the candle with stop loss below the lowest low of the candles

RMD Long off Cup and Handle The white dotted line represents the Stocks average up trend, you can see the stock has squeezed down into an equal triangle (nor bullish or bearish) and looks bullish with that cup and handle right into the bottom. Looking for a safe gain to major resistance at $34.18 Daily RSI shows above 50 after a reset.
