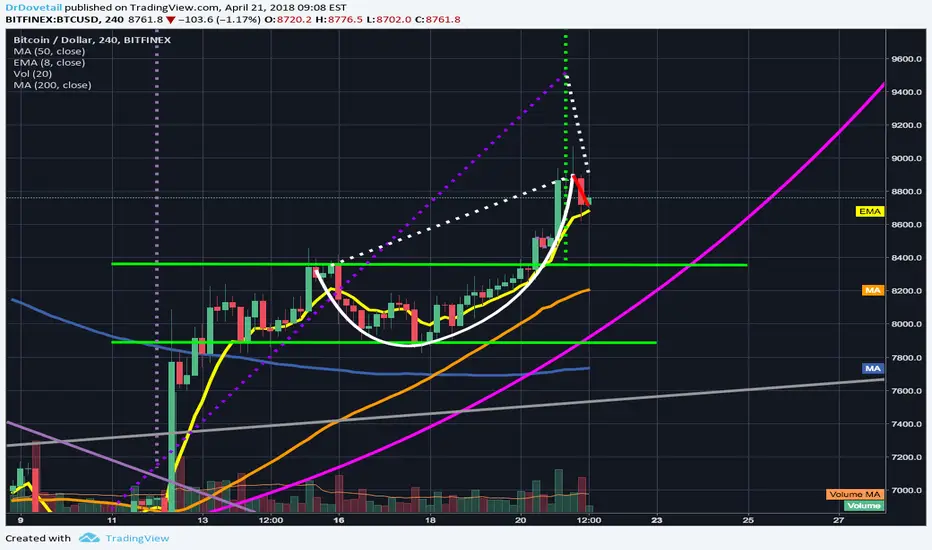
Current bullflag has morphed into ascending triangle bullpennantWe can see on the 4 hr chart the current bull flag has started to morph into an ascending triangle bull pennant. Probability is good it will break upward....that should trigger the cup and handle that is still in play if that cup and handle is valid....However this entire bull runs price action also appears to be trapped inside a rising wedge which are patterns that usually break downward...It is worth keeping an eye on because if somehow broke downward it's projected drop target could actually take it under the eve bottom trendline. I have marked it on this chart wth 2 blue trendlines. It was not the easiest trendlines to keep consistent so I'm hoping the wedge is invalid as I would really like to see this adam and eve bottom be validated and triggered. So hopefully the cup and handle is triggered instead and lifts us out of this potential rising wedge pattern.
Handle

Bitcoin forming inside bars…is this a valid Cup and Handle?Great upswing yesterday just as I was hoping and we are still continuing to play out this potential Eve double bottom quite perfectly. Eve bottoms have a much slower climb than traditional double bottoms and tend to fake out a lot of bears along the way with many a bear trap. We are currently consolidating with some inside bars and we are overdue for a retracement...we may fall back down to around the top trendlien of the bullflag we broke out of on the night of the 19th to form a higher low and then continue ridsing from there....however this current price action on the 4hr chart looks suspiciously like a slanted cup and handle....I'm not entirely sure if cup and handles can be valid at this angle but have charted it just in case.....if it is a cup and handle and we break the neckline after now having formed the handle then the projected upswing target should take us to 9400 which was the original descending wedge breakout target so we will finally reach that projected target which if you look at the price action since that breakout it really has only been higher lows and higher highs...a clear bull run so far. For now though I will keep this idea neutral as we may have a slight retracment which we are overdue for that takes us back down to the top trendline of that april 19th bull flag...if so I will simply buy the dips...you choose your own path though because this is not emant to be financial advice. Thanks for reading and good luck! Also if anyone who is a cup and handle expert sees this and can chime in on whether or not this one can be a valid cup and handle it is appreciated..I know in the standard stock market...patterns like this are suppose to form over a much larger period of time...but in crypto every thing seems accelerated and I've noticed these longer time frame patterns being triggered and validated on much shorter timeframes.
XLM/BTC - C&H?XLM/BTC:
Looks to be forming a cup and handle, just waiting on the handle to form to give us a nice entry position.
XLM should correct/retrace sooner than later from its recent bull run, which will allow a handle to form.
Buy area and Stop Loss have been set, watch buy area closely, XLM tends to retrace larger than usually expected, XLM may dip down to the 0.5 Fib line (blue one).
Indicators:
- RSI overbought on the Daily, be wary of this. Though, as a wise man once said, "an overbought RSI can be a buy signal in a Bullish market"...idk who that wise man was.
- MACD looks decent on the Daily chart, still showing no signs of a downward cross.
-Ichimoku Cloud a thin green cloud rising upwards. Could be thinning more, indicating a new trend (such as a correction). Either way, XLM still well above the Cloud on the Daily charts.
- Volume looks good on the Daily chart, very green, little red, with a decent amount of volume taking place (though we will need a higher volume to send on another leg up without any correction).
Long Term Targets:
Target 1 - 0.00001356
Target 2 - 0.00002605

OMG - Small Dip then MoonOversold on the RSI, Stoch RSI has bearish cross. Forming an inverse head and shoulders pattern. Hold off on buying for a couple weeks and watch for the shoulder to form. I'm hoping for a dip of about 10%. Remember, with another crypto bull market beginning to form, pumps can happen very quick, so watch closely! Or, buy now and stay on the safe side, we will see some serious gains soon. :)
OMG has been on a lot of peoples watch list since its release. 2018 will be a big year for OMG, with the wallet and staking going live during Q2 this year. When it first released, the hype for OMG was huge, but it slowly died down. With the live product coming closer and closer, expect that hype to build back up, as well as staking to remove portion of the token supply being traded.

Massive Cup with Handle to 2.5k Meme-ality.* IMPROBABLE BUT FUNNY*
This is a crazy idea for a massive cup with handle. High volume on the extremities and low volume throughout the 'cup'. A TON of assumptions made to make a handle on the cup and a ridiculous projection on the possible breakdown form that handle point puts us at 2.5k. When plotting this I thought it was too funny to find a possible path to the 2.5k meme often spouted on WP.

Um... is this what I think it is???Potential Cup and Handle pattern on Bitcoin 3.82% , target 10.5k. Enter only on breakout or at the bottom of the range. Keep in mind handles often break down and form a second handle before breaking out. TRADE AT YOUR OWN RISK.

[ETP] Short term short, long term long! Cup and handle formationETP just hit the resistance line of the channel and is about to form the handle part of the cup and handle formation.

Long, Long , Long :)We can see a CUP & Handle Pattern //
This is on small scale // 1 hour chart
/TARGET : 1.618 from previous resistance // support
Will update later on till we see how whole market in general play out //
Good luck .

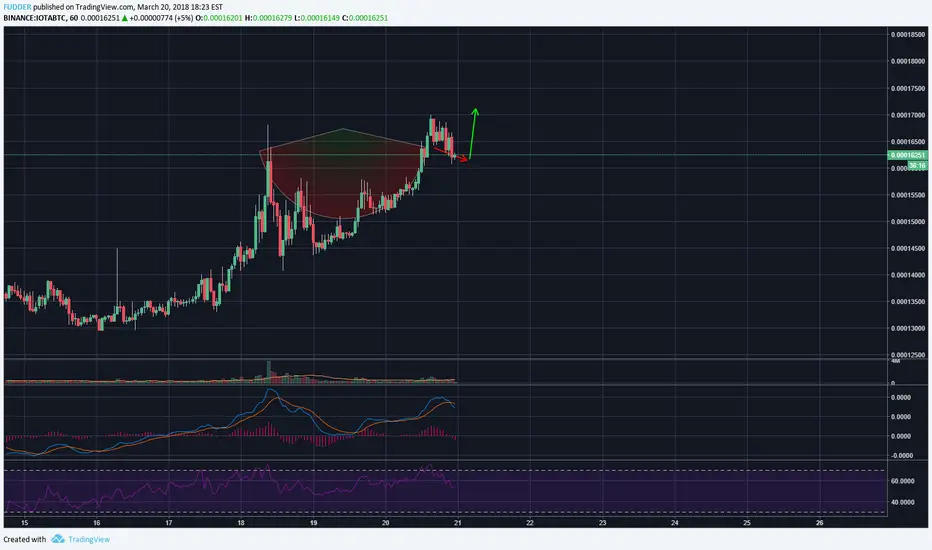
IOTA - MIOTA Cup of TeaA possible Cup and Handle pattern is forming on the 1H timeframe IOTA.
(This is not financial advice, this is a volatile market where anything can happen)
Cup and handle tries to break through channel wall but failsJust a temporary short for the next couple 4 hour candles...only because the last 4 hour candle finished as a bearish engulfing candle...As you can see that channel trendline is a line of extreme resistance...the cp and handle has yet to hit its target price because of it...it will likely retest the channel trendline a couple more tiems and then eventually bounce through but we could dip down into the 10350 region potentially before we see it rally enough momentum to do so...keep a close eye on the epth chart determine the best places to sell and rebuy/ I'm long in the long term but in the very short term..short.

BTC may be trying to form a cup and handle on the 4 hourThanks to the sudden burst from the bulls a cup and handle pattern is currently in play...which is just the type of thing we would need to be able to break above the descending grend channel top trendline which is necessary to break the neckline of the inverted head and shoulder pattern....We shall know if we have a cup and handle pattern on our hands within the next 8 hours.

LINK forming textbook example of cup and handle pattern$LINK is forming a textbook example of a cup and handle pattern. Volume increased near the bottom, handle didn't retrace more than 50%, and we're getting a spike in volume near the breakout point of the handle. I expect some long term gains
Link itself is a awesome project with a great vision.
Strategy:
Buy below 0.0007
Sell at:
0.00098 (We're going to blast trough this one, so only sell at this point if you're a very active trader)
Rebuy at:
0.00075
Sell at
update will follow

OMISEGO/BTC Forecast [Possible Cup&Handle Formations]- 1/27/18Forecast for Omisego
- RSI @ 49 currently, neutral as it is neither overbought or oversold, if RSI continues downward towards 30, OMG becomes more oversold and more bullish.
- MACD's last cross was January 17th, expect it to cross again in the very near future (maybe a week or two). Expect price breakout to be bullish.
- Bolling Bands are clearly narrowing, indicating a temporary trend has formed and may continue sideways. Once Bollinger Bands begin to widen again, we can expect a breakout, most likely a bullish one.
Charted two Cup&Handle formations, would love to hear everyone else's thoughts on them!!
Green Cup (longer, bigger cup trend) shows a possible cup formation in progress. If current trends can pick up and hit the 0.786 Fib Retracement level, we can expect a quick and temporary dip (known as the Handle) before further explosive breakout.
The 2nd Cup formation (the blue Cup), is also another possible Cup&Handle formation, this time, the Cup has already formed and we are just waiting on the Handle to complete its formation. If Handle completes, expect bullish momentum, possibly bringing us up to the 0.786 Fib Retracement level and maybe even finishing the 1st larger, green Cup?!!???
- We can also see that the 2nd,
smaller, blue Cup has a Handle the
seems to be forming a Falling
Wedge, which also indicates
upwards price movements once a
breakout occurs.
Also have a Symmetrical Triangle (black dotted lines, passing through the 2nd, smaller, blue Handle). This can also give us an indication of possible future trends from which ever way the breakout starts.
Support level has been drawn out, might seem sort of high, in any case, it is probably a good idea to have more than one support level drawn out.
Cheers!!


ETH/BTC Cup and handle formationHere we have ETH/BTC on the daily candle chart. What I attempted to indicate here is the formation of the cup and handle formation. I believe the strong psychological resistance at .1 will cause the price to pull back, forming the "handle" and this could indicate a bullish continuation.


EOS Cup&Handle - 1/19/18EOS
RSI @ 75.4, indicating oversold territory.
MACD remain narrow, indicating a breakout.
Bollinger Bands have widened, but look to be narrowing as a breakout becomes more likely during the formation of the handle.
Cup and Handle formation assumes Bullish movements ahead, we will likely see a retrace during the formation of the handle, only to follow a bullish breakout into all time high territories.
Your thoughts??

$VIBE cup and handle forming?Looks like VIBE is forming a VERY clean cup and handle. Should see confirmation by tonight.

BCD/BTC Dream or possible cup forming ..? +350% IF....It's just an idea of possible cup and handle BINANCE:BCDBTC . Price can continue to go down or can stay at this price range.. Again one more time it's just an IDEA not a sure analysis..
But i think we are at the end of BCD correction (but Global crypto correction is not finish) and the big sell wall have been completed so why not.. if we have a good volume in the next day it can be possible but anyway don't sell your Bitcoin diamond and hold it.

[BAT/BTC] Cup & Handle formation! Big returns!!Hello traders!!
Here we have a nice and cup & handle that been forming for the past couple of months!
**This trade is similar to EOS!! Check my recent EOS post :)
As always this is my trade opinion. Do your own research and never risk more then you can afford to loose! Feel free to ask me questions and or comment your thoughts and ideas.
You wait,
you WIN!


[EOS/BTC] Cup and Handle formation!?Hello traders! Here we have , looking at it from a has been forming a 4H chart you can see a large CUP AND HANDLE over the past couple months. As outlined on the chart your buy point should be %5 above ideal point. If trade doesnt go as planned, there's 2 possible targets as shown on graph.
As always this is my trade opinion. Do your own research and never risk more then you can afford to loose! Feel free to ask me questions and or comment your thoughts and ideas.

TRXBTC cup and handle (pure speculation)Lots of people interested in this coin, lots of hype from those that bought and lots of FUD from those that missed out. Loads of people stuck at the top wanting to sell, recent large volume buy in - possible could be cup and handle forming?
