HSI index - Sell 14.01.2020Friends, please before reading, support this idea with your Like and any Comment, thanks.
You can take short sale Hang Seng Index from 28900-29000
Stop-loss 29500
You will find more trading ideas in SAV Finance community.
Good luck!
Hangseng

Hang Seng WeaknessI kinda blew the call Friday afternoon because I wasn't paying attention to China, and they pumped the crap out of futures Sunday. Pumped ES1 so much that when the Euros sold it, MDI went oversold but the index future was still up 9 pts at open.
Lesson learned.
Anyways, I bought MCHI calls today, and when I noticed this was overbought, I flipped them in the afternoon. Glad I did.

HANG SENG (HSI) Within Sell Zone
Completed bearish harmonic bat pattern on Hang Seng.
The market is back again trading within the sell zone.
Targets: 27500 / 26800
Stop - 29500

Market Events and VolatilityAnnual 2019 Trading Results
The Elite Gold strategy +51.5%
Silver +73.0%
Forex & Precious metals +76%

ridethepig | Copper Driving China Capital Flows As you can see the strong relationship Copper has with Chinese equities, you will notice what has been the case for these final stages of the economic cycle, metals have been moving miles ahead of equities.
We got the floor set in Copper as widely expected all year:
Any dips now look competitive:
Copper has been allowed to outperform Gold:
Bulls need to reclaim the highs in Chinese Equities after the -10% leg:
A weaker USD will help reinstate a bullish outlook for Copper, support clearly seen at $2.715, then $2.675 - which I expect to hold.
Thanks for keeping the support coming with likes and as usual jump into the comments with your charts and views to open the conversation up for all!

Tencent Finally breaking out, time to go long? $700I like Tencent here,
MACD and RSI are bullish. broke out of the triangle.
My first target is around $400-405.
More about Tencent
Tencent Holdings Limited is a Chinese multinational conglomerate holding company founded in 1998, whose subsidiaries specialise in various Internet-related services and products, entertainment, artificial intelligence and technology both in China and globally.

My new favorite stockAnything can happen :)
Usually ponzi schemes (this is how I call hype greater fool bubbles) fall in 2 way:
1- Go up slowly fall fast (Enron I guess)
===> Retail and bad funds either want to secure the gains they waited so long for, or the weak uptrend got them in partial disbelief so they believe it can go very low and want to get out asap. They often get tricked into selling right before the uptrend resumes.
2- Go up fast fall slowly, such as in the following 2 examples:
===> The mania very rapid gains got people really excited, so they refuse to sell and so the price declines very slowly. They are persuaded the price will not get much lower and the downtrend is just temporary. This is often the most dangerous noob bait and they end up holding bags for a very long time.
It is not always the case, and also the timeframe is not always the same, like it could have gone up slowly on the weekly and fast on the daily and the dialy bubble pops but weekly is not in a bubble, etc.
It's a general idea thing. It is an intuition thing can't really define it you either get it or you don't.

HANG SENG Buy SignalPattern: Channel Up on 1D.
Signal: Bullish as the pattern is approaching its Higher Low and the 4H RSI is on support levels.
Target: 28400 (below the 1W Resistance).

Hang Seng: Symmetrical patterns show an extended uptrend to at lThe index has broken above the multi month descending channel that started on April's peak with a clear cross over the Lower High trend line (dashed line) on very healthy bullish 1D price action (RSI = 66.138, MACD = 47.598, Highs/Lows = 433.2348).
Since both 1W and 1M turned neutral (RSI = 54.126 and 51.251 respectively) we are looking at previous candle patterns for clues. So far we have spotted striking similarities with the October 2018 - January 2019 price action. Similar lows, High and rejection around 27,300 and then a continuous bullish sequence.
Based on that symmetry we have set the following targets: 29,000, 29,500 and 30,200, which should be used in accordance to each trader's risk approach. A Golden Cross on 1D (as it happened in March) will further validate this outlook.
In September we've made a similar analysis with targets based on Fibonacci retracements and is already near the first target:
** If you like our free content follow our profile (www.tradingview.com) to get more daily ideas. **
Comments and likes are greatly appreciated.

Hong Kong Stock Index (Is it about to Go UP?)View On Hong Kong Stock Index (27 Oct 2019)
HSI was trying to form a HIGHER HIGH, HIGHER LOW formation (HH-HL) and it is about to do a break.
We will need a strong break out with strong vol to validify the move and it is likely yo happen.
If it advances, it shall reach 27,000 and 27,100 regions pretty fast.
DYODD, Our trade analysis may not suitable to intraday (or) short time frame trading.
Whatever method you use if you do not follow the proper rule of risk management, it will have detrimental effects on your account.
Feel Free to "Follow", press "LIKE" "Comment".
Legal Risk Disclosure:
Trading foreign exchange or CFD on margin carries a high level of risk, and may not be suitable for all investors.
The high degree of leverage can work against you as well as for you. Before deciding to trade foreign exchange you should carefully consider your investment objectives, level of experience and risk appetite.
The possibility exists that you could sustain a loss of some or all of your initial investment and therefore you should not invest money that you cannot afford to lose.
You should be aware of all the risks associated with foreign exchange trading, and seek advice from an independent financial advisor.
DISCLAIMER:
Any opinions, news, research, analyses, prices or other information discussed in this presentation or linked to from this presentation are provided as general market commentary and do not constitute investment advice.
Sonicr Mastery Team does not accept liability for any loss or damage, including without limitation to, any loss of profit, which may arise directly or indirectly from use of or reliance on such information.

HSBC looking bearishEurope's largest lender HSBC says pre-tax profits dropped 18% year over year and abandoned a profitability target as Hong Kong's protests and the U.S.-China trade war took their toll
Technicals are not looking good too.
55.76 - 55.15 range is the next price target.

Tencent Holdings Ltd shares are dangerously close to key supportTencent Holdings Ltd shares are dangerously close to losing key support level.
We could see aa small bounce at 320 this week and then go lower from there if there is no positive news.

$HSI -- Expanding upon previous trade ideaPretty clear secondary H&S forming on the $HSI daily chart, short the right shoulder with a stop....

HSI, are we going to 31600 ?Here is all patterns i can see with current HSI structure.
At 31600, there is a bearish gartley (78%).
At this exact same level, there is a 5-0 pattern (161% extension) which would lead to a ~50% drop in a form of AB=CD .
I tend to think, when fibs are nicely aligned (confluence) the probability is high to touch the level.
HSI could rally up to 31600, falls down 27400 and bounces back to 31600 again and higher...

Hang Seng: Symmetrical Golden/ Death Cross. Long term Buy SignalHang Seng has been devastated by the recent negative geopolitical climate, reaching in August the 24,900 1W Support. The rebound that followed on 1D was rejected near the Lower High trend line (dashed) and 1D MA200 (orange line) thus keeping 1W bearish (RSI = 43.695, MACD = -309.550, Highs/Lows = -317.3100).
We have had a Death Cross formation on that bottom and interestingly enough it is symmetrical with the Golden Cross in March. Since we already tested the 1W Support there are more probabilities now to resume the uptrend and reach at least the 0.618 Fibonacci retracement level (currently at 28,200) like Hang Seng did on its 2019 top. Anything above that will be bullish towards at least 30,200 (2019 High).
If however by any chance the index dip again to the 1W Support (the 2018 bottom was at 24,500) then that would be an even stronger long term buy signal towards the 33,500 ATH.
** If you like our free content follow our profile (www.tradingview.com) to get more daily ideas. **
Comments and likes are greatly appreciated.

$HSI - Hang Seng Testing Key Support$HSI is approaching our Monthly Support Level (blue) of 25,166.
It has staged steady rallies since, but given the external global macro headwinds, and internal political strife, we see $HSI breaching this support and heading lower.
Watch this space...


Hang Seng to continue Lower?Not the textbook example of a head and shoulders pattern on the Hang Seng, but nonetheless showing us a transition from higher lows (uptrend) to now lower highs (downtrend).
I wouldn't really want to trade equities given world equity markets are remaining poised for the Federal Reserve rate decision...but I do like the break, and if we can confirm the retest here with a close below 27980 it would have my attention.
The 27400 zone is a potential first profit target.
China has come out saying they will not accept the protests in Hong Kong. They want things to cool down. If you follow my work, I have said China wants more control over Hong Kong (mostly getting rid of British Law) because it is a way for people to get money out of the country (also through Bitcoin as well), but also a way for Mainland China to get away from US Tariffs. Hong Kong is not targeted by Tariffs so Mainland can export from Hong Kong.


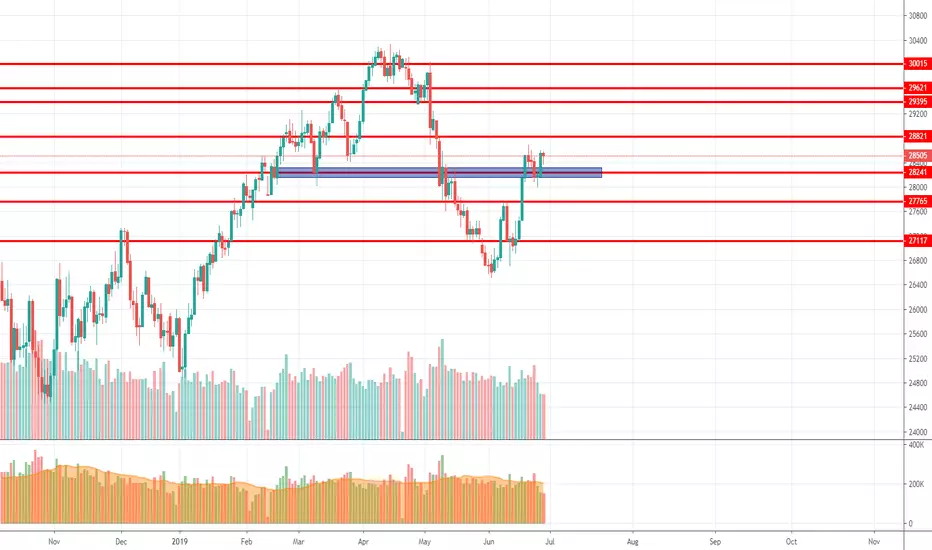
HSI Upside Target (July 2019)HSI is currently in an uptrend, the critical 29000 level would be reached soon and then push up further.
Upside Target: 29250, 29400
Support: 28700, 28850
To fill the gap above 29400, it would require really good news about trade deal between US and China.

Morning star on HANG SENG. 29 june Trading Idea. With Xi and Trump meeting this weekend, I'm expecting good news from them as the market close with a very bullish pattern. Going long here should be very rewarding as there is potential for upside than downside. 27910 will be our SL.
HSI Approaching Support, Prepare For A BounceHSI is bouncing off its 1st support(100% Fibonacci extension , 61.8% Fibonacci retracement , horizontal pullback support) where it could potentially bounce to its resistance at (61.8% Fibonacci retracement , horizontal swing high resistance).
ichimoku cloud is also showing support where a corresponding bounce could occur.

LONG HSI is approaching its support at 27240.6
HSI is approaching its support at 27240.6 (100% Fibonacci extension , 61.8% Fibonacci retracement , horizontal pullback support) where it could potentially bounce to its resistance at 30197.0(61.8% Fibonacci retracement , horizontal swing high resistance).
Stochastic (89, 5, 3) is approaching its support where a corresponding bounce could occur.
