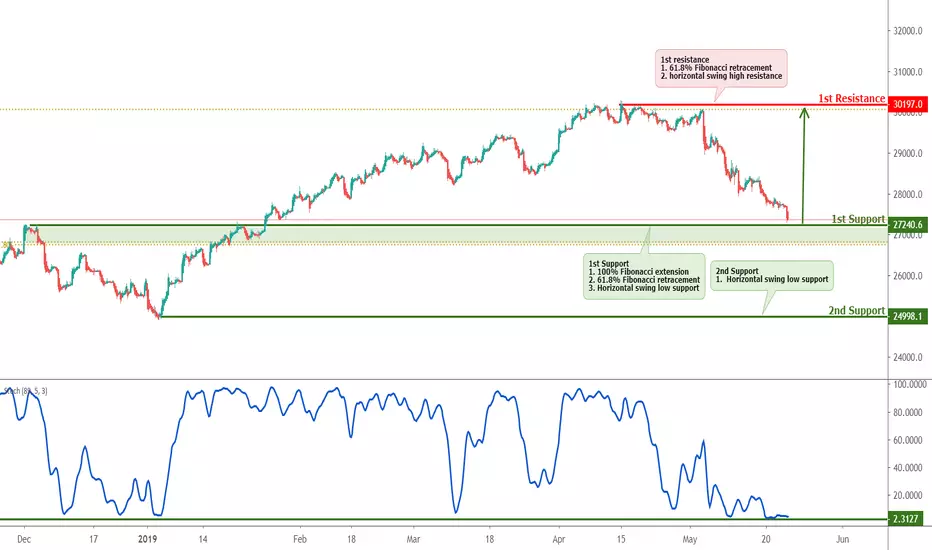
HSI Approaching Support, Prepare For A Bounce
HSI is approaching its support at 27240.6 (100% Fibonacci extension , 61.8% Fibonacci retracement , horizontal pullback support) where it could potentially bounce to its resistance at 30197.0(61.8% Fibonacci retracement , horizontal swing high resistance).
Stochastic (89, 5, 3) is approaching its support where a corresponding bounce could occur.
Hangseng
HSI Approaching Support, Prepare For A Bounce
Buy above. Stop loss at. Take profit at.
Reason for the trading strategy (technically):
HSI is approaching its support at 27240.6 (100% Fibonacci extension, 61.8% Fibonacci retracement, horizontal pullback support) where it could potentially bounce to its resistance at 30197.0(61.8% Fibonacci retracement, horizontal swing high resistance).
Stochastic (89, 5, 3) is approaching its support where a corresponding bounce could occur.

Hang Seng bearishEnded last week with a daily that bearishly engulfed the prior 3 days and it's rally back towards its all time high stopped right around the .618. I'd have to call that a dead cat. Also a hanging man at the top where the rally ended along with an island. Currently losing this fib level as we speak. looks bad.

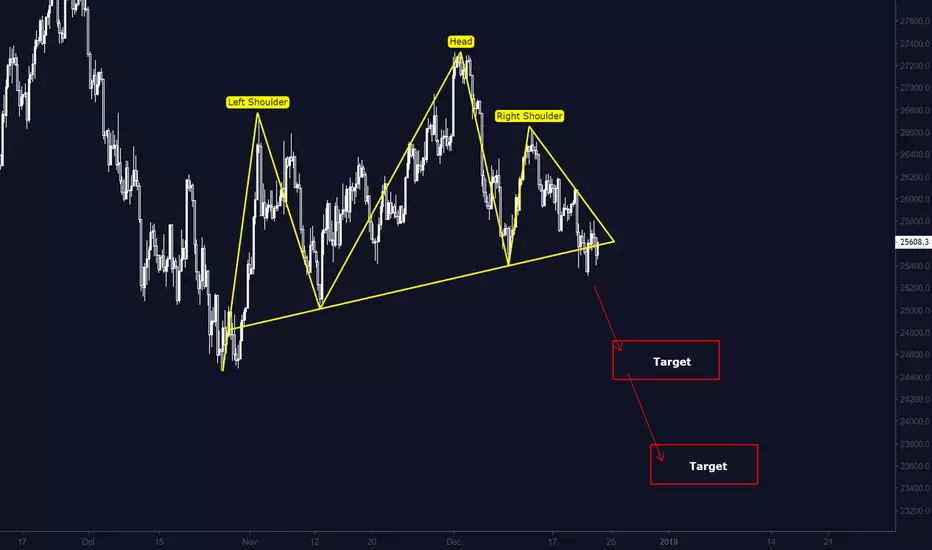
Hang Seng HSI perfect bearish Butterfly161% reached perfectly and failed ...
Target is 50% retracement and then 100%

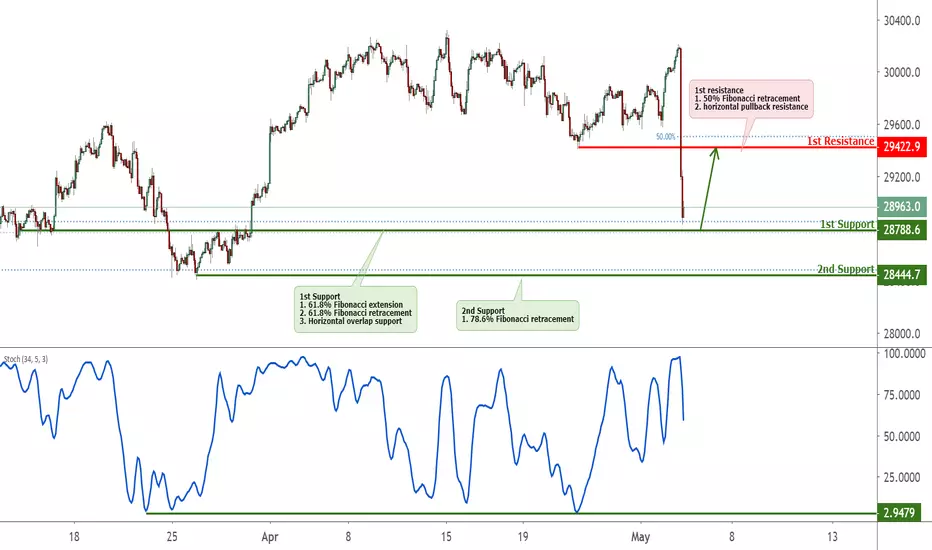
Hang Seng index Approaching Support, Prepare For A Bounce
HSI is approaching its support at 28788.6 (61.8% Fibonacci extension , 61.8% Fibonacci retracement , horizontal overlap support) where it could potentially bounce to its resistance at 29422.9 (50% Fibonacci retracement , horizontal pullback resistance).
Stochastic (89, 5, 3) is approaching its support where a corresponding bounce could occur.

HSI (Hang Seng) - Market Crash Cycles | Indices | Macro Trends*Please support this idea with a LIKE if it helps you. Thanks!
More details about me in my signature.
HSI has been labeled within a Sub-Millennium degree wave 4 (blue), which has been unfolding ever since the 2007-2008 Recession.
Structure - Expanding Flat Formation
Oct 2007 peaks and down until Oct 2008 bottoms - Grand Super-Cycle wave a (red)
Oct 2008 bottoms and up until Nov 2010 tops - Super-Cycle wave (a) (purple)
Nov 2010 tops and down until Feb 2016 lows - Super-Cycle wave (b) (purple)
Feb 2016 lows and up until present times - Super-Cycle wave (c) (black)
Super-Cycle wave (c) (black)
Pattern - Ending Diagonal
Sequence - 5-Wave Sequence, with Cycle Waves I II III IV V (black) decomposed as Primary A-B-C (blue)
Current PositionCycle Wave III (black)
Next expected swing
Bearish sequence in Primary B (blue)
Market Crash Forecast
Support granted at or around the 28000.00 mark and then a bull run towards the 33000.00 levels, where the Grand Super-Cycle Wave b (red) is expected to complete.
Grand Super-Cycle Wave c (red) would reflect the next Larger Degree Recession.
Structure change
Breach of the lower trend-line of the Ending Diagonal could reflect the fact that the Market Crash already started.

Hang Seng index Approaching Resistance, Prepare For A ReversalHang Seng index is approaching its resistance at 29416.2 (61.8% Fibonacci extension, 38.2% Fibonacci retracement, horizontal swing high resistance) where it is expected to reverse down to its support at 28788.6 (61.8% Fibonacci extension, 61.8% Fibonacci retracement, horizontal overlap support).
Ichimoku cloud also shows a corresponding reversal is expected.

Hang Seng index Approaching Support, Prepare For A Bounce is app
HIS is approaching its support at 28788.6 (61.8% Fibonacci extension, 61.8% Fibonacci retracement, horizontal overlap support) where it could potentially bounce to its resistance at 29422.9 (50% Fibonacci retracement, horizontal pullback resistance).
Stochastic (89, 5, 3) is approaching its support where a corresponding bounce could occur.
HANG SENG: Weekly OUTLOOK!#OpportunityHey tradomaniacs,
welcome to my analysis for HANG SENG HSI.
Everything I want to say is shown in the chart.
Since this market is political-driven we should still wait for the outcome of the tradewar, especially for China and USA.
Every good news seems to be enough for the market to buy.. but still with a very low volume!
-----------------------------
LEAVE A LIKE AND A COMMENT - I appreciate every support! =)
Peace and good trades
Irasor
Wanna see more? Don`t forget to follow me.
Any questions? PM me. :-)

Hangseng Approaching 30,000 Overall market structure is still very bullish looking.
but it is near the toppish level,... shall wait for a VALID BEAR to go for a short

Hang Seng Set for Renewed UptrendUS China trade war resolution more forcefully impacts Shanghai Composite and Shenzhen Component, but Hang Seng should also see some gains. Moreover, we have seen a bit more progress in the negotiations apparently with tech transfers, tech war. Let's see if it pans out though. For more, check out www.anthonylaurence.wordpress.com

Proceed with CautionHSI closed in a strong support region.
Fourth wave expanded flat is the preferred count as the selloff seems to hv good momentum but caution is required. Under this count, HSI will make a new low below 28000 and then rally towards 30000. ALT. Triangle.
28600-29000 area has seen very heavy volume traded recently. Expect the prices to hover in and around this area for some time.
Selling rallies with SL 29280 is the plan for now. Will update if things change.

Hangseng correction. Expanded flat or a Triangle?Hangseng appears to be in wave iv correction with A and B waves both unfolding in 3 waves. Wave C is currently under way.
In case of an expanded flat, it will break below 28000. Target area is 27800-600.
In case of a Triangle, wave C should end around 28550-600 area.
Once completed, wave v should advance to 30000-30300 area.

Potentional Shark Pattern on HSI - Long 1 to 4 RRRLunch break ends in 1 minutes and market re-open, market should rally

Hang Seng (HSI) Buy Trade 2H TimeframePrice is in an uptrend on the daily and lower timeframes, and has just broken the 29 153.0 ceiling, which represents the previous high. It currently is 23 points (pips) below the 289 432.2 level, which has been tested twice previously ass support, though it was later broken through.
As a trend trader, I would wait for a retest of price towards previous high (29 143 area). That area is almost in confluence with the upward trendline, which can also be used as a buying level, once price gets close to it.

Hong Kong Stock Index (HSI) *Our TP2 level is hit.View On Hong Kong Stock Index (HSI) (29 Jan 2019)
HSI has hit the TP2 level. Take it slow and do not rush into chasing the market.
But sooner or lower it should be on the way to 28,000 level again.
-------------
Our Analysis
-------------
LONG (entry is valid as long as the price is above 24,200)
SL 24,080
TP1 26,790 (Already Hit)
TP2 27,660 (Already Hit)
TP3 28,295
TP4 30,970
DYODD, all the best and read the disclaimer too.
Feel Free to "Follow", press "LIKE" "Comment".
Thank You!
Legal Risk Disclosure:
Trading foreign exchange or CFD on margin carries a high level of risk, and may not be suitable for all investors.
The high degree of leverage can work against you as well as for you.
Before deciding to trade foreign exchange you should carefully consider your investment objectives, level of experience and risk appetite.
The possibility exists that you could sustain a loss of some or all of your initial investment and therefore you should not invest money that you cannot afford to lose. You should be aware of all the risks associated with foreign exchange trading, and seek advice from an independent financial advisor.
DISCLAIMER:
Any opinions, news, research, analyses, prices or other information discussed in this presentation or linked to from this presentation are provided as general market commentary and do not constitute investment advice.
Sonicr Mastery Team does not accept liability for any loss or damage, including without limitation to, any loss of profit, which may arise directly or indirectly from use of or reliance on such information.

HSI continued 0.618 rejection + pinbar1. Still bearish momentum as shown in RSI
2. Pin Bar formed
3. Rejection from 0.618 levels
4. Price action bearish as price could not be maintained above structure.

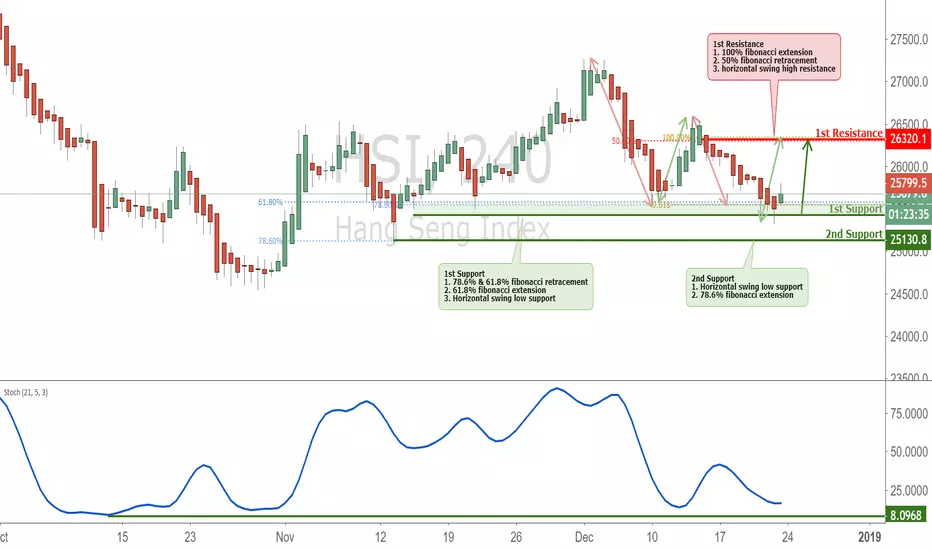
HSI approaching support, potential bounce!Hang Seng Index is approaching our first support at 25432 (horizontal swing low support, 61.8% Fibonacci extension , 78.6%, 61.8% fibonacci retracement, horizontal swing low support) where a strong bounce might occur above this level pushing price up to our major resistance at 26327 (100% fibonacci extension , 50% fibonacci retracement, horizontal swing high resistance). Stochastic (21,5,3) is approaching support and we might see a corresponding bounce in price above this level.
Trading CFDs on margin carries high risk.
Losses can exceed the initial investment so please ensure you fully understand the risks.
Hang Seng Index approaching resistance, potential drop!Hang Seng Index is approaching our first resistance at 28029.9 (horizontal swing high resistance, 61.8% Fibonacci extension , 50% Fibonacci retracement where a strong drop might occur below this level pushing price down to our major support at 24437.6 (horizontal swing low support, 100% Fibonacci extension ). Stochastic (21,5,3) is also approaching resistance and we might see a corresponding drop in price below this level.
Trading CFDs on margin carries high risk.
Losses can exceed the initial investment so please ensure you fully understand the risks.

Hang Seng Index - Daily Key Elements Key levels to look out for when analysing Hang Seng Index, please refer to our 4 hour chart for a strategic view!

Hang Seng Index: Positive to 28017 on a break above 26770Hang Seng Futures HSI1!
Next Long Set-Up
This index made a neat exit of the upper parallel - followed by a pip perfect retest of the same line before reversing higher again to test the first line of resistance at 26764, failing just below here after an intraday high at 26694 on futures.
The 26770 level is looking increasingly significant. A break above here should be worth following for close to 5% upside to 28017.
This index really needs a stop of about 100 points - 3 times more than the Dow although they are both the same price pretty much.
It's just the way it is.
So a break above 26770 will need a stop 100 points lower at least, and really it should be under the 26588 level, which is over 180 points of risk against 1200 points of reward.
The range between 26764 and 26588 is creating whipsaw - it's effectively a small band of uncertainty which may crreate a little more whipsaw around the open. But once it's shown it can overcome 26770 it should be worth following long - but be careful with the stop if trading this one.

Dow, FKLI & Hang Seng - Again The Retracement LevelAgain the 3 markets have rebound from recent new low. According to elliott wave and fibonacci structure, the market correction size fall between 38.2% to 61.8%. Shall the current market market to prove as trend reversal? Trader please monitor the following price level.
Dow Jones:
Retracement level at 25203, 25537 and 25871. Higher than 25871 indicate price reversal from bear market.
FKLI:
Retracement level at 1697.5, 1707.5 and 1717. Higher than 1717 indicate price reversal from bear market.
Hang Seng:
Retracement level at 25132, 25340 and 25548. Higher than 25548 indicate price reversal from bear market.
If current rally the price do not go higher than the above levels, market remain in bearish structure.
