Coming Down NicelyAfter the Buying Climax on 7th of July, brief distribution was carried out between 25950-26250.
Today saw a gap down and a selloff to first of the 4 unfilled gaps below which is acting as a support for time being.
Key resistance above now is 25850-950.
Move down so far appears to be in a channel formation.
Major chunk of distribution took place between 24500-300 since the low in March. Gap through that will signal the start of a markdown and accelerated move towards 20k and below.
Regards
Hangsengindex

Buying Climax and a Top?
Zigzagged with huge volume(see above) at the open, took out the stops above the very important level marked in Yesterday's post and has since been on the decline. We will know for sure in next few sessions but there is a good chance that Today marks the start of a significant decline which will take HSI to 20k and below if my analysis of distribution near the 24k level are correct.
First significant support is the gap at 25250-500. It can get real ugly in no time so trade carefully.

Update: SELL SELL SELL!!!
More on the post earlier Today.
HSI now has rallied beyond the point which i have marked for few weeks as the potential turning point. We may see brief distribution between 25950-26250 for couple of sessions and then move lower. I am to remain short until it breaks above 26800.
I am of a view that the rally so far this month after the passing of controversial security law is to trap the investors who were on the sidelines waiting to see how the market perceives the new law.
There is 10 weeks of distribution near 24k. If it reverses, 20k may come in no time.

Low Volume Consolidation and a break up.As updated on 16th, selloff last week from 25255 seemed uncharacteristic of a markdown. Gaps were quickly being filled and volume in the morning hour on 3 days following the top showed minimum enthusiasm from either side.
Too early to call but low volume consolidation may mean a developing triangle.
I am seeing something along the lines drawn at the chart. Keep an eye on S&P. It may coincide with S&P filling the gap from Feb or making new ATH.
If wrong, selloff should start in next couple of days. If so, refer to post "HSI Update" on Jun 13th for the anticipated path.
Regards

Bears. Wait some more.Very uncharacteristic of a mark down so far. Take profit, close half the position or move your SL to 24850 and let the market play itself out. If there is one more up move to go, it should be quick, ending with a buying climax.


HSI - A upward breakoutHang seng index has a bullish trend and real breakout of the range 22750-24850. HSI may test the supporting level 24800 at this moment and continue a upward trend.

Important TOP just ahead.
Didn't get the pullback before run for new highs as anticipated in the last analysis but on the flip side it means very little left to distribute. A pullback would have meant more to distribute above but now it looks like a quick up and back down.
We have 7 weeks of distribution mainly between 23750 - 24250(See previous posts)
Without volume, the last few days may seem like a start of a strong uptrend but zoom in and it appears very much like a SL hunt. Trends can't start without first accumulation/distribution and i see very little accumulation below for it to keep going for long.
Initial plan was to go short at 25300-500 but not sure if we will get there so i will look for reversal signs as soon as it gets above 24800. Target 20500 - 20000.
Some news will follow real soon as always but markets only move when those who control them are ready to move.

Hang Seng outlookPrice continues higher, soon should be approaching resistance zone and 50% fib level as economies around the world are opening and demand returns.
Once that level breaks, we can buy and target the 61.8% level below 26000.
Intraday early entries possible on smaller time frames.
Please support the idea and share your thoughts on HSI!
Good Luck and Stay Healthy!

Hong Kong Stock Index (The Late Sellers are trapped now)View On Hong Kong Stock Index (16 MAY 2020)
It has hit our expected TP level yesterday.
If a trader rushed into HSI shorted over the bad situation gets trapped now.
This is how the market works.
I will be waiting for another entry, possibly short at a higher level.
Possibly near 24,250 regions.
Legal Risk Disclosure:
Trading foreign exchange or CFD on margin carries a high level of risk, and may not be suitable for all investors.
The high degree of leverage can work against you as well as for you. Before deciding to trade foreign exchange you should carefully consider your investment objectives, level of experience and risk appetite.
The possibility exists that you could sustain a loss of some or all of your initial investment and therefore you should not invest money that you cannot afford to lose.
You should be aware of all the risks associated with foreign exchange trading, and seek advice from an independent financial advisor.
DISCLAIMER:
Any opinions, news, research, analyses, prices or other information discussed in this presentation or linked to from this presentation are provided as general market commentary and do not constitute investment advice.
Sonicr Mastery Team does not accept liability for any loss or damage, including without limitation to, any loss of profit, which may arise directly or indirectly from use of or reliance on such information.

Interesting Monday ahead
All set for a very interesting Monday's opening.
Channel support held on for whole week while the sellers kept up the pressure and are now just above the accumulation zone. Gap up will trap the sellers and may not fill in near term with price quickly marching towards 25k. Gap down will open the door towards first the gap at 21882 and then towards march low at 20968.
If Monday opens near the current prices then watch out for trap(First move usually being a trap)
Volume was high whenever price came back in the accumulation zone which is often the case prior to a significant move.
Short term = Neutral,
Medium Term = Bullish,
Long Term = Bearish.

Hang Seng : One Country - One System (log chart long term)Given recent newsflow I wanted to look into Hang Seng HK equities index - feels like that the zone just below 22,000 is critical long term - a break below would be extremely bearish. Together with the general reliance on what is a rigged real estate market I think it is one of the most fragile indices out there.

HSI to extend downside for Fibonacci targetSimple chart, simple Fibonacci, simple target to the downside for the Fibonacci target.
MACD is support of the downdraft.
Apparently Trump is going to have a release on US actions, and surely will be returned with China’s response.
Trigger for downside there...

Markdown or shakeout?
Markets are controlled by very few. They manipulate as they please. They own everything. banks, hedge funds, media, governments. They are the culprits behind social unrest, Wars, Pandemics. No new law is passed without their approval. They have mastered the art of deceiving the masses and they are looking to further enslave the common. Big changes are on the way for which they will create global chaos the likes never seen before by mankind. Many things will be blamed as reasons. Do what they may but a Supreme power watches. Tyrants days are numbered.

HSI - Poised for up to 86% growth in 2 to 4 yearsHSI completed a triangle that ended cycle wave 4. And after tracing primary wave 1 and 2 it is now tracing primary wave 3 up, the best wave to ride. Id this scenario holds prices should reach the most probable target of 45,800, 86% of current level, in 2 to 4 years. This scenario should be revised if prices crosses down 22,900. FOLLOW SKYLINEPRO TO GET UPDATES.

HANG SENG INDEX (HSI) MonthlyDates in the future with the greatest probability for a price high or price low.
The Djinn Predictive Indicators are simple mathematical equations. Once an equation is given to Siri the algorithm provides the future price swing date. Djinn Indicators work on all charts, for any asset category and in all time frames. Occasionally a Djinn Predictive Indicator will miss its prediction date by one candlestick. If multiple Djinn prediction dates are missed and are plowed through by same color Henikin Ashi candles the asset is being "reset". The "reset" is complete when Henikin Ashi candles are back in sync with Djinn price high or low prediction dates.
One way the Djinn Indicator is used to enter and exit trades:
For best results trade in the direction of the trend.
The Linear Regression channel is used to determine trend direction. The Linear Regression is set at 2 -2 30.
When a green Henikin Ashi candle intersects with the linear regression upper deviation line (green line) and both indicators intersect with a Djinn prediction date a sell is triggered.
When a red Henikin Ashi candle intersects with the linear regression lower deviation line (red line) and both indicators intersect with a Djinn prediction date a buy is triggered.
This trading strategy works on daily, weekly and Monthly Djinn Predictive charts.
This is not trading advice. Trade at your own risk.


Hang Seng Index may be bearish in coming 6 monthsWhen checking the Hang Seng Index HSI monthly chart, you can see the HSI has finished the wave 1 to 5 and starts to go from wave A - C. HSI is now testing the strong resistance at aound 29,000 to 29,100. If this resistance cannot be breakthrough, it is likely that HSI will start to go in wave C. According to the Fib, the first target will be 22843 which is 0.5 level of Fib extension. If the bearish force won't stop at this point, it may test the 0.68 level, that means 20331.

Hang Seng Index Near to Its Weekly 200 EMAHang Seng (HongKong) Index Daily Chart trading Below All its 50 100 200 EMA.
Expecting Support from Weekly 200 EMA Levels 26600.
If Broken Further Downfall can be expected As per the levels on the chart.
Do Your Own Analysis Before Investments.

Hang Seng Index (HSI): Bearish Continuation Coming
hey guys,
be prepared to short Hang Seng on bearish breakout of a flag formation.
the trend is bearish,
we saw a fake breakout to the upside recently,
fundamental sentiment is vague!
don't miss this opportunity.
initial target is 25100
then apply trailing stop and try to catch a big winner!
good luck!
please, support the idea with like and comment!
thank you!

Hang Seng Index Future Bull Signal
HKEX:HSI1! reverse this monday, whenever it filled the bull gap, should head further up.
investor should go in either A50 future, A50 etf HKEX:2823, HK index ETF HKEX:2800 , 2x ETF HKEX:7200...etc
I think we should see 30000 within 6 months, and 33000 within year 2020. This place is great for initial invest with stop loss of monday LOW:25880 (which is few hundred points only!)
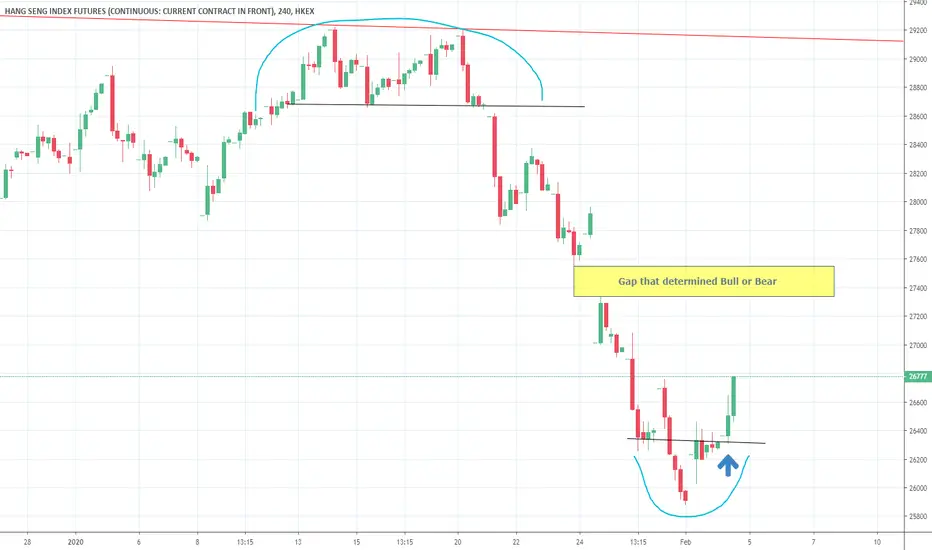
The Most Scary & Important Chart You NEED to See Right Now $HSIThe mainstream media is blaming the mysterious virus in China for the pullback in the Hang Seng index, we as a technical analyst view it differently.
Bullish view - It should bounce at the moving averages (red box) and confirms the double bottom and break out.

HSI index - Sell 14.01.2020Friends, please before reading, support this idea with your Like and any Comment, thanks.
You can take short sale Hang Seng Index from 28900-29000
Stop-loss 29500
You will find more trading ideas in SAV Finance community.
Good luck!
