HSI1! 03 May 2021 Week (Intraday)
HSI1!
HSI1! 03 May 2021 Week
Weekly = Bullish, Daily = Pending, H4 and below = Bearish
Market was within the 29252 - 28440 range
Market currently is oversold as it went below the channel at the moment.
Market may attempt to return to the channel
Scenario:
Acceptance into channel price may try 29200
Rejection: the green zones may be the price target.
Have a good trading week ahead.
Hangsengindex

HSI1! 2021 Apr 26 Week (Intraday)
HSI1! 2021 Apr 26 Week (Intraday)
It looks like price will try to reach for 29318 and
possibly attempt the resistance level.
Immediate support = 28426 - 28484
Immediate resistance = 29243
Entry preference remains at SR zones.
Remember to like and follow if you find this useful.
Have a good trading week ahead.

HSI1! 2021 Apr 19 Week (Intraday)
HSI1! 2021 Apr 19 Week (Intraday)
Noticed that price weren't able to make its way past the midpoint of the channel.
Is the market weakening?
The support and resistance zone remains. No change to trade levels.
1) Use the range of previous ultra high volume bar as a guide for a immediate support/resistance.
Clue:
Ultra high volume, wide spread down bar is a sign of strength, WAIT for long opportunity in lower TF.
Ultra high volume, wide spread up bar is a sign of weakness, WAIT for long opportunity in LTF.

HSI1! 2021 Apr 12 Week (Intraday)
HSI1! 2021 Apr 12 Week (Intraday)
Bar 2 came down to test supply of Bar 1, and closed off its low.
Price may come back down to test for supply again before moving up.
Will wait for a reversal pattern, preferably at the supply line of the
channel, to long.
Or green/red zones cab be entry zones as well.

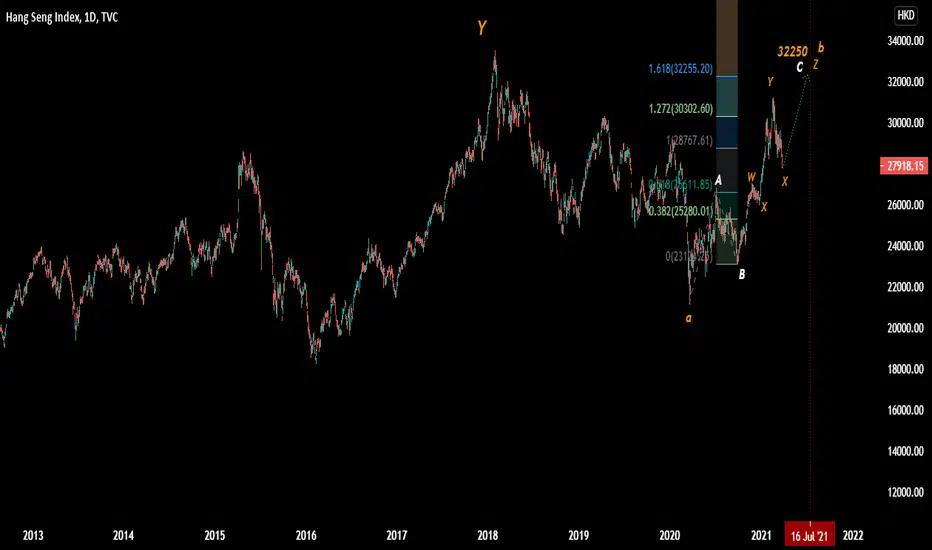
HANG SENG READY FLYWhen the Whole world needs to take some breather , Hong kong is an exeption.
Elliot wave count is somewhat tricky but I tried my best.
Wave Y (double zigzag) completed on Feb2018 . This index took 2 years time to form its first leg of correction(wave a of 'X' wave) The proceeding Wave b,will have a time target of July 2021
At present this index will reach 32255 (C=1.618 times of waveA)marked in white colour.
SELVAM.B
NEOwave practitioner
HSI1! 2021 Apr 05 Week (intraday)
HKEX:HSI1!
HSI1! 2021 Apr 05 Week (intraday)
Daily = bearish | H4 = bullish / H1 = bullish
Last week's short on test of high was only good for 29 Mar as
resistance turned support, after which we had to recognize and
adopt a long strategy.
Demand has weakened, foreseeing the holiday.
Strategy remains that green/red zones remain the preferred entry levels
Like and follow if you find this useful.
Have a profitable trading week.

HSI1! 2021 Mar 29 Week
HSI1! 2021 Mar 29 Week
Daily / H4 = bearish
H1 = bullish
Price came down to support last week
Cognizant of the downtrend, prefer to short on test of high.
Like and follow if you find this useful.
Have a profitable trading week.

HSI1! 2021 Mar 22 Week
HKEX:HSI1!
HSI1! 2021 Mar 22 Week
Red/Green zone = preferred entry
H4 = price rotation
Daily / Weekly = bearish
Levels unchanged. Ultra high buy volume came 1, but are these to distribute?
Bar 2 sell doesn't yield result compared to previous down bars.
So either we continue to see price rotation or there may be long opportunity.
Remember to Like and Follow if you find this useful.
Have a profitable trading week ahead.

HSI1! 2021 Mar 15 Week
HSI1! 2021 Mar 15 Week
Red/Green zone = preferred entry
W = Bullish / D = bearish
Last week' range bound within Bar1 1's low and Bar2's high provided some nice rotation play.
Bar 3's upthrust was perfect for short.
Not much has changed in the levels. Likely still rotation play or just maybe, we will see a
breakout to the down side?
Remember to Like and Follow if you find this useful.
Have a profitable trading week ahead.

HSI1! 2021 Mar 08 Week
HSI1! 2021 Mar 08 Week
Red/Green zone = preferred entry
Grey zone = price rotation, entry opportunities on breakout of zone
M / W/ D = bearish
Demand was present at bar 1, however no evidence of change in trend since
market is still making lower highs.
Will prefer to keep on the short side.
Remember to Like and Follow if you find this useful.
Have a profitable trading week ahead.

HSI1! 2021 Mar 01 Week
HSI1! 2021 Mar 01 Week
Red/Green zone = preferred entry
What a mighty down move from 22 Feb's alert on selling.
On daily chart we see some buying, however note the low volume on buy, so let's watch
on 01 Mar to see if more buy volume will come in to support.
Otherwise we can see 28078-28168 as test of previous support
Previous peak demand zone was at 26414.
Have a profitable trading week ahead. HKEX:HSI1!

HSI1! 2021 Feb 22 Week
HSI1! 2021 Feb 22 Week
Red/Green zone = preferred entry
Selling has come in at A.
Would prefer to short if the highs are tested on lower volume,
Target can 30% / 50% / bottom of channel.
Have a good trading week ahead!

HSI1! 2021 FEB 15 Week
HKEX:HSI1!
HSI1! 2021 FEB 15 Week
Weekly, Daily, Current TF = Shortening of thrust
Last bar price advanced on weaker volume.
If story were to repeat itself, per price action at resistance
1) short if next bar close below high of bar A
2) breaks current resistance, rejected and comes back into resistance,
preferably below high of bar A
3) Immediate resistance comes into play and market comes down.
If long, possible scenarios
1) long on dip, volume declines as price comes down,
volume on advancing bars should be strong
2) immediate push up on reasonably strong volume with high of bar A
acting as the immediate support.
3) if push up is on ultra high volume, wait for test and enter.
Remember to Like and Follow if you find this useful.
Have a safe and profitable trading week.
GONG HEI FATT CHOI!

Hand Seng Index Projection for 2021Just want to log a model projection for the Hang Seng Index (HSI)...
To the green ellipse and then to the red.
HSI is very bullish, and would continue to be so, apparently in a multi-year fashion.
Deep retracements provide opportunities, but we need to draw the lines and know when to take action.
Meanwhile, just enjoy the ride... Asia it is, and Honk Kong may just be it!

HSI1! 2021 Feb 08 Week
HKEX:HSI1!
HSI1! 2021 FEB 08 WEEK
29273 if supported will indicate higher prices.
Friday showed that there's supply present still as
indicated by bar A closing off its high and subsequent
bars closing very near to each other.
Let's see if price can break out or more time is needed
for the buildup
Remember to Like and Follow if you find this useful.
Have a safe and profitable trading week.

Hang Seng - Possible short term correction? After rejecting the weekly resistance at 30,000 big number, the weekly timeframe printed a bearish engulfing candlestick that suggest a possible reversal is coming. Daily looks like just a pullback but with an aggressive decline. 4H timeframe formed a double top with bearish momentum divergence.
If price pulled back in a corrective manner we could possible see another leg down to next support level at 26,800 or much lower.

HSI1! 2021 Feb 01 Week
HKEX:HSI1!
HSI1! 2021 Feb 01 Week (Intraday)
"58" in cantonese means "no prosperity".
Coincidentally market went down from there lol
Immediate support = 28078 - 27168 (an auspicious number in Cantonese! Would this support hold?
Intermediate price levels = 27806 & 27548
Support 27108 - 17176
Remember to Like and Follow if you find this useful!
Have a safe and profitable trading week ahead

HSI - Potential Bearish Engulfing on Weekly CloseIt is very crucial for the last trading day of January 2021.
If the weekly candle close below last week low, it will engulfed by a larger red candle indicating a shift toward lower prices.
1. As proven on last trading week of January 2018, 2020 which was also year high for that particular year when this happened.
2. Being resisted twice by 2019 year high at 30,280.
So, is the trend repeating? Is the market already top for the year of "BULL" (2021)? I hope not.
However, the past performance is not always*(sometimes it does)* indicative of future results.
Be cautious. Stay safe and Gong Hei Fat Choi! <3

HSI1! 2021 Jan Week
HKEX:HSI1!
HSI1! 2021 Jan 25 Week
Red Greed zones = preferred entry levels
Grey box = price rotation
If we look at the daily/weekly chart, the high is nearing 30336, previous resistance.
Immediate price watch 29488, 29672
Resistant3 = 30336 (Previous high, supply area)
Resistant2 = 30098 - 30143
Resistant1 = 29857 - 29905
Support1 = 29323 - 29362
Support2 = 28970 - 29000
Trade Management
Profit target can be 30% / 50% / till next zone
Remember to Like and Follow if you find this useful.
Have a safe and successful trading week ahead.

HSI1! 2021 Jan 18 Week
HKEX:HSI1!
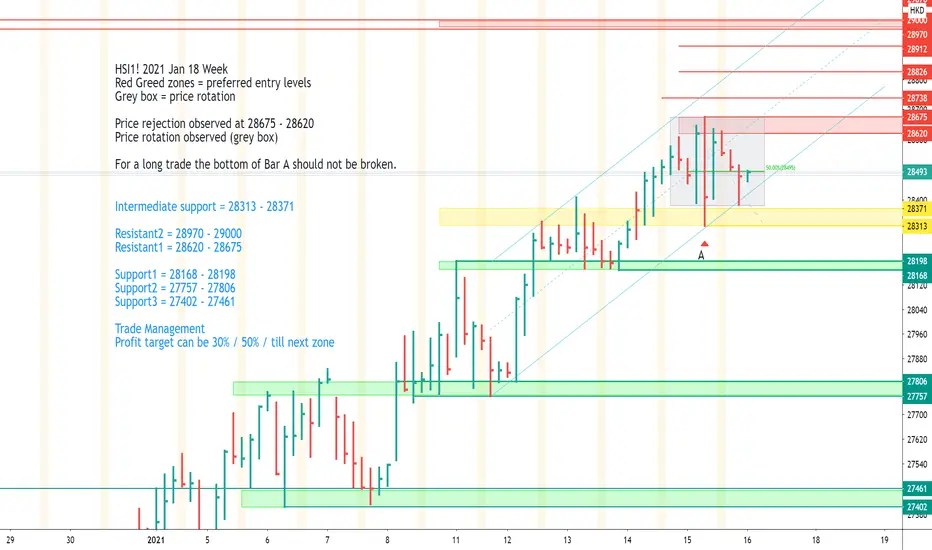
HSI1! 2021 Jan 18 Week
Red Greed zones = preferred entry levels
Grey box = price rotation
Price rejection observed at 28675 - 28620
Price rotation observed (grey box)
For a long trade the bottom of Bar A should not be broken.
Intermediate support = 28313 - 28371
Resistant2 = 28970 - 29000
Resistant1 = 28620 - 28675
Support1 = 28168 - 28198
Support2 = 27757 - 27806
Support3 = 27402 - 27461
Trade Management
Profit target can be 30% / 50% / till next zone
Remember to Like and Follow if you find this helpful :)
HKEX:HSI1!
HS1! 2021 Jan 11 Week
HS1!
HSI1! 2021 Jan 11 Week
Red/Green zones are preferred entry area.
Intermediate 27753 resistance was broken through and has now become intermediate support.
Though B sees a rejection, the volume isnt' as high as I'd like to see.
The bar after it is a down bar on low volume.
Notice also the price rotation zone marked out by the grey box.
Let's see if market is buidling up for higher prices or if this is topping over.
Resistant3 = 28619 - 28755
Resistant2 = 28318 - 28379
Resistant1 = 27958 - 28012
Intermediate support = 27780 - 27806
Support1 = 27645 - 27690
Support2 = 27400 - 27461
Support3 = 26854 - 26947

HSI1! 2021 Jan 06 Midweek Update
HKEX:HSI1!
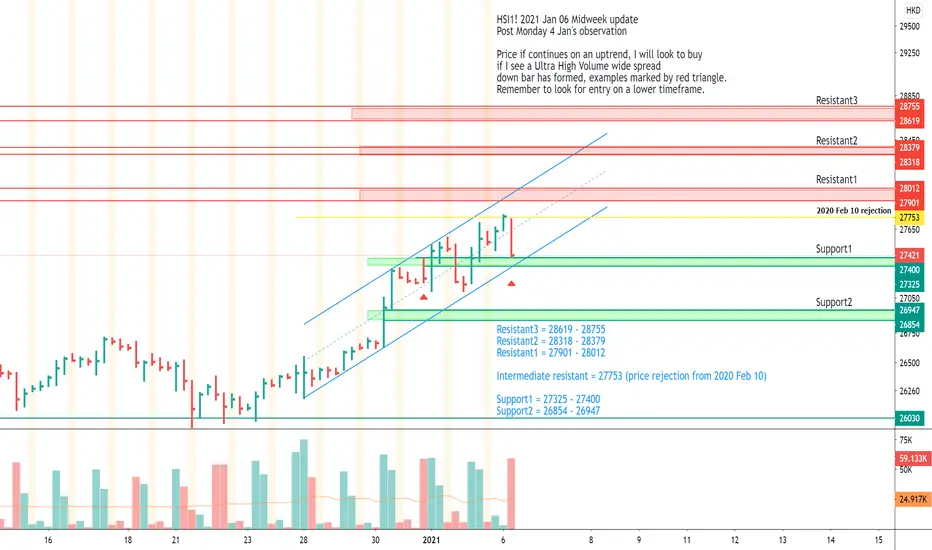
HSI1! 2021 Jan 06 Midweek update
Post Monday 4 Jan's observation
Price if continues on an uptrend, I will look to buy
if I see a Ultra High Volume wide spread
down bar has formed, examples marked by red triangle.
Remember to look for entry on a lower timeframe.
Resistant3 = 28619 - 28755
Resistant2 = 28318 - 28379
Resistant1 = 27901 - 28012
Intermediate resistant = 27753 (price rejection from 2020 Feb 10)
Support1 = 27325 - 27400
Support2 = 26854 - 26947
Click like or follow if you find this useful.
HSI1! 2021 Jan 04 WeekHS1!
Immediate resistance = 27324 - 27400
Immediate support = 26854 - 26947
A = Pushed through an old top 27077 on high volume
B = Weakness is seen from the selling and closing near the low
Watch Monday's close for indication from big boys.
Trade management
TP can be 30% / 50% of range or between the range.
