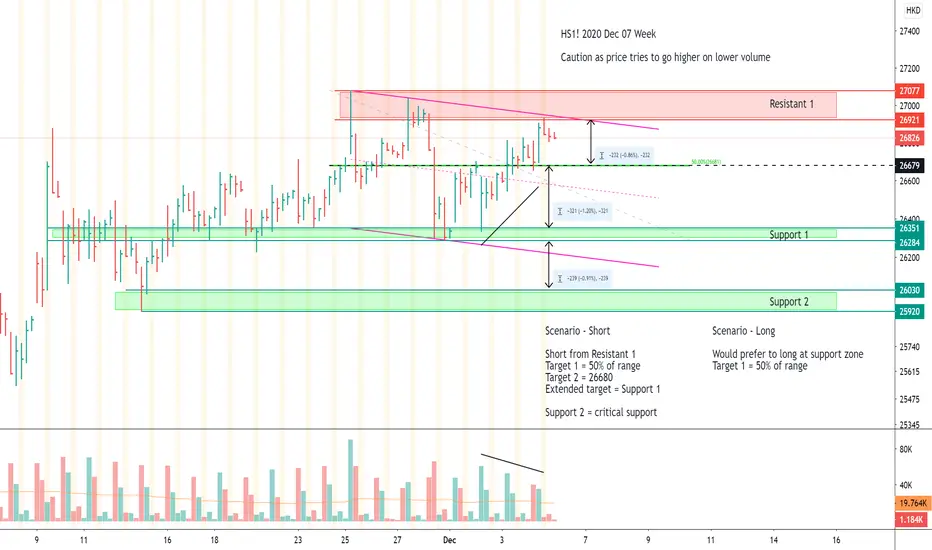
HS1! 2020 Dec 07 WeekHS1!
Scenario - Short
Short from Resistant 1
Target 1 = 50% of range
Target 2 = 26680
Extended target = Support 1
Support 2 = critical support
Scenario - Long
Would prefer to long at support zone
Target 1 = 50% of range
Hangsengindex
Selloff ImminentExpecting HSI to top at 27100-250 area and make its way down within next few days.
26750-800 is the key support. Distribution as of now does not support a broader selloff.
If you are new, i update regularly throughout the week within this post as the action unfolds.

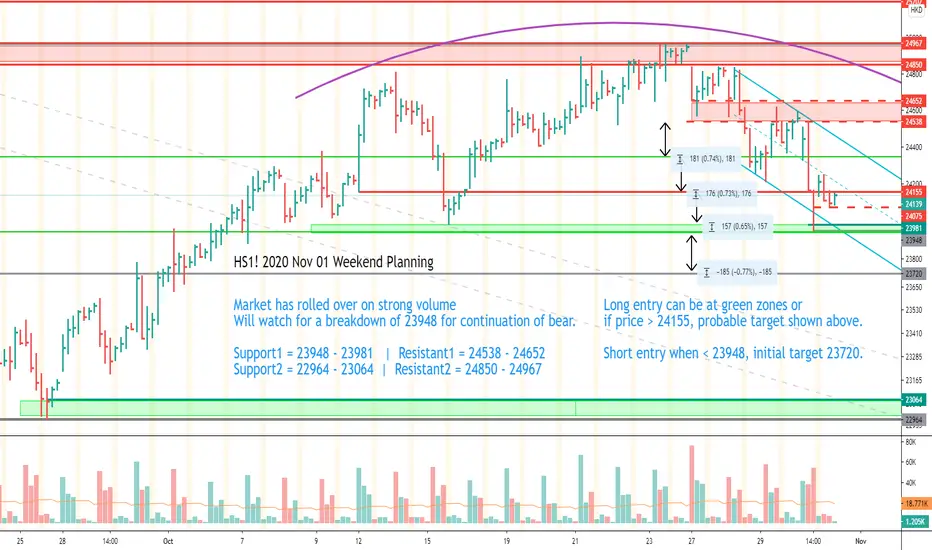
HS1! 2020 Nov 30 Week PlanningHS1!
Bar 1
Price tried to break out of the resistance zone before meeting rejection to higher prices, closing in the lower region of the bar.
The breakout is not convincing
Bar 2
Another breakout attempt, but made a lower high than bar 1.
There is some demand as price close slightly above middle of the bar.
Reason for caution is that although the top of the resistance at 26876 is beginning to act like support, we are still in the supply area of Bar 1.
And the diminishing volume on the breakout attempts tell us that bullish strength is not really present.
Scenario planning:
1) 26876 resistance turned support and strong buy volume comes in. Will it attempt to close the gap from February 2020?
2) Mark up on low volume continues before price reversal
3) Price reversals back into resistance zone, and subsequently goes lower back into the rotation range
Trade with care for 30 Nov week.


Hong Kong Hang Seng Index New Target 27,000 $HSI We have broke 25 and 26k, next stop is the 200 ma (red line), channel resistance and psychological level of 27k.
Because of how fast we have run in the last couple of days, I do expect us to retrace back to the blue line and even the 50 ma (yellow line) at some stage. It is likely that we retrace back to the these levels before going to 27k.


Hong Kong Hang Seng index getting interesting again. $HSI Currently, we are still inside the descending channel pattern.
If we do breakout, 26k is the next resistance.


Hang Seng Weekend Planning 2020 Sep 26HSI1!
Price edged higher.
Volume did not indicate convincing buying.
My preferred Long / Short scenario.
#DYODD #NotTradeCall

Insight into the thought processAs i am getting a lot of questions, i decided to present the thought process of my recent analysis. I hv very little PC knowledge so i can't present analysis in a very professional way. If you have any question, i will be glad to help.

HSI - to bounce or to break?The Hang Seng Index had a boosting rally a couple of weeks ago, but lost its hold at the top of the channel and had been working its way down slowly since. Unlike the STI, the HSI appears relatively stronger given the environment and situations it has been in, particularly over the past year and a half.
It is a t the lower end of the channel, and candlesticks indicate a slight push down to test the support, followed by a bounce, and a likely fail about two or three weeks later... the downside fallout could come earlier, but there is little now to trigger it, albeit a surging COVID-19 cases in the territory.
Ominous weeks to follow, watch for bounce or failure.

Post Fed. HSI Super BearishRallied briefly but as anticipated it was short lived and sold off from first resistance. We now have an inside day fake out on dailies and are very close to the key levels 24300-500. Acceleration gap through there will signal the start of mark down. With the amount of distribution, 20k should be minimum but its not just the last 3 months. It has been going on since late 2017(refer to my 23 May post, linked below).
If you are short, hold onto this one. It can be very big.

Elliott Wave View: Hang Seng Index Correction In ProgressHang Seng 15 minutes chart below shows that the index has extended lower from July 7 peak. The decline is unfolding as a double three Elliott Wave Structure. From July 7 high, wave W ended at 25570.36 low. The bounce in wave X ended at 26103.84 high. The pair then extended lower in wave Y, which ended at 24766.17 low. This completed wave (W) in larger degree. The decline reached the blue box area, which is the 100 – 123.6% extension of wave W-X. From that blue box, the Index did a 3 waves bounce in wave (X), which ended at 25772.41 high. The bounce unfolded as zig-zag Elliott Wave Structure.
Afterwards, the Index continued its decline and broke below previous wave (W) low. This confirms that the next leg lower in wave (Y) is already in progress. Down from wave (X) high, the index extended lower in wave A and ended at 24526.91 low. Wave A low ended at 61.8-76.4% extension of wave (W)-(X). From there, the index is currently doing a bounce in wave B. While below 25772.41 high, the bounce in 3,7 or 11 swings is expected to fail. The index then can do another leg lower in wave C before ending wave (Y) in the larger degree. The 100-161.8% extension of (W)-(X) where (Y) can end is between 22486-23743 area.

