HARDUSDT – Professional Analysis: Blue Box Resistance ZonesHARDUSDT is currently testing crucial levels, and the blue boxes are clearly acting as strong resistance areas. These levels aren’t arbitrary—they've been identified through careful analysis of price behavior and historical reaction, which is why I consistently deliver a high win rate that you can verify on my profile.
Key Insights:
Blue Boxes as Resistance: These zones have repeatedly proven to be where sellers step in, creating significant barriers for upward price movement.
Confirmation is Crucial: I never trade blindly. I wait for clear lower time frame (LTF) confirmations—if HARDUSDT rejects at these resistance levels with a clean LTF downward breakdown and confirmed by CDV signals, that is my cue for a short entry.
Adaptive Strategy: If, by chance, the price breaks above these blue boxes with strong volume and then retests them as support, I will adjust my strategy and consider a long position. I never insist on a short idea; I simply respond to what the market tells me.
How to Trade:
Short Setup:
Wait for HARDUSDT to approach the blue boxes.
Look for rejection signals on the lower time frames (5-minute, 15-minute).
Confirm with CDV and other technical indicators that the downward momentum is intact before entering a short.
Potential Long Shift:
If the resistance is broken with significant volume and a successful retest, be prepared to switch the bias to long.
This adaptive approach is what separates professional trading from mere speculation.
Why Follow This Analysis:
I operate at a level that most traders don’t reach—using a disciplined, data-driven approach that ensures every entry is validated by robust market signals. My methodology has been refined over years of experience, which is why my trading success is among the highest around.
If you’re serious about trading profitably, you need to follow strategies rooted in precision, discipline, and market-tested confirmations. Trust the process, follow the analysis, and let the market work in your favor.
Stay sharp and trade with confidence, your success depends on it.
📌I keep my charts clean and simple because I believe clarity leads to better decisions.
📌My approach is built on years of experience and a solid track record. I don’t claim to know it all but I’m confident in my ability to spot high-probability setups.
📌If you would like to learn how to use the heatmap, cumulative volume delta and volume footprint techniques that I use below to determine very accurate demand regions, you can send me a private message. I help anyone who wants it completely free of charge.
🔑I have a long list of my proven technique below:
🎯 ZENUSDT.P: Patience & Profitability | %230 Reaction from the Sniper Entry
🐶 DOGEUSDT.P: Next Move
🎨 RENDERUSDT.P: Opportunity of the Month
💎 ETHUSDT.P: Where to Retrace
🟢 BNBUSDT.P: Potential Surge
📊 BTC Dominance: Reaction Zone
🌊 WAVESUSDT.P: Demand Zone Potential
🟣 UNIUSDT.P: Long-Term Trade
🔵 XRPUSDT.P: Entry Zones
🔗 LINKUSDT.P: Follow The River
📈 BTCUSDT.P: Two Key Demand Zones
🟩 POLUSDT: Bullish Momentum
🌟 PENDLEUSDT.P: Where Opportunity Meets Precision
🔥 BTCUSDT.P: Liquidation of Highly Leveraged Longs
🌊 SOLUSDT.P: SOL's Dip - Your Opportunity
🐸 1000PEPEUSDT.P: Prime Bounce Zone Unlocked
🚀 ETHUSDT.P: Set to Explode - Don't Miss This Game Changer
🤖 IQUSDT: Smart Plan
⚡️ PONDUSDT: A Trade Not Taken Is Better Than a Losing One
💼 STMXUSDT: 2 Buying Areas
🐢 TURBOUSDT: Buy Zones and Buyer Presence
🌍 ICPUSDT.P: Massive Upside Potential | Check the Trade Update For Seeing Results
🟠 IDEXUSDT: Spot Buy Area | %26 Profit if You Trade with MSB
📌 USUALUSDT: Buyers Are Active + %70 Profit in Total
🌟 FORTHUSDT: Sniper Entry +%26 Reaction
🐳 QKCUSDT: Sniper Entry +%57 Reaction
📊 BTC.D: Retest of Key Area Highly Likely
📊 XNOUSDT %80 Reaction with a Simple Blue Box!
📊 BELUSDT Amazing %120 Reaction!
I stopped adding to the list because it's kinda tiring to add 5-10 charts in every move but you can check my profile and see that it goes on..
Hardusdtlong

HARDUSDT: Red Zones Mark the Spot for Sells! HARDUSDT: Red Zones Mark the Spot for Sells! 🔥
Here’s the deal, folks: the red boxes on HARDUSDT are where the action is. These are prime sell points , and you better believe they’re based on smart analysis, not guesswork.
Why the Red Boxes Matter:
They align with key resistance levels —zones where sellers are likely to take control.
The current market structure shows these levels could be pivotal for a short-term correction .
We’re seeing consistent volume spikes , adding even more weight to these areas.
Pro Strategy for These Zones:
Wait for Confirmation: Look for price rejections or bearish patterns—no need to rush!
Use your CDV, liquidity heatmap, and volume footprint indicators to confirm the move.
Risk Management: Place your stop-loss wisely—just above the red box. Never trade without protection!
💡 Want to sharpen your trading skills? I can teach you how to use tools like CDV, liquidity heatmaps, volume profiles, and volume footprints to dominate these markets. DM me or check my profile!
👉 Boost, comment, and follow! Let’s make HARDUSDT another great win. Success awaits! 🚀
Let me tell you, this is something special. These insights, these setups—they’re not just good; they’re game-changers. I've spent years refining my approach, and the results speak for themselves. People are always asking, "How do you spot these opportunities?" It’s simple: experience, clarity, and a focus on high-probability moves.
Want to know how I use heatmaps, cumulative volume delta, and volume footprint techniques to find demand zones with precision? I’m happy to share—just send me a message. No cost, no catch. I believe in helping people make smarter decisions.
Here are some of my recent analyses. Each one highlights key opportunities:
🎯 ZENUSDT.P: Patience & Profitability | %230 Reaction from the Sniper Entry
🐶 DOGEUSDT.P: Next Move
🎨 RENDERUSDT.P: Opportunity of the Month
💎 ETHUSDT.P: Where to Retrace
🟢 BNBUSDT.P: Potential Surge
📊 BTC Dominance: Reaction Zone
🌊 WAVESUSDT.P: Demand Zone Potential
🟣 UNIUSDT.P: Long-Term Trade
🔵 XRPUSDT.P: Entry Zones
🔗 LINKUSDT.P: Follow The River
📈 BTCUSDT.P: Two Key Demand Zones
🟩 POLUSDT: Bullish Momentum
🌟 PENDLEUSDT.P: Where Opportunity Meets Precision
🔥 BTCUSDT.P: Liquidation of Highly Leveraged Longs
🌊 SOLUSDT.P: SOL's Dip - Your Opportunity
🐸 1000PEPEUSDT.P: Prime Bounce Zone Unlocked
🚀 ETHUSDT.P: Set to Explode - Don't Miss This Game Changer
🤖 IQUSDT: Smart Plan
⚡️ PONDUSDT: A Trade Not Taken Is Better Than a Losing One
💼 STMXUSDT: 2 Buying Areas
🐢 TURBOUSDT: Buy Zones and Buyer Presence
🌍 ICPUSDT.P: Massive Upside Potential | Check the Trade Update For Seeing Results
🟠 IDEXUSDT: Spot Buy Area | %26 Profit if You Trade with MSB
📌 USUALUSDT: Buyers Are Active + %70 Profit in Total
🌟 FORTHUSDT: Sniper Entry +%26 Reaction
🐳 QKCUSDT: Sniper Entry +%57 Reaction
📊 BTC.D: Retest of Key Area Highly Likely
This list? It’s just a small piece of what I’ve been working on. There’s so much more. Go check my profile, see the results for yourself. My goal is simple: provide value and help you win. If you’ve got questions, I’ve got answers. Let’s get to work!

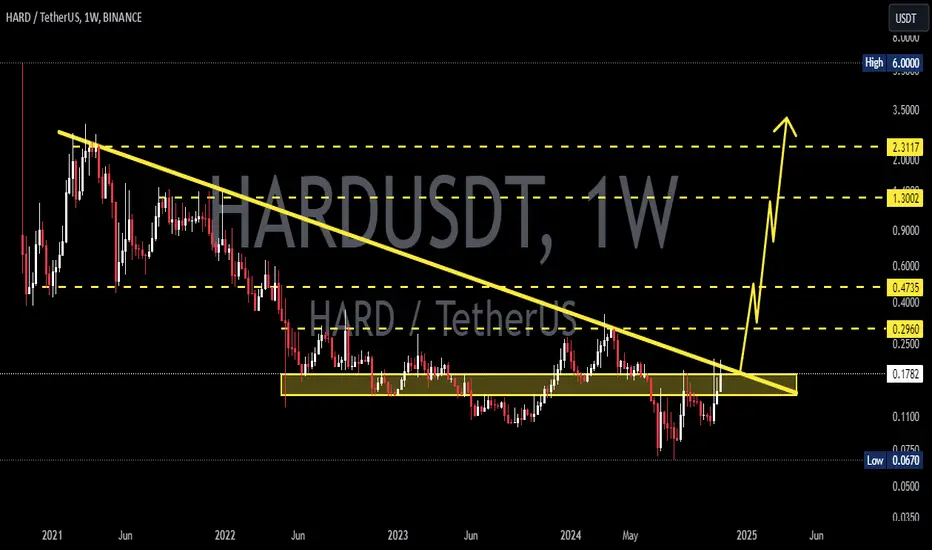
HARDUSDT 1WHARD ~ 1W
#HARD If you still have Conviction on this coin. This support block would be a very good buying place for now,. with a minimum target of 20%++

#HARD/USDT Ready to go higher#HARD
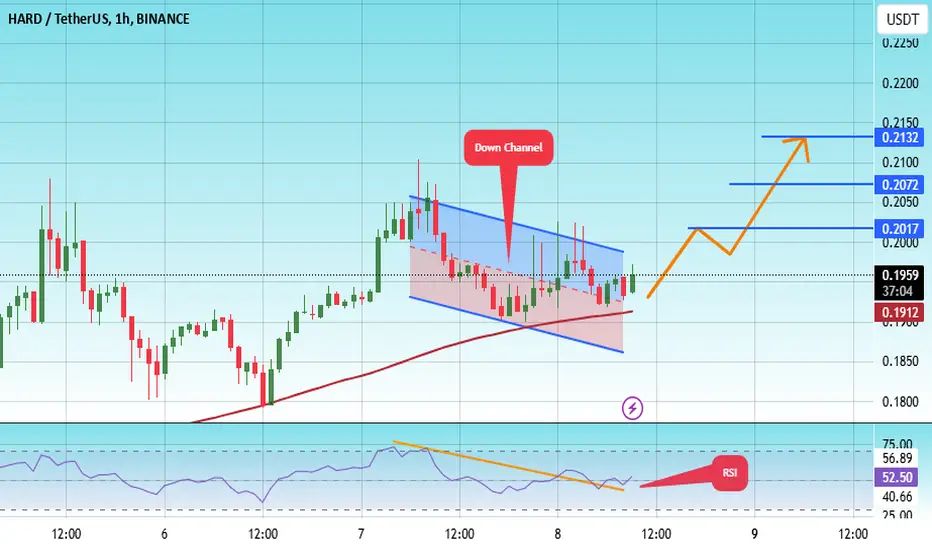
The price is moving in a descending channel on the 1-hour frame and sticking to it well
We have a bounce from the lower limit of the descending channel, this support is at 0.1880
We have a downtrend on the RSI indicator that is about to be broken, which supports the rise
We have a trend to stabilize above the moving average 100
Entry price 0.1960
First target 0.2017
Second target 0.2072
Third target 0.2132
HARDUSDTHARD ~ 1W
#HARD If you have Conviction on the coin,. Buy gradually after breaking through this resistance line with Strong volume. buy in stages with a minimum target of 20%++
Hard USDTHi
Hard USDT
Targets on chart.
We have to breakout the current trendline and close above it.
Note : I think it is about to pump but don't ignore that it moved up a lot from bottom , it can make some correction and this is a weekly chart not 1 hour chart ;)
Consider this red trend lines as targets also
Dyor plz

HARD/USDT - Kava Lend: BBand_Breakout Super-Trend◳◱ We have recently observed two promising signals, a Bollinger Band breakout and a Super Trend pattern, on the AMEX:HARD / CRYPTOCAP:USDT chart, which strongly suggest a bullish trend. The Bollinger Band breakout, characterized by the price surpassing the upper band, signifies a potential upward movement, while the Super Trend pattern further confirms the presence of a bullish sentiment. Seizing the opportunity to enter the market within the current price range and aiming for higher levels appears to be a robust strategy. Notably, key resistance levels can be identified at 0.1352 | 0.1571 | 0.1952, while major support zones are strategically positioned at 0.0971 | 0.0809 | 0.0428.
◰◲ General info :
▣ Name: Kava Lend
▣ Rank: None
▣ Exchanges: Binance, Kucoin, Gateio, Mexc
▣ Category/Sector: N/A
▣ Overview: Kava Lend project overview is currently unavailable. I'll try to update this in the upcoming analysis.
◰◲ Technical Metrics :
▣ Mrkt Price: 0.1205 ₮
▣ 24HVol: 561,241.710 ₮
▣ 24H Chng: 3.522%
▣ 7-Days Chng: N/A
▣ 1-Month Chng: N/A
▣ 3-Months Chng: N/A
◲◰ Pivot Points - Levels :
◥ Resistance: 0.1352 | 0.1571 | 0.1952
◢ Support: 0.0971 | 0.0809 | 0.0428
◱◳ Indicators recommendation :
▣ Oscillators: NEUTRAL
▣ Moving Averages: STRONG_BUY
◰◲ Technical Indicators Summary : BUY
◲◰ Sharpe Ratios :
▣ Last 30D: N/A
▣ Last 90D: N/A
▣ Last 1-Y: N/A
▣ Last 3-Y: N/A
◲◰ Volatility :
▣ Last 30D: N/A
▣ Last 90D: N/A
▣ Last 1-Y: N/A
▣ Last 3-Y: N/A
◳◰ Market Sentiment Index :
▣ News sentiment score is N/A
▣ Twitter sentiment score is N/A
▣ Reddit sentiment score is 0.40 - Bearish
▣ In-depth HARDUSDT technical analysis on Tradingview TA page
▣ What do you think of this analysis? Share your insights and let's discuss in the comments below. Your like, follow and support would be greatly appreciated!
◲ Disclaimer
Please note that the information and publications provided are for informational purposes only and should not be construed as financial, investment, trading, or any other type of advice or recommendation. We encourage you to conduct your own research and consult with a qualified professional before making any financial decisions. The use of the information provided is solely at your own risk.
▣ Welcome to the home of charting big: TradingView
Benefit from a ton of financial analysis features, instruments and data. Have a look around, and if you do choose to go with an upgraded plan, you'll get up to $30.
Discover it here - affiliate link -

$HARD/#USDT [#Kava Lend]: BBand_Breakout Resistance_Breakout_ConHey traders, Hey traders, we've identified bullish signals on the $HARD / $USDT chart through the detection of both a Bollinger Band breakout and a Resistance Breakout. The Bollinger Band indicates a potential bullish trend as the price has moved outside of the upper band, while the Resistance Breakout confirms this trend by showing the price breaking above a key resistance level. Given the alignment of these signals, it may be a good idea to consider entering a long position and targeting higher levels. Our analysis indicates that the key resistance levels are at 0.2203 | 0.2401 | 0.2818 and the major support zones are at 0.1786 | 0.1567 | 0.115. However, it is important to also consider other factors such as overall market conditions and other technical indicators before making a trade decision.
Technical Metrics :
Current price: 0.2081
24H Volume: 689,651.2762 ₮
24H Price change: 3.02%
- Pivot Points - Levels :
Resistance: 0.2203 | 0.2401 | 0.2818
Support: 0.1786 | 0.1567 | 0.115
Indicators recommandation :
Oscillators: NEUTRAL
Moving Averages: STRONG_BUY
Technical Indicators Summary : BUY
- In-depth HARDUSDT technical analysis on > Tradingview TA page

$HARD/#USDT [#Kava Lend]: ResistanceBreakout+ConfirmationWe've detected a Resistance Breakout and Confirmation on the $HARD/$USDT chart. The price has broken above a key resistance level and has been confirmed by a strong candle, indicating a potential bullish trend. The next resistance key levels are at 0.2203 | 0.2401 | 0.2818 and the major support zones are respectively at 0.1786 | 0.1567 | 0.115. We may consider entering a trade at the current price zone at 0.2007 and targetting higher level.
- Technical Metrics Index Summary:
-- Current price: 0.2007
-- 24H Volume: 649,232.3953 USDT
-- 24H Price change: 8.545%
- Pivot Points - Levels:
-- Resistance: 0.2203 | 0.2401 | 0.2818
-- Support:0.1786 | 0.1567 | 0.115
-- Oscillators recommendation: NEUTRAL
-- Moving Averages recommendation: STRONG_BUY

$HARD/#USDT [#Kava Lend]: ResistanceBreakout_+_Confirmation BBanWe've identified bullish signals on the $HARD/$USDT chart through the detection of both a Bollinger Band breakout and a Resistance Breakout. The Bollinger Band indicates a potential bullish trend as the price has moved outside of the upper band, while the Resistance Breakout confirms this trend by showing the price breaking above a key resistance level. Given the alignment of these signals, it may be a good idea to consider entering a long position and targeting higher levels. However, it is important to also consider other factors such as overall market conditions and other technical indicators before making a trade decision.

Kava Lend (HARD) formed bullish Gartley | A good buy opportunityHi dear friends, hope you are well and welcome to the new trade setup of Kava Lend (HARD) with BTC pair.
Our last trade of HARD was below, and we caught more than 130% pump.
Now on a 2-hr time frame, HARD has formed a bullish Gartley pattern for another bullish reversal move.
Note: Above idea is for educational purpose only. It is advised to diversify and strictly follow the stop loss, and don't get stuck with trade

This idea is for hard/usdt binance for longBINANCE:HARDUSDT
by analyzing chart at 4 hours interval know at present time it is showing Bullish Pennant Pattern so price will go long according to it in 4 hours char analysis

$HARD 20-30x opportunityGem. Long term (6+ month).
450 days of accumulation with strong fundamentals.
Take profit 1: 12$
Take profit 2: 17$
No stop loss.
Do your own research.

HARDUSDT coin analysis👑 ̲F̲X̲o̲n̲e̲4̲a̲l̲l̲ 👑 VIP 🚀🚀,
🟢 #HARD - USDT 🔚BINANCE
💰 buy Now : 0.77 ( strong coin )
🔸TARGET
🔹 1.04
🔹 1.29
🔹2.21
