XAU/USD POTENTIAL BULLISH SHARK
This is my view on Gold, and as such it is not a recommendation for you to buy or sell XAUUSD, but this is what I'm expecting to happen on Gold in the next couple of days.
Harmonicforex

BEARISH BAT ON USOIL was a huge successWhat a successful trading opportunity on usoil, the bearish bat pattern was in alignment with the weekly order block. A full video breakdown of this trade and more will be posted soon, and the link is attached to this video for you all to learn.

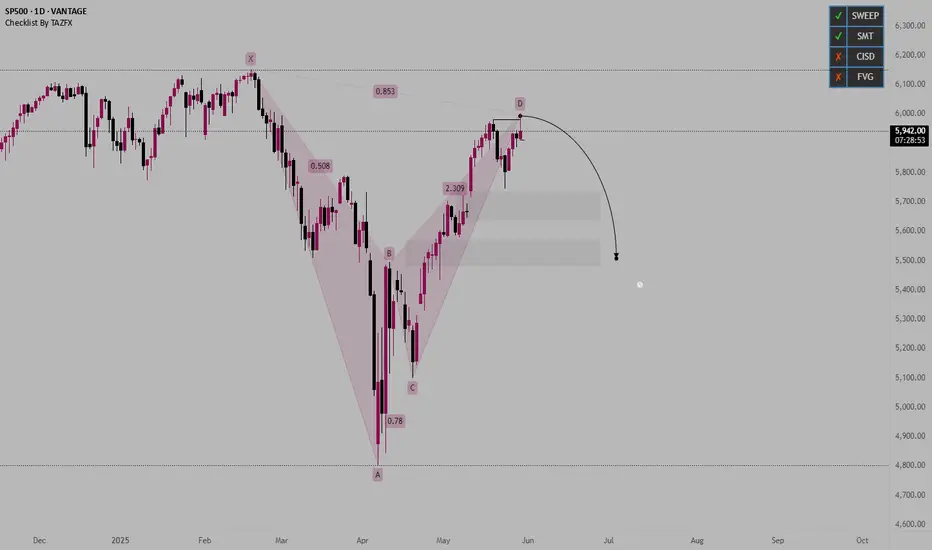
US500 - BEARISH HARMONICFollowing are the marked targets as am expecting price to move to downside to atleast fill the gap area
GBP/USD SELL IDEA (R:R=7)Selling GBP/USD now. Just formed a wonderful butterfly formation on the 4 hour chart. Also, it took out the DAILY D extension yesterday.
Stop Loss: 1.34850
Please move SL to break even when trade is 100+ pips in profit.
Target: 1.30880
Happy Trading! :)

AUDJPY BULLISH OR BEARISH DETAILED ANALYSISAUDJPY has successfully broken out of a long-term descending channel and is currently trading around 94.50. The breakout is clean and supported by solid bullish volume, which confirms that momentum is shifting in favor of the bulls. This setup indicates a clear trend reversal on the daily timeframe, and with the pair establishing higher lows and breaking resistance, the path toward 100.00 looks technically achievable in the coming weeks.
From a fundamental standpoint, the Australian dollar is gaining strength after the Reserve Bank of Australia (RBA) maintained a firm stance on inflation management. The latest CPI figures remain above the RBA’s comfort zone, and recent wage growth data has further reduced the probability of near-term rate cuts. Meanwhile, the Japanese yen continues to lag due to the Bank of Japan's ultra-loose monetary stance and consistent verbal intervention that lacks follow-through, keeping JPY broadly weaker across the board.
Technically, we’ve seen strong follow-through after the breakout, with price now holding firmly above prior resistance turned support. If this momentum sustains, we could see buyers step in aggressively, targeting 96.50 short-term and extending toward the key psychological level of 100.00 in the medium term. The risk-reward remains attractive with a clearly defined invalidation point below 91.00.
Overall, AUDJPY stands out as one of the most bullish JPY crosses on my radar. With a clean breakout, supportive fundamentals from the Australian side, and persistent weakness in the yen, this trade aligns with broader macro sentiment and could offer strong upside potential heading into the next quarter.

EURUSD: Back to 1.1200Using the Fibonacci extension tool, we could see price hasn't closed and rally above 2.0. Maybe we could get some turn around before continuing bullish on EURUSD.

USD/CHF: Bearish Continuation Towards Key SupportUSD/CHF has maintained a strong bearish trend, forming a series of lower highs and lower lows. The chart highlights a **Deep Crab** harmonic pattern, which previously triggered a corrective move before resuming its overall downtrend.
Currently, price action is trading near **0.8767**, approaching a key support zone at **0.8722** (HOP level). The recent rejection from the **H4 supply zone** around **0.8920** further confirms bearish momentum, suggesting sellers remain in control.
**Key Considerations:**
- A breakdown below **0.8722** could accelerate further downside, extending losses towards lower psychological levels.
- A potential pullback may occur if buyers step in at support, but the overall bearish structure remains intact unless a significant reversal signal appears.
**Conclusion:** USD/CHF remains under bearish pressure, with a high probability of further declines. Traders should monitor price action at support for potential continuation or reversal signals before committing to new positions.

EUR/JPY Market Analysis: Potential Reversal at Key Resistance LeThe EUR/JPY pair, on the 4-hour chart, exhibits a strong bullish impulse that recently peaked around 163.64 , aligning with a key Fibonacci extension level (1.618). This area marks a critical resistance zone, where price action has shown signs of rejection.
The Harmonic pattern, such as the b]Crab , suggest potential exhaustion of the uptrend. The latest leg upward reached a 2.618 extension , reinforcing the possibility of a corrective move. Support levels to monitor include ** 162.23 ** (BC) and ** 160.59 ** (T1), which could serve as downside targets if bearish momentum gains traction.
For traders, a decisive break above **163.64** could invalidate the short-term bearish bias, paving the way for further upside. Conversely, sustained rejection from this level may trigger a deeper retracement towards key Fibonacci and harmonic support zones.
Conclusion : The pair is at a critical inflection point, where price action and confirmation of rejection signals will determine the next directional move. Traders should watch for price action at resistance and key support levels to assess trade opportunities.

BNXUSDT Breakout Imminent: High Volume Signals Potential 50-60%BNXUSDT is currently forming a strong breakout pattern, showing signs of bullish momentum. The trading volume is increasing, indicating that investors are actively participating in this move. With a solid structure and a breakout looking imminent, BNXUSDT could be set for a significant rally. Traders are closely watching this level, anticipating a strong price surge once the resistance is broken.
Technical analysis suggests that the price is consolidating just below a key breakout point. A successful breakout could trigger a sharp upward movement, with potential gains ranging from 50% to 60%+. The combination of strong volume and market interest further supports this bullish scenario. As the buying pressure builds up, BNXUSDT could soon enter a high-momentum phase, attracting more investors looking for profitable opportunities.
With the crypto market showing increased volatility and potential, BNXUSDT remains a promising asset to watch. Traders and investors are advised to keep an eye on this pair as it moves closer to its breakout zone. A confirmed breakout with sustained volume could validate the anticipated bullish run, offering traders a lucrative upside potential.
✅ Show your support by hitting the like button and
✅ Leaving a comment below! (What is your opinion about this coin)
Your feedback and engagement keep me inspired to share more insightful market analysis with you!

GBP/USD 15-Minute Chart: Bearish Reversal at Harmonic CompletionThe chart showcases a well-defined harmonic pattern, the Shark, with the price reaching the terminal zone at 1.2670 , marked by a red downward triangle. This suggests a potential reversal zone where selling pressure may emerge.
Key observations:
The price has reacted strongly at the completion point, aligning with Fibonacci extensions.
Overbought conditions are evident in the RSI and other momentum indicators, indicating potential exhaustion of the bullish trend.
Target levels:
T1: 1.26241
T2: 1.25741
Suggests a possible downside move if the reversal confirms.
Traders should watch for bearish confirmation before entering short positions, while bulls may seek a break above 1.2670 for further upside.

GBP/JPY SELL IDEA (R:R=4.8)I just placed a sell order for GBP/JPY at 191.700. We have a wonderful X BAT that just formed on the 1 HOUR chart.
Please trade with proper risk management, since we have news announcements coming out at 8:15 AM EST today.
ADP Non-Farm Employment Change
Stop Loss: 192.368 (Daily High)
Take Profit: 188.450
Happy Trading!

GBP/USD Approaching Key Reversal ZoneThe GBP/USD pair has reached a critical resistance area around 1.2658, aligning with the 1.13 Fibonacci extension level of the harmonic Gartley pattern. The price action suggests potential exhaustion in the bullish trend, with signs of rejection near this level.
A confirmed reversal could lead to a corrective move towards key support zones at 1.2456 and 1.2320. However, if the pair sustains above 1.2685, further upside towards 1.2732 and the HOP level at 1.2843 remains possible.

GBP/USD at Key Resistance: Potential Reversal or Continuation?The GBP/USD 15-minute chart indicates a strong uptrend, with price action forming a **Crab harmonic pattern**, suggesting a potential overextension. The pair has reached a key resistance zone at **1.26323**, aligning with significant Fibonacci levels, with the **Harmonic Optimal Point (HOP) at 1.26469** acting as a potential reversal area.
If a pullback occurs, the first downside targets are 1.26127 and 1.25993 , while the ** 200 EMA ** below may provide further support. A sustained break above 1.26469 could signal continued bullish momentum. Traders should monitor price action for confirmation before positioning accordingly.

GBP/USD Market Analysis – Bearish Reversal from Harmonic PatternThe GBP/USD pair has completed a Crab harmonic pattern , with price reaching the 1.618 extension level and reacting strongly at resistance near 1.2617. The rejection suggests a potential bearish reversal.
Initial downside targets (T1 and T2) are at 1.2515 and 1.2445. If price sustains below 1.2593 (AB=CD level), further downside is likely. However, a breakout above the high could invalidate the bearish setup. Traders should watch for confirmation signals before taking positions.

GBP/JPY SELL IDEA (R:R=5.9)Placed a sell order for G/J at 190.695. We have a beautiful X CRAB that just formed on the 30 minute chart.
Trade with proper risk management please since we have news announcements coming out at 4:30 AM EST today.
GBP-Flash Manufacturing PMI
GBP-Flash Services PMI
Stop Loss: 191.285
Take Profit: 187.200
Happy Trading!

SUSDT Key Resistance Broken – Bullish Momentum SUSDT has recently broken through a key resistance level, signaling a shift in market sentiment and the potential for a strong upward movement. Breaking past major resistance is a crucial technical event that often leads to a new phase of price action, and for sUSDT, this breakout has been accompanied by good volume, confirming the strength of the move. With strong investor interest and an expected gain of 25% to 30%+, traders are now watching closely to see how the price behaves as it continues to test new highs. The breakout above resistance sets the stage for further bullish movement, potentially attracting more buyers into the market.
The breakout from the main resistance level is a key indicator that the sellers' control has been broken, and buyers are now in charge. As the price holds above this key level, it’s likely that more traders will enter, pushing the price higher. The good volume supporting the breakout further validates that this move has solid momentum, and the chances of a sustained rally are increasing. If sUSDT continues its upward trajectory, it could reach the projected gain range of 25% to 30%+, with new resistance levels providing the next potential targets.
Investors are taking increasing interest in sUSDT as the price breaks above important technical levels. This shift in market sentiment is not only supported by the price action but also by the growing participation from investors who see potential for further gains. The volume confirms that this is not a false breakout, and as more traders recognize the bullish setup, the price could continue to rise steadily. With solid technical backing and a growing interest in the project, sUSDT is positioning itself as a strong candidate for higher returns in the near term.
Traders should monitor key support levels to ensure that the breakout holds. If sUSDT can maintain its position above the broken resistance level, it could continue to gain momentum, offering a potential 25% to 30%+ return. As always, staying updated on broader market conditions and volume trends will help confirm the strength of the breakout. Given the current setup, sUSDT presents an exciting opportunity for traders looking to capitalize on a potential upward trend in the near future.

GLUSDT 50%-77% Gains – Bullish Momentum Set to Surge!GLUSDT has recently broken out of a Falling Wedge Pattern, a technical formation that typically signals the end of a downtrend and the potential for significant price action upward. The Falling Wedge is characterized by converging trendlines, with the price action tightening as buyers and sellers reach an equilibrium before one side gains control. With a solid breakout now in play, GLUSDT is poised for a strong bullish move. The volume accompanying the breakout is good, indicating strong market participation and confirming that the move has the potential to continue. Traders are anticipating gains ranging from 50% to 77%+ as the price continues to push higher, potentially testing key resistance levels.
The breakout from the Falling Wedge pattern is a key event for GLUSDT, and with good volume supporting this move, it increases the likelihood that the price will continue its upward trajectory. Falling Wedges typically indicate that buying pressure is starting to build, and once the resistance level is cleared, the price often experiences a surge. The breakout has already set the stage for a potential rally, and traders are now looking for confirmation of the next resistance levels to determine how far the price might go. With strong technical backing and good investor interest, GLUSDT is well-positioned for substantial price gains in the near term.
Investors are taking increasing interest in GLUSDT, as the breakout from the Falling Wedge marks a key shift in sentiment. The good volume confirms that this pattern is not a false breakout, and with many traders eyeing the potential for higher returns, this project is gaining momentum. As the market shifts from a bearish to a bullish outlook, GLUSDT could see a sharp rise, testing higher price levels and delivering the anticipated 50% to 77%+ gains. The rising interest and positive market sentiment around GLUSDT further solidify its status as a potential high-reward opportunity.
Traders should closely monitor key support and resistance levels as the price action unfolds. If GLUSDT can maintain its momentum and push through further resistance, the rally could extend toward the projected gain levels. As always, it’s important to track volume and market conditions to confirm the strength of the breakout. With the current setup and positive technical indicators, GLUSDT is one of the more promising crypto pairs to watch for potential substantial gains.

EUR/USD Bullish Outlook Following Bat Pattern CompletionThe EUR/USD 1-hour chart displays a completed Bat harmonic pattern, with price reversing near the 0.886 Fibonacci retracement level, suggesting a potential bullish move. Key trade levels include a support zone at 1.02911 and targets at 1.03394 (T1) and 1.03784 (T2).
Current consolidation above the pattern's completion point indicates potential continuation to the upside, with confirmation needed via a breakout above the highlighted zone. A stop-loss below 1.02911 is advised to manage risk. A break below this level would invalidate the bullish setup.

CADCHF Breaks Resistance After Falling Wedge BreakoutCADCHF is currently trading at 0.6360, with a target price of 0.7500, indicating a bullish outlook. The pair has completed a falling wedge breakout, a strong reversal pattern signaling a potential upward trend. This breakout suggests that selling pressure has weakened, allowing buyers to take control. Additionally, CADCHF is breaking a key resistance level, further confirming bullish momentum. A successful breakout above this resistance could lead to a price surge, targeting over 500 pips in gains. Traders should watch for volume confirmation to ensure the breakout is valid. A strong push above resistance with high volume increases the likelihood of sustained movement. Pullbacks or minor corrections may occur, but the overall trend remains bullish. Risk management strategies, including stop-loss placement, are essential to protect against unexpected reversals. Monitoring economic events affecting CAD and CHF will also help in assessing future price movements.

XAUUSD Analysis Retest, and Target of 3000XAUUSD, which represents the price of gold (XAU) against the US dollar (USD), is currently trading at 2860. The target price is set at 3000, indicating a bullish outlook. The market is following the support and resistance pattern, a common technical analysis method. Currently, a small retesting phase is occurring, where the price is momentarily pulling back before resuming its upward trend. This retest is a natural market movement that helps confirm the breakout strength. If the support holds, buyers will likely push the price toward the 3000 level. The psychological resistance at 3000 might cause some fluctuations. However, if momentum remains strong, the price could surpass this level. Traders should monitor volume and market sentiment for further confirmation. Proper risk management is crucial, as unexpected reversals can occur.

EURNZD Analysis , Support Bounce and Bullish PotentialEURNZD is currently trading at 1.83300, with a target price of 1.89000. This suggests a potential upward movement of 500+ pips. The price is bouncing off a strong support level, indicating a possible bullish reversal. The support and resistance pattern highlights key price zones where buying and selling pressure increase. A successful bounce from support strengthens the bullish outlook. Traders anticipate the price moving towards the next resistance level at 1.89000. Confirmation through candlestick patterns and volume analysis is essential. Risk management should include a stop-loss below the support level. Fundamental factors like interest rate decisions can impact price action. Monitoring market sentiment and economic news is crucial for trade execution.

EURAUD Analysis Bullish Flag Breakout PotentialEURAUD is currently trading at 1.65600, with a target price of 1.70000. This indicates an expected upward movement of 500+ pips. A bullish flag pattern has been identified, which is a continuation pattern signaling potential further gains. The pattern suggests a temporary consolidation before a breakout to the upside. Traders anticipate a strong bullish move once the resistance level is breached. Volume and momentum should confirm the breakout for a higher probability trade. Risk management is crucial, with stop-loss placement below the flag’s support. Fundamental factors like interest rate decisions and economic data can influence price action. A successful breakout may attract more buyers, accelerating the upward movement. Monitoring price action near resistance is key for trade execution.

NZDUSD Falling Wedge Breakout – 400+ Pips Opportunity!NZDUSD forex pair is currently trading at 0.56800, with a target price of 0.60000, offering a potential gain of 400+ pips. This bullish outlook is supported by a falling wedge breakout, a technical pattern indicating a reversal from a downtrend to an uptrend. The breakout is further strengthened by a good bounce from a key support level, suggesting strong buying interest at lower prices. The rising momentum and breakout signal a shift in market sentiment, potentially attracting more buyers. The target of 0.60000 represents a significant resistance level, and reaching it would require sustained upward pressure. Traders may view this as a buying opportunity, aligning with the breakout’s direction. However, factors like economic data, global risk sentiment, and commodity prices (e.g., dairy exports for NZD) should be monitored. Proper risk management, including stop-loss orders below the support level, is crucial to manage potential reversals. This setup combines a strong technical pattern with clear profit potential, making it appealing for short-to-medium-term trading strategies.
