Why USDCHF is in Retesting Phase? and Expected Trend ReversalUSDCHF is currently trading at 0.91000, with a target price of 0.89900, indicating a short-term bearish movement. The expected price drop of 100+ pips suggests a potential short-selling opportunity. The pair is in a retesting phase, meaning it is re-evaluating a previously broken trendline. This retest occurs after a downtrend, confirming bearish momentum. However, after this small decline, a strong bullish wave is anticipated. The price is expected to recover and move upward toward the 0.93000 level. This suggests a trend reversal after the retracement phase. Traders may consider shorting until 0.89900, then looking for bullish confirmation. Risk management is crucial due to potential market volatility. Analyzing support, resistance, and market sentiment can help refine entry and exit points.
Harmonicforex

Time to turn around? GBPUSD"That's GBP, the price go up if it's USD" = Central Cee, 21 Savage
Looks like these two rappers may be onto something here, reaching the 1.618 resistance, we may see the dollar rise against the pound again causing GBP to continue falling.
GBPUSD has currently pierced it's way out of the trend channel, let's see how this plays out.

USDCAD Bullish Flag Breakout and Uptrend PotentialUSDCAD is currently trading at 1.45200, showing a bullish outlook. The expected target price is 1.48590, indicating a potential gain of 300+ pips. A bullish flag pattern has already broken out, confirming strong upward momentum. This breakout suggests that buyers are in control and may push the price higher. The price action aligns with technical analysis, supporting a continued uptrend. Traders anticipate further bullish movement toward the target. Proper risk management is essential to navigate any pullbacks. Monitoring key resistance levels and market conditions is crucial. A sustained rally above the breakout zone can strengthen bullish confidence. Patience and discipline will be key in managing this trade effectively.

BTCUSD Support Bounce: Targeting 120,000 ResistanceBTCUSD is currently trading at 105,300, with a target price of 120,000. The price is bouncing from a key support level, indicating strong buying interest. Support and resistance levels play a crucial role in technical analysis, helping traders identify potential entry and exit points. A successful bounce from support suggests bullish momentum, increasing the likelihood of an upward move. If the price sustains above this level, buyers may push it toward the resistance at 120,000. A breakout above this resistance could further accelerate the rally. However, if BTC fails to hold the support, a retest or pullback could occur. Risk management is essential, with stop-loss levels placed below support to minimize potential losses. Fundamental factors, such as market sentiment and institutional activity, could influence price movement. Monitoring volume and confirmation signals will help validate the trade setup.

CHFJPY Symmetrical Triangle Pattern AnalysisCHFJPY is currently trading at 170.100, with a target price set at 165.000. The trade setup suggests a potential gain of over 500 pips if the price reaches the target. A symmetrical triangle pattern has been identified on the chart, a common technical pattern indicating consolidation before a breakout. In this case, the breakout has already occurred to the downside, signaling a bearish trend. Traders often expect strong momentum after a confirmed breakout, reinforcing the probability of price decline. The target of 165.000 is likely based on measured move calculations from the triangle pattern. Risk management strategies, such as stop-loss placement, are crucial to mitigate potential reversals. Fundamental factors like central bank policies or economic events could influence the trade’s outcome. If selling pressure continues, the price may reach the target faster than anticipated. Monitoring key support and resistance levels will help assess trade validity.

AUD/USD Resistance Rejection and Bearish OutlookAUD/USD represents the Australian Dollar against the US Dollar in the forex market. The current price is 0.62300, with a target price of 0.60000, indicating a bearish outlook. The expected price drop suggests a potential gain of 200+ pips if the trade moves as anticipated. The analysis is based on the support and resistance pattern, a key concept in technical trading. The price has reached a strong resistance level and is facing rejection, signaling selling pressure. A rejection at resistance often indicates a shift in momentum, leading to a possible downward move. Traders anticipate the price to decline toward the next support level at 0.60000. This setup suggests bearish dominance as long as resistance holds. If the price fails to break above resistance, further downside movement is likely. Proper risk management is crucial, as market conditions can change.

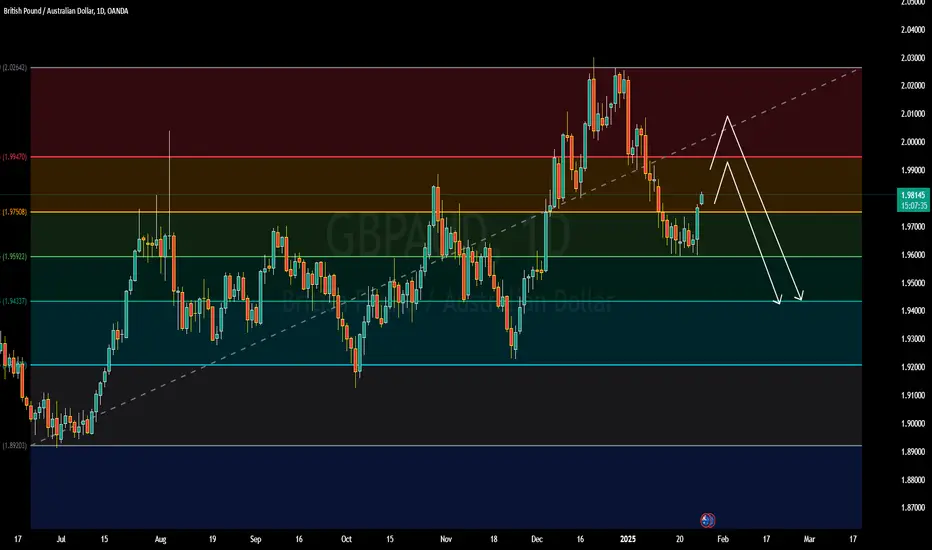
GBPAUD Retesting Resistance with a Potential for Price ReversalGBPAUD is currently trading at 1.981, with a target price set at 2.000, indicating a potential gain of over 200 pips. The market analysis is based on the support and resistance pattern, which suggests key price levels where the pair may react. Currently, the pair is in a retesting phase, meaning it is testing the resistance level after a previous breakout or price movement. This retesting phase helps confirm whether the resistance holds or breaks. If the resistance holds, it signals a potential reversal, leading to a price drop. Traders are advised to closely monitor this retesting period for confirmation before taking positions. A rejection at the resistance level could trigger a bearish move. Patience during this period is critical to avoid premature entries. This setup reflects a potential opportunity for experienced traders following technical analysis strategies.
Analyzing USDCHF Using Support and ResistanceUSDCHF (US Dollar vs. Swiss Franc) is currently trading at 0.904, with a target price of 0.890, indicating a bearish outlook. This presents a potential gain of 100+ pips if the target level is achieved. The analysis is based on a support and resistance pattern, suggesting that the current price is below a key resistance level, which acts as a barrier to upward movement. The next support level is identified at the target price of 0.890, where the price is expected to stabilize or reverse. This implies a short-selling opportunity to profit from the anticipated price drop. The strategy assumes the price will continue its downward trend without breaking above the resistance level. Traders should closely monitor the price action near the resistance and support levels for confirmation. Effective risk management is crucial to account for potential price rebounds. The setup is ideal for technical traders focusing on price action and key levels. This plan is aligned with the overall market trend, reinforcing its validity.

EURCAD Falling Wedge Breakout and Support Bounce EURCAD is currently trading at 1.484, with a target price of 1.505, indicating a potential gain of over 200 pips. The analysis is based on a support and resistance strategy, highlighting a key level of support where the price has recently bounced. A falling wedge breakout has already occurred, signaling a bullish reversal pattern. This breakout suggests increased buying momentum as the price moves away from the support. The support level appears to be holding strongly, reinforcing the likelihood of upward movement. Traders are targeting the next resistance zone near 1.505 as the projected price. The setup reflects a well-defined risk-to-reward ratio, favoring long positions. Monitoring price action at key levels is crucial to confirm the trend. Overall, the pair shows strong bullish potential based on technical patterns and market dynamics.

CADJPY Rising Wedge Breakout and Targeting Support LevelCADJPY is currently trading at 108.300, with a target price set at 106.000, offering a potential gain of 200+ pips. The analysis is based on a support and resistance pattern, indicating the pair’s key price levels. A rising wedge breakout has already occurred, a bearish signal pointing to further downside potential. The price is now positioned below a major resistance level, confirming sellers' dominance in the market. With this setup, the pair is likely to continue its downward movement toward the main support level, which aligns with the target price. The bearish momentum is expected to persist as long as the resistance level holds strong. Traders should watch for any confirmation of increased selling pressure to solidify this trend. This setup highlights a favorable opportunity for bearish trades with a defined risk-reward ratio. The focus remains on the target support level as the next key price point.

EURGBP Navigating Resistance Levels for a Bullish BreakoutEUR/GBP is currently trading at 0.842, with a target price of 0.852, indicating a potential gain of over 100 pips. The analysis is based on the support and resistance pattern, with the pair currently positioned at a resistance level. A minor retracement or retesting of the resistance is expected at this stage. This retracement is a healthy part of the price movement, allowing the market to gather momentum for the next bullish wave. After the retest, a strong upward trend is anticipated, potentially breaking past the resistance level toward the target price. Traders should monitor this retracement closely to identify optimal entry points. The analysis reflects a bullish sentiment, supported by technical levels. However, proper risk management should be maintained. This trade setup aligns with the principles of technical analysis and trend continuation.

Understanding Symmetrical Triangle Breakout and Retest XAUUSD (Gold vs. US Dollar) is currently priced at 2680, with a target price set at 2660. This indicates a bearish outlook, suggesting the price is expected to drop. The pair has recently experienced a symmetrical triangle breakout, which is a technical chart pattern signaling potential price movement. After the breakout, the price is now in a retesting phase, a common occurrence where the price revisits the breakout level to confirm the move. Traders often view this as a critical period to assess the strength of the breakout. If the retest holds, it could validate the downtrend, increasing the probability of reaching the target price. However, failure to maintain the breakout level could result in a reversal. This scenario highlights the importance of monitoring key support and resistance levels. The retest phase provides an opportunity for risk management and strategic entry.

GBP/JPY Technical Analysis: Targeting 500+ Pips GBP/JPY is currently priced at 190.200, with a target price of 185.000, implying a potential gain of 500+ pips. The analysis indicates that the pair is approaching a major trendline, which acts as a strong support level. This suggests the price may reverse or consolidate around this level. A break below the trendline could signal further downside potential, aligning with the bearish target. The 500-pip gain signifies a significant price movement, highlighting the importance of proper risk management. Traders should monitor price action near the trendline for confirmation. The setup reflects a technical pattern where the trendline's strength will likely dictate the next move. This level serves as a critical zone for potential entry or exit decisions. Staying alert to market sentiment and economic events related to GBP and JPY is essential for validation.

BUTTERFLY PATTERNHarmonic Pattern Trading Strategy:
1. Combine patterns with 2-3 confirmations (e.g., MA, BB, RSI, Stoch) for increased accuracy.
2. Implement proper risk management.
3. Limit exposure to 3% of capital per trade.
4. Exercise caution: Not every Harmonic Pattern presents a good trading opportunity.
5. Conduct thorough diligence and analysis before trading.
Disciplined approach = Enhanced edge.

USDCAD Consolidation: Eyeing a Breakout Above Key Resistance USDCAD is currently trading at 1.443, with a target price of 1.490, suggesting a potential gain of over 500 pips. The analysis is based on the support and resistance pattern, indicating that the pair is holding its main resistance level. A breakout above this resistance level is being anticipated. Currently, the pair is in a consolidation phase, where price movements are relatively limited. This phase often signifies market indecision and can precede significant price action. Traders are closely monitoring the breakout potential, as a breach of resistance could signal strong upward momentum. The technical setup suggests bullish sentiment, with the resistance level acting as a critical price point. If the breakout occurs, it may confirm the continuation of the uptrend. However, traders should remain cautious and consider potential reversals if the resistance holds.

Analyzing Symmetrical Triangle Breakouts: A Bearish Setup for USUS30, representing the Dow Jones Industrial Average index, is currently trading at 42,500 with a target price of 41,500, indicating a bearish outlook. The price action is forming a symmetrical triangle pattern, a technical setup that reflects market indecision as it consolidates within converging trendlines. This pattern typically precedes a breakout, which could occur in either direction, though in this case, traders are anticipating a bearish breakout. A decisive move below the triangle's lower trendline would confirm the breakout, signaling a continuation of the downward trend. Once the breakout is validated, the price is expected to head toward the target of 41,500, offering a potential opportunity for short positions. Confirmation of the breakout is essential to avoid false signals, and traders should watch for strong momentum and volume supporting the move. This setup highlights the importance of monitoring key technical levels to capitalize on market movements.

Trading the Falling Wedge Pattern: A Bullish Setup for EURUSDEURUSD, a major forex pair representing the euro against the US dollar, is currently trading at 1.03000, with a target price of 1.11000. The pair is forming a falling wedge pattern, a bullish reversal signal that typically indicates a potential price breakout to the upside. This pattern develops as the price narrows between converging trendlines, reflecting decreasing selling pressure. Traders are closely monitoring the pair for a breakout confirmation, which would signal the start of a bullish trend. Once the breakout occurs, it is expected to drive the price toward the target level, offering a substantial upward move. Confirmation of the breakout is crucial to validate the pattern, as false breakouts are common in such setups. The falling wedge pattern is a strong technical indicator, attracting traders seeking to capitalize on a trend reversal. With the current price action nearing critical resistance levels, the pair is poised for significant movement, aligning with the forecasted target.

Case Study of XAUUSD : Symmetrical Triangle BreakoutsXAUUSD, representing gold against the US dollar, is currently trading at 2680 and is expected to rise to a target price of 2800. The pair is breaking out of a main symmetrical triangle pattern, a technical indicator signaling a potential continuation of the bullish trend. This pattern forms during a consolidation phase, where price action narrows before a decisive breakout. Following the breakout, it is anticipated that the price will retest the breakout level to confirm its strength and establish a new support zone. Retesting is a common occurrence in technical analysis, reinforcing the breakout's validity and providing traders with confidence in the upward momentum. Once the retest is complete, the price is expected to resume its ascent toward the target. This scenario reflects a strong technical setup, attracting both short-term and long-term traders seeking to capitalize on the projected move. The symmetrical triangle breakout and subsequent retest indicate a well-structured path toward achieving the 2800 target.

Technical Analysis of Nasdaq 100: Key Support Holds as Bulls The Nasdaq 100 (NAS100) is currently trading at 21,100, with a target price of 23,000, suggesting a bullish outlook and a potential rise of 1,900 points. The price is holding above a key trendline, which acts as a strong support level. This trendline's role is significant, as the recent bounce from this support confirms its reliability. The pattern indicates that the index may continue its upward trajectory if no major resistance levels hinder its movement. Such a setup suggests the market sentiment remains positive. A break above intermediate resistance levels could accelerate the rally. However, traders must remain cautious of external factors like earnings reports or Federal Reserve policy updates that might affect momentum. Proper risk management is essential to navigate potential volatility.

EURGBP Breaking Resistance: Turning Challenges into OpportunityThe forex pair EURGBP is currently trading at 0.83300, with a target price set at 0.84500. This suggests a potential upward movement of over 100 pips. The analysis is based on the support and resistance pattern, a widely used technical analysis method. The main resistance level appears to be breaking, indicating bullish momentum. A breakout above the resistance often signifies increased buying pressure and potential for further price increases. Traders might consider this breakout a signal to enter long positions. However, the accuracy of this setup depends on the strength of the breakout and market conditions. It’s essential to monitor for false breakouts, which can lead to reversals. Risk management strategies, such as stop-loss orders, should be in place. Overall, this setup suggests a favorable risk-to-reward ratio for a bullish trade.

Analyzing AUDJPY Breakout: A Bullish Opportunity The forex pair AUDJPY is currently trading at 99.000, with a target price set at 100.000. This suggests an anticipated price movement of 100 pips, signaling a potential gain if the trade goes as planned. The price action indicates an ascending triangle pattern, a bullish continuation pattern often associated with upward price momentum. A breakout above the triangle's resistance level has already occurred, confirming the bullish bias. This breakout implies that buyers are in control, increasing the likelihood of reaching the target. The ascending triangle reflects higher lows, showing consistent buying pressure. Traders often view this as a strong technical indicator for upward movement. Risk management is crucial, as market conditions can shift unexpectedly. Monitoring the pair's price action and related economic events is essential. The breakout provides a clear trading opportunity aligned with technical analysis.

Analyzing XAUUSD: Support and Resistance Dynamics Driving a BullXAUUSD, representing the price of gold against the US dollar, is currently trading at 2635 with an anticipated target price of 2800. The price movement is based on the support and resistance pattern, where the current price is bouncing off a strong support level. This suggests that buyers are stepping in at this level, preventing further declines and creating upward momentum. The support level at 2635 is critical, indicating strong buying interest, while the target price of 2800 reflects bullish sentiment. This pattern demonstrates the interplay of technical levels, with the price expected to rise as it moves toward resistance zones. Traders anticipate a potential breakout above intermediate resistance levels as the price progresses toward the target. The market sentiment is supported by gold's status as a safe-haven asset, attracting investors during uncertain economic conditions. To confirm the upward move, traders may use additional technical indicators like RSI or MACD. However, risk management strategies, such as stop-loss orders below the support level, are essential to mitigate potential losses. Overall, XAUUSD is poised for an upward trajectory, highlighting the importance of support and resistance dynamics in forex trading.

Analyzing AUDCAD Falling Wedge Breakout and 200+ Pips Target The forex pair AUDCAD is currently trading at 0.89700, with a target price of 0.91500, indicating an upward potential of 200+ pips. A falling wedge breakout has occurred, which is a bullish technical pattern that often signals a trend reversal or continuation of an uptrend. The breakout suggests buyers have taken control, pushing the price higher. The retesting phase has also been completed, confirming the breakout's validity and strengthening the bullish outlook. Traders often wait for retests as confirmation to enter trades with reduced risk. The target price aligns with the expected upward momentum post-breakout. With the breakout confirmed, buyers might find this setup attractive. Price action and momentum indicators should be monitored for sustained movement toward the target. Risk management is crucial, given forex volatility.
