BTC - Short Setup at 0.702 Fibonacci & Fair Value GapMarket Context
Bitcoin recently rejected from a major resistance area and has since been retracing downward, finding temporary support inside a bullish Fair Value Gap. The market is currently in a corrective phase, with buyers attempting to defend lower levels while sellers look for optimal positions to reload shorts. This environment shows a classic tug-of-war between these two forces as price moves between supply and demand zones.
Consolidation and Current Phase
Although the prior consolidation has been broken, the current price action can still be described as corrective, with intraday structure forming lower highs. The bullish Fair Value Gap beneath price has been respected so far, creating a temporary base. However, the path remains complex, as the market has unfilled imbalances both above and below.
Bearish Retest Scenario
One key scenario involves a retracement toward the bearish Fair Value Gap near 117K, which also aligns with the 0.702 Fibonacci retracement level. This confluence makes it a high-probability area for sellers to step in again. A rejection from that zone would likely resume the downtrend, with the next logical target being the deeper unfilled bullish Fair Value Gap around 110K. This zone acts as a magnet for price due to the inefficiency left behind during the last rally.
Bullish Defense Scenario
For bulls to regain control, the current Fair Value Gap at 114K must hold, followed by a strong move that invalidates the lower-high structure. Such a move would need to break above the 117K bearish FVG with conviction. Only then could momentum shift back to the upside, opening the door for another challenge of the higher resistance zones.
Final Words
Patience and precision are key when dealing with setups like this. Let the market come to your level — and react with intent.
If you found this breakdown helpful, a like is much appreciated! Let me know in the comments what you think or if you’re watching the same zones.
Harmonic Patterns

XAUUSDHello Traders! 👋
What are your thoughts on GOLD?
Gold saw a strong rally on Friday following the U.S. Non-Farm Payrolls (NFP) report and is now trading near a key resistance zone.
At this resistance, a short-term pullback is likely as traders lock in profits.
We expect the correction to be contained within key support levels, and if price holds in that zone, the uptrend is likely to resume, targeting new highs.
Will gold resume its rally after the correction? Share your view below! 👇
Don’t forget to like and share your thoughts in the comments! ❤️

GBPUSD – Bearish Bounce Loading?Hello TradingView Family / Fellow Traders. This is Richard, also known as theSignalyst.
📈GBPUSD has been overall bearish trading within the falling channel marked in red and it is currently in a correction phase.
Moreover, the blue zone is a strong supply.
📚 As per my trading style:
As #GBPUSD approaches the red circle zone, I will be looking for bearish reversal setups (like a double top pattern, trendline break , and so on...)
📚 Always follow your trading plan regarding entry, risk management, and trade management.
Good luck!
All Strategies Are Good; If Managed Properly!
~Rich
Disclosure: I am part of Trade Nation's Influencer program and receive a monthly fee for using their TradingView charts in my analysis.

Ethereum - Finally new all time highs!🔬Ethereum ( CRYPTO:ETHUSD ) will break out now:
🔎Analysis summary:
For more than four years, Ethereum has overall been moving sideways. However now Ethereum is once again retesting previous all time highs and preparing a bullish breakout. Multiple retests are generally considered bullish so the breakout is very likely to happen any time soon.
📝Levels to watch:
$4.000
🙏🏻#LONGTERMVISION
SwingTraderPhil

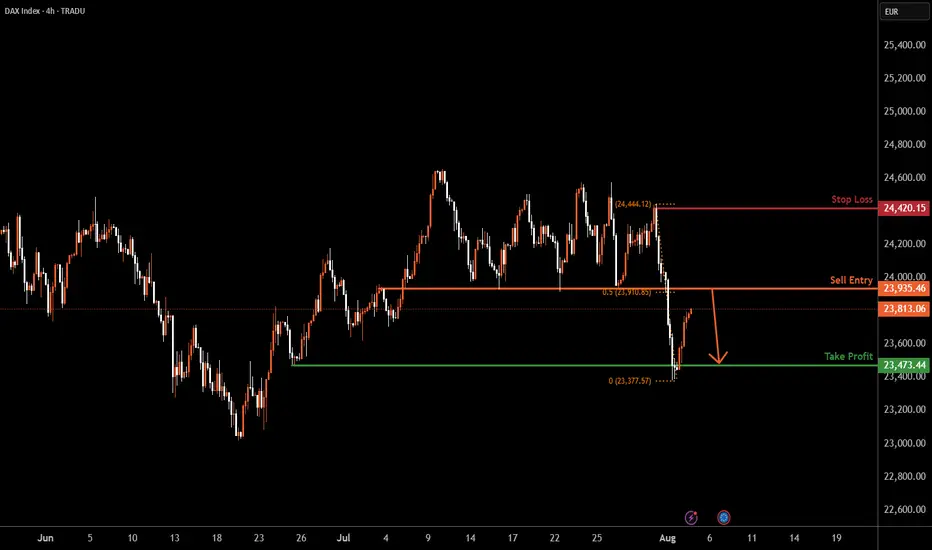
GER30 H4 | Bearish reversal off pullback resistanceBased on the H4 chart analysis, we can see that the price rises towards the sell entry, which acts as a pullback resistance that lines up with the 50% Fibonacci retracement and could potentially reverse to the downside from this level.
Sell entry is at 23,935.46, which is a pullback resistance that aligns with the 50% Fibonacci retracement.
Stop loss is at 24,420.15, which is a swing high resistance.
Take profit is at 23,473.44, which is a multi-swing low support.
High Risk Investment Warning
Trading Forex/CFDs on margin carries a high level of risk and may not be suitable for all investors. Leverage can work against you.
Stratos Markets Limited (tradu.com ):
CFDs are complex instruments and come with a high risk of losing money rapidly due to leverage. 65% of retail investor accounts lose money when trading CFDs with this provider. You should consider whether you understand how CFDs work and whether you can afford to take the high risk of losing your money.
Stratos Europe Ltd (tradu.com ):
CFDs are complex instruments and come with a high risk of losing money rapidly due to leverage. 66% of retail investor accounts lose money when trading CFDs with this provider. You should consider whether you understand how CFDs work and whether you can afford to take the high risk of losing your money.
Stratos Global LLC (tradu.com ):
Losses can exceed deposits.
Please be advised that the information presented on TradingView is provided to Tradu (‘Company’, ‘we’) by a third-party provider (‘TFA Global Pte Ltd’). Please be reminded that you are solely responsible for the trading decisions on your account. There is a very high degree of risk involved in trading. Any information and/or content is intended entirely for research, educational and informational purposes only and does not constitute investment or consultation advice or investment strategy. The information is not tailored to the investment needs of any specific person and therefore does not involve a consideration of any of the investment objectives, financial situation or needs of any viewer that may receive it. Kindly also note that past performance is not a reliable indicator of future results. Actual results may differ materially from those anticipated in forward-looking or past performance statements. We assume no liability as to the accuracy or completeness of any of the information and/or content provided herein and the Company cannot be held responsible for any omission, mistake nor for any loss or damage including without limitation to any loss of profit which may arise from reliance on any information supplied by TFA Global Pte Ltd.
The speaker(s) is neither an employee, agent nor representative of Tradu and is therefore acting independently. The opinions given are their own, constitute general market commentary, and do not constitute the opinion or advice of Tradu or any form of personal or investment advice. Tradu neither endorses nor guarantees offerings of third-party speakers, nor is Tradu responsible for the content, veracity or opinions of third-party speakers, presenters or participants.
BTC - About to TankBitcoin is holding below these bearish trendlines pointed out on previous posts.
Here we can see liquidation levels on the HTF.
I see two potential moves:
Scenario A)
115,000 to 17,000-20,000 range
Scenario B)
3 Wave Corrective Pattern
115,000 to 35,000
35,000 to 83,000
83,000 to 8,000-10,000
DXY is retesting a major bearish breakdown on the weekly / monthly time frame. This is why we have been seeing the recent drop, and preparation for a mass liquidation / flash crash.
The above stated is my own personal views and is not intended as financial advice. Please trade responsibly.

Ethereum (ETH/USDT) – Bearish Channel Structure Developing
⸻
🔍 Technical Overview
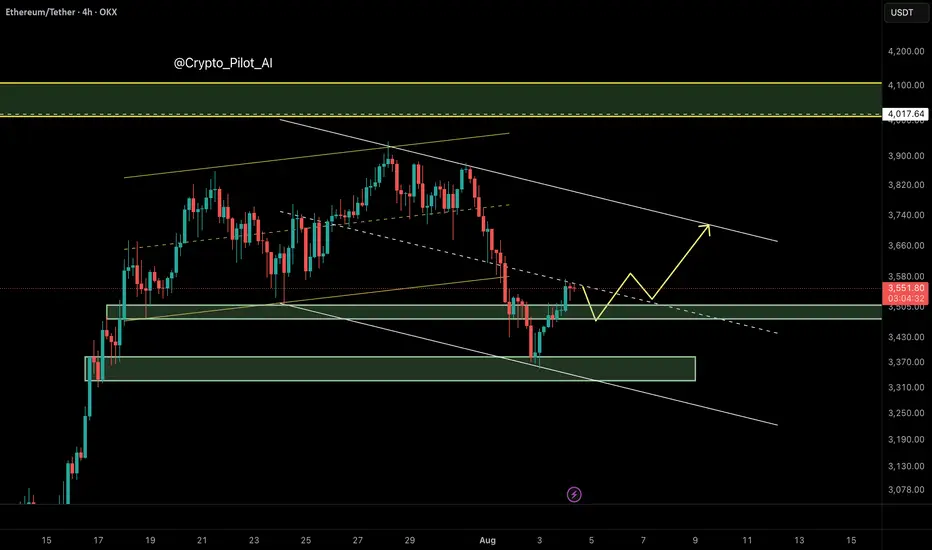
Ethereum has broken down from its ascending channel, invalidating the earlier bullish projection toward $4,000. After failing to hold the channel midline around $3,577, price dropped sharply to $3,360, forming a new bearish descending channel.
Currently, ETH is trading near the midline of this bearish channel, which typically acts as a decision point — not a buying zone — in smart money models.
⸻
🧠 NEoWave Interpretation
We may be inside a Complex Corrective Wave, possibly a Running or Contracting Flat evolving after the March top. The current structure resembles a B-wave trap, where price fakes out the upside before shifting momentum sharply downward. The break below the ascending channel midline confirms this bearish shift.
⸻
📊 Smart Money Summary
• 🟥 BOS confirmed on 1H and 4H (lower highs and lower lows)
• 🔻 Midline failure acted as a smart money trap, followed by a liquidity sweep below $3,490
• 📦 Bullish Order Block around $3,490–$3,520 has been tapped, prompting a minor reaction
• 🟡 Current resistance sits near the channel top ~ $3,715
⸻
🎯 Trade Scenarios
📌 Bearish Continuation:
If price fails to reclaim above $3,715, a retest and rejection from the channel top could trigger continuation toward $3,300–$3,250.
📌 Bullish Reversal (less likely for now):
Only a clean break and hold above $3,720 would suggest that bulls are regaining control, opening path toward $3,900–$4,000 — though this scenario is weakened after structural damage.
⸻
⚠️ Trader Tip:
Avoid buying into midline reactions in weak channels. Better long setups form after stop-hunts, ideally near bullish OBs + internal BOS confirmations.
⸻
✅ Conclusion
Ethereum remains under bearish pressure after losing its ascending structure. Unless price reclaims the $3,715 resistance zone with momentum, downside continuation remains likely.
⸻
📌 Save this analysis
💬 Share your thoughts or alt wave counts in the comments.
BTC – Bullish Breakout in SightBTC – Bullish Breakout in Sight
Bitcoin recently completed a bullish harmonic pattern near 112K, and the reaction was strong—showing that buyers stepped in around that level.
In just two days, BTC climbed by about 3.5%, reaching 115.7K—and it did so with relatively low trading volume, which highlights quiet but steady buying interest.
Right now, price is pausing between 113.7K and 115.7K, forming a possible accumulation zone.
If momentum picks up again, BTC could launch another bullish move toward:
🔹 116.8K
🔹 119K
You may find more details in the chart!
Thank you and Good Luck!
PS: Please support with a like or comment if you find this analysis useful for your trading day

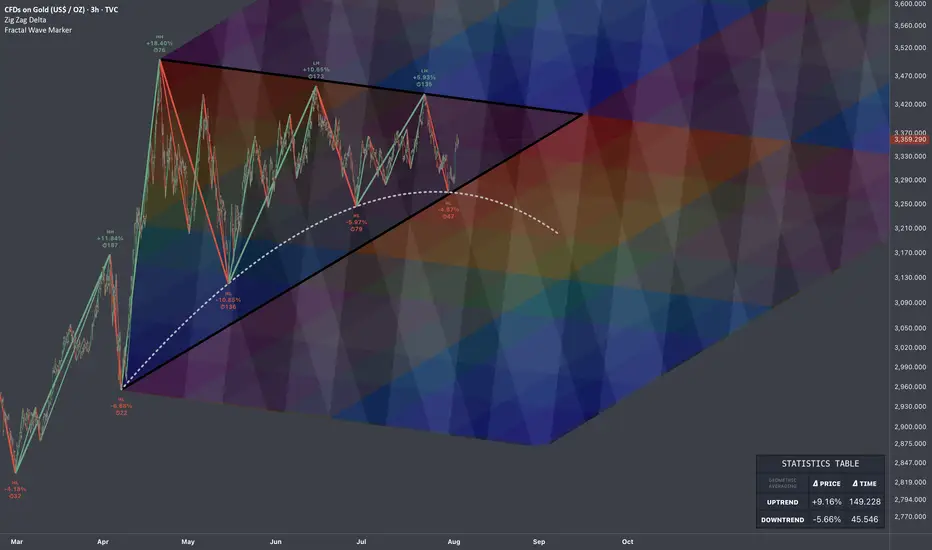
$GOLD: Projections of Compression & Release 🏛️ Research Notes
Price is at fib boundary derived from its structure that covers growth patterns. Several attempts were taken place to push higher and ended up as lower highs.
Contraction of fractal cycles and amplitude.
Topologically, the compression to a point of proportional release in fibonacci proportions and scaling law 1:1 to original triangle would look like a cube. And let's limit for now with that horizon.
Probabilistic Filter - Another layer of fibonacci channels to inherit roughness of observed temporal pattern which then rhymes with extended series.
The longer the price fluctuates in these geometric boundaries, the more accurate the colors tend to reflect the outcome.
For measuring percentages of swings I used this modification of Zig Zag.
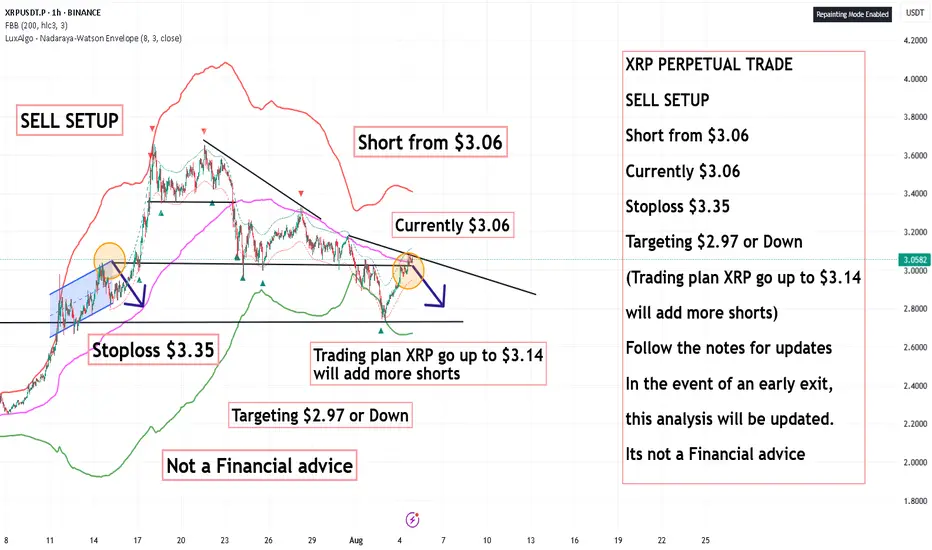
XRP PERPETUAL SELL SETUP ,Short from $3.06XRP PERPETUAL TRADE
SELL SETUP
Short from $3.06
Currently $3.06
Stoploss $3.35
Targeting $2.97 or Down
(Trading plan XRP go up to $3.14
will add more shorts)
Follow the notes for updates
In the event of an early exit,
this analysis will be updated.
Its not a Financial advice
Bitcoin (BTC): Either $108K or Back Above $117KBTC is in a volatile position, where purely on a chart we can't really tell whether we might be heading up or down from here.
What we noticed, though, is the order books orders near lower zones, where buyers have set few buys, possibly hinting to potential bullish movement to happen.
So what to keep in mind here?
1) Keep an eye on that bearish CME gap, which might be filled and marked as smaller target for short
2) Before we see either a breakout from the 117K area or a breakdown from the $108K zone, we should not enter into any early trades here on the current timeframe.
Swallow Academy

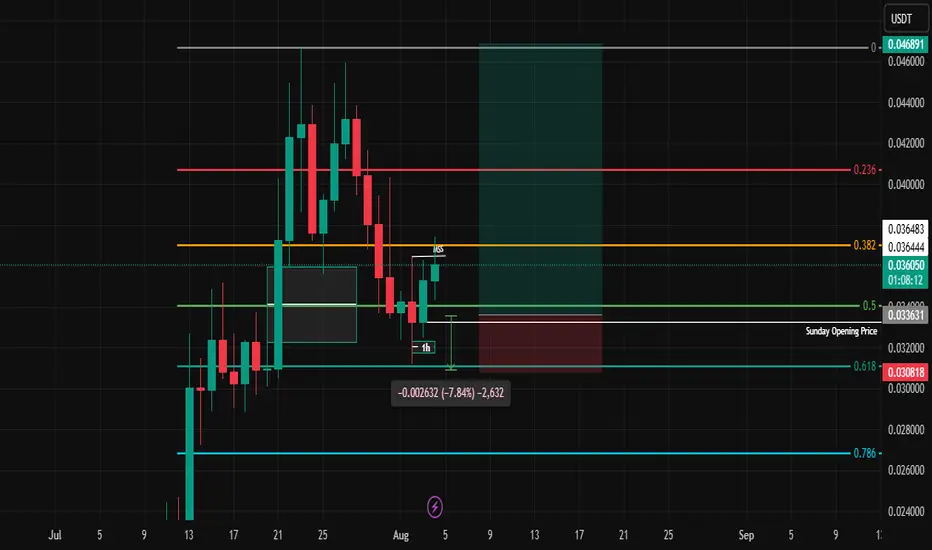
FET on Fire: Volume-Backed V-Pattern Breakout in 4H Structure💀 Hey , how's it going ? Come over here — Satoshi got something for you !
⏰ We’re analyzing FET on the 4-hour timeframe .
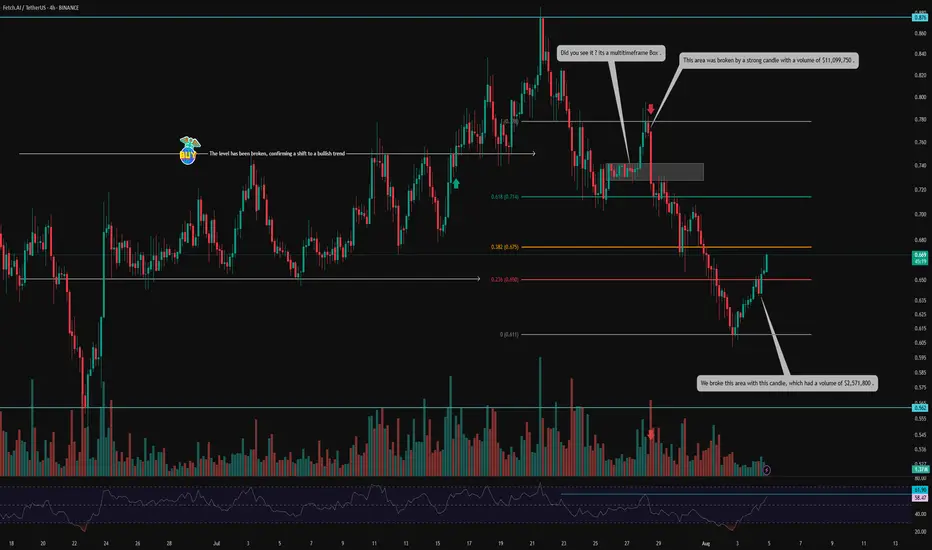
👀 After breaking out of its range around $0.75, FET experienced a solid upward move , reaching $0.876 . However , it was rejected from that level and faced heavy selling pressure , eventually forming a consolidation box on the multi-timeframe .
The break of this box, accompanied by rising volume and a total market structure break , led to a move toward the $0.778 resistance , where the price dropped again — this time with significant sell volume .
🎮 The Fibonacci levels in this chart are drawn based on volume-based market activity — specifically from the candle where the sell-off began to the candle where selling pressure ended and a reversal candle formed .
It may sound a bit technical , but the 0.236 Fib level acted as a key V-pattern resistance , which was beautifully broken with a strong $2,571,800 volume, and the candle closed above it .
Following that , traders showed reactions to this level , and the liquidity absorption can be seen in the form of wicks .
🔑 The next important zone is the 0.382 Fibonacci level at $0.675, where we see two possible scenarios :
Reaction and pullback , followed by a breakout .
Breakout first , then a pullback .
You can also place a buy stop at this level — just make sure to use a wider stop-loss .
⚙️ The structure is looking relatively good . The 61.9 RSI region could cause some noise in lower timeframes , but the key area is RSI 70 , which is the entrance to the Overbought zone .
🔼 Volume has been decent , especially considering today is Saturday and a weekend session . This adds more confirmation to the breakout of the V-pattern and the potential end of the correction .
🖥 Summary :
FET is one of those coins with strong recovery potential , operating in the AI sector . It tends to respect classic price action patterns , and with well-drawn Fibonacci levels , volume confirmation , and RSI moving into Overbought , it often activates buy-stop positions cleanly .
💡 Disclaimer :!!! .
BTC/USD - KEY SUPPORT BREAKOUT IN FOCUS!Bitcoin is currently trading near a critical support level, and price action is setting up for a decisive move.
📉 Bearish Scenario (Primary Bias):
Key support at ~$117,800 has broken, signaling a shift in market sentiment.
If the breakdown holds, we could see a strong bearish continuation toward the demand zone around $111,000.
Price may retest the broken support before the next leg down.
📈 Bullish Scenario (Alternate):
If buyers regain control and reclaim the broken support, BTC could retest the strong high at $120,700, and possibly push toward the supply zone near $123,000.
🔎 Structure Highlights:
Supply Zone: $122,000 – $123,000
Demand Zone: $110,000 – $111,500
Key Resistance/Support: $117,800
Strong High: ~$120,700
📌 Watch Closely:
Price behavior on the retest of the broken support
Bearish confirmation for downside continuation
Bullish reclaim for short-term recovery
A decisive move is near – be ready for both scenarios with tight risk management!

Could the price bounce from here?EUR/CAD has bounced off the pivot which is a pullback support, and could rise to the 1st resistanc,e which is a multi-swing high.
Pivot: 1.58922
1st Support: 1.57671
1st Resistance: 1.61066
Risk Warning:
Trading Forex and CFDs carries a high level of risk to your capital and you should only trade with money you can afford to lose. Trading Forex and CFDs may not be suitable for all investors, so please ensure that you fully understand the risks involved and seek independent advice if necessary.
Disclaimer:
The above opinions given constitute general market commentary, and do not constitute the opinion or advice of IC Markets or any form of personal or investment advice.
Any opinions, news, research, analyses, prices, other information, or links to third-party sites contained on this website are provided on an "as-is" basis, are intended only to be informative, is not an advice nor a recommendation, nor research, or a record of our trading prices, or an offer of, or solicitation for a transaction in any financial instrument and thus should not be treated as such. The information provided does not involve any specific investment objectives, financial situation and needs of any specific person who may receive it. Please be aware, that past performance is not a reliable indicator of future performance and/or results. Past Performance or Forward-looking scenarios based upon the reasonable beliefs of the third-party provider are not a guarantee of future performance. Actual results may differ materially from those anticipated in forward-looking or past performance statements. IC Markets makes no representation or warranty and assumes no liability as to the accuracy or completeness of the information provided, nor any loss arising from any investment based on a recommendation, forecast or any information supplied by any third-party.

XAUUSD breaks out – bullish bias returnsGold has bounced from the bottom of the descending channel, initiating a clear upward move with a series of strong bullish candles. On the H2 chart, price has broken above the upper boundary of the medium-term downtrend channel and filled the nearest fair value gap, signaling a resurgence in buying pressure.
Current price action is approaching a previous resistance zone, aligned with recent swing highs. The chart suggests a potential consolidation before further upside, provided that the current bullish structure remains intact.
From a macro perspective, while the stronger-than-expected U.S. PMI data supports the USD in the short term, weak labor market figures and ongoing global geopolitical tensions continue to fuel demand for gold as a safe-haven asset. This environment is helping sustain XAUUSD’s current recovery structure.

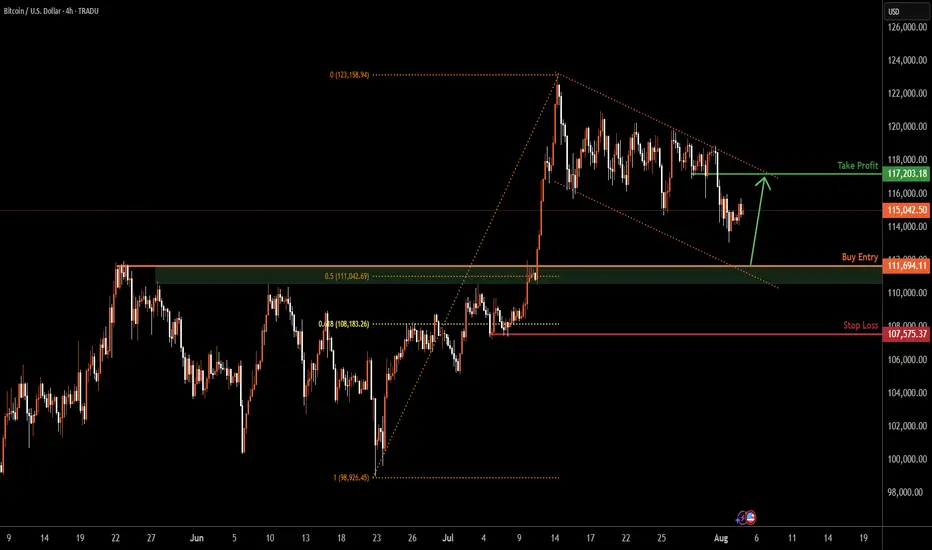
BITCOIN H4 | Bullish bounce offBTC/USD is falling towards the buy entry, which is a pullback support that is slightly above the 50% Fibonacci retracement and could bounce from this level to our take profit.
Buy entry is at 111,694.11, which is a pullback support that is slightly above the 50% Fibonacci retracement.
Stop loss is at 107,575.37, which is a pullback support that is slightly below the 61.8% Fibonacci retracement.
Take profit is at 117,203.18, which is a pullback resistance.
High Risk Investment Warning
Trading Forex/CFDs on margin carries a high level of risk and may not be suitable for all investors. Leverage can work against you.
Stratos Markets Limited (tradu.com ):
CFDs are complex instruments and come with a high risk of losing money rapidly due to leverage. 65% of retail investor accounts lose money when trading CFDs with this provider. You should consider whether you understand how CFDs work and whether you can afford to take the high risk of losing your money.
Stratos Europe Ltd (tradu.com ):
CFDs are complex instruments and come with a high risk of losing money rapidly due to leverage. 66% of retail investor accounts lose money when trading CFDs with this provider. You should consider whether you understand how CFDs work and whether you can afford to take the high risk of losing your money.
Stratos Global LLC (tradu.com ):
Losses can exceed deposits.
Please be advised that the information presented on TradingView is provided to Tradu (‘Company’, ‘we’) by a third-party provider (‘TFA Global Pte Ltd’). Please be reminded that you are solely responsible for the trading decisions on your account. There is a very high degree of risk involved in trading. Any information and/or content is intended entirely for research, educational and informational purposes only and does not constitute investment or consultation advice or investment strategy. The information is not tailored to the investment needs of any specific person and therefore does not involve a consideration of any of the investment objectives, financial situation or needs of any viewer that may receive it. Kindly also note that past performance is not a reliable indicator of future results. Actual results may differ materially from those anticipated in forward-looking or past performance statements. We assume no liability as to the accuracy or completeness of any of the information and/or content provided herein and the Company cannot be held responsible for any omission, mistake nor for any loss or damage including without limitation to any loss of profit which may arise from reliance on any information supplied by TFA Global Pte Ltd.
The speaker(s) is neither an employee, agent nor representative of Tradu and is therefore acting independently. The opinions given are their own, constitute general market commentary, and do not constitute the opinion or advice of Tradu or any form of personal or investment advice. Tradu neither endorses nor guarantees offerings of third-party speakers, nor is Tradu responsible for the content, veracity or opinions of third-party speakers, presenters or participants.
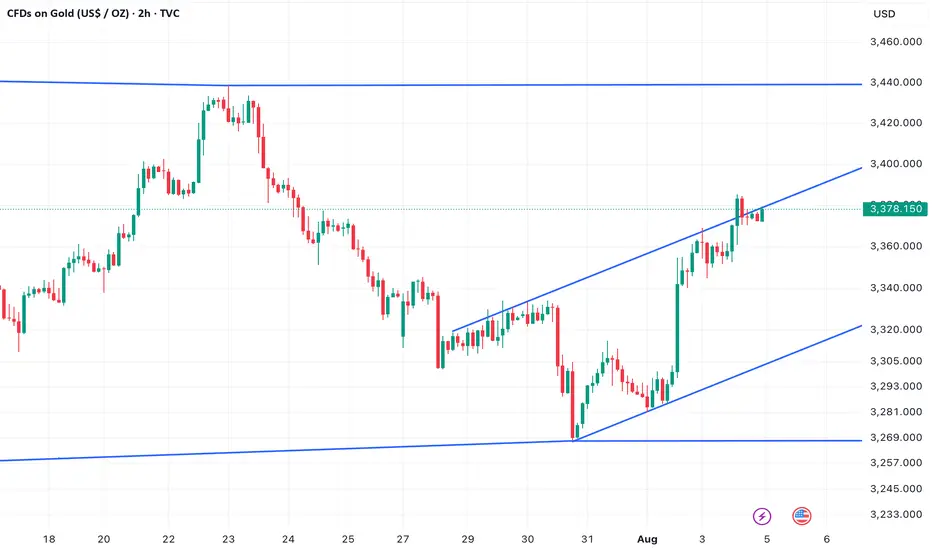
Gold in ascending channelAfter last week's steep and violent drop from $3,439 USD post Fed, Gold has found new momentum thanks to weaker than expected non-farm payroll numbers. But the price has been capped inside an ascending channel. This doesn't look particularly convincing to me for a strong reversel and bull case in the short term unless we manage to break out of the channel soon. If we fail to break the $3,439 USD high pre- Fed meeting I expect a test of the lower bound of the channel and a potential break below that.
A break below the channel opens up the way to the low at $3,267 USD.
EUR/NZD - Triangle Breakdown In PlayThe EUR/NZD pair has formed a classic Triangle Pattern on the 1H timeframe, indicating a period of consolidation before a potential breakout.
🔎 Key Technical Insights:
Price is compressing within the triangle, showing lower highs and higher lows.
Bearish bias is anticipated as price approaches the apex, suggesting a potential breakout to the downside.
Break below the triangle support opens the door for a move toward the target zone near 1.9425.
Resistance remains firm at 1.9619, capping bullish attempts.
🎯 Target Point: 1.9425
This aligns with previous structure and projected move size from the triangle’s base.
📌 Watch For:
Clear bearish breakout candle below triangle
Volume confirmation or follow-through momentum
This setup offers a solid opportunity for traders watching for continuation patterns and breakout plays.

ETC 4H Analysis : V-Pattern Breakout , $23M Buy & Key Fib LevelsHey , how's it going? Come over here — Satoshi's got something for you !
⏱ We are analyzing Ethereum Classic (ETC) on the 4-hour timeframe .
👀 After breaking above the $19.1 level, Ethereum Classic started a strong and high-momentum bullish move and reached the $25.28 resistance, where it was rejected and entered a deep correction .
A V-pattern support has now formed, and a breakout of this pattern could serve as a signal for the end of the correction .
🎮 We're observing the key Fibonacci zones , drawn from the breakout level and its pullback area .
The 0 level is considered our support base , while the other Fibonacci levels act as resistances and potential long-entry triggers .
The most important upcoming resistance is at $21.16 , which serves as the main trigger for our long position .
We will now monitor whether ETC forms a higher low before reaching this resistance , or reacts to it and then forms a higher low — both scenarios would be valid setups for a long position .
As for the 0.236 Fibonacci level , it's the nearest support, and a pullback to this zone is also possible .
⚙️ The RSI oscillator previously had a key resistance at 57.78 , which has now been broken to the upside , and RSI is currently holding above this level .
🔼 Volume may increase again tomorrow during the New York session .
Today, in the marked candle , $23 million worth of Ethereum Classic was bought , and this market maker buy helped save ETC from a deeper correction .
🖥 Summary :
The breakout of the V-pattern allowed ETC to push upward and form a higher low .
Once the pullback to the identified Fibonacci zone completes , we can open our long position , or alternatively , set a buy stop at that level with a wider stop-loss to manage risk properly .
💡 Disclaimer :))) .

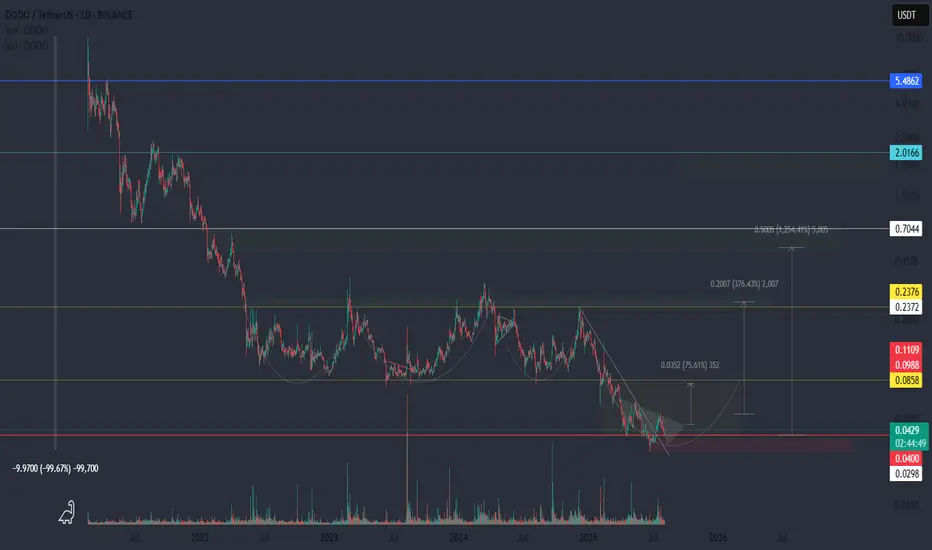
High-Risk Crypto Bet – DODO AnalysisDODO is a decentralized finance (#DeFi) protocol that has seen a brutal 99% drawdown from its peak — making it one of the most devalued tokens in the market.
📉 Structure:
The chart shows a “channel within a channel” structure — a signal of prolonged capitulation. DODO is currently in a range where most have written it off. But history shows that such zones often precede major reversals.
🌀 Formation:
A potential inverse head and shoulders pattern is developing — a classic reversal setup. The minimal target from this structure is around $0.08.
📈 Early Signal:
Price has already bounced +75% from the bottom — a possible sign of early accumulation.
☕ Bigger Picture:
This zone might be forming the right side of a long-term cup pattern — hinting at a potential macro reversal if the market supports.
BITCOIN TRADING IS 100% PROBABILITY,ANY KEY LEVEL IN THIS CHART CAN FAIL,pls manage your risk and build a strong mindset.
bitcoin is showing a bullish drive. If i retest the 123k level again and gets rejected we are selling down ,the structure has given us a clue on 135k and above possible upswing on sentiment ,this level represents the ascending trendline and a supply roof.
#btc #bitcoin #crypto #eth #sol

LongPengu broke a swing on the daily at equilibrium.
I am interested in a long position if it retraces back to OTE.
We remain bullish on gold prices today—3400+.We remain bullish on gold prices today—3400+.
As shown in Figure 4h, gold prices are actively breaking through.
Currently, the upper resistance level for gold is 3385-3390.
Going long at low prices is a good strategy.
We exited yesterday at 3380 and entered today around 3350-3360, achieving very stable profits.
Current support level for gold: 3350-3360.
Gold prices have now resumed their upward trend, indicating that bullish sentiment has returned to the primary upward trend.
Bullish sentiment will continue to strengthen.
Our target price for gold remains above 3400.
Day Trading Strategy:
1: Swing Strategy: 3350-3385 (Buy Low, Sell High)
2: Low-Price Long Strategy
Buy: 3350-3360-3370
Stop Loss: 3345
Target: 3380-3400
3: High-Price Short Strategy: (Caution is advised when trading short positions; avoid short positions)
