Will Gold Break Out on Tariff and Fed UncertaintyGold’s price action is currently fluctuating above the trendline connecting higher lows from May 2025, potentially aiming for the trendline from December 2024, which aligns with the 2025 peak at 3,500.
A firm hold above the 3,400 and 3,450 levels could accelerate a move back toward the 3,500-record, with potential for further gains toward new highs at 3,780 and 4,000, respectively.
On the downside, a close below 3,340 may lead to a pullback to 3,280 for a possible rebound, or even a deeper retracement toward 3,230 and 3,130.
Harmonic Patterns

ETH Don’t Miss Out!!!
**🚀 ETH WEEKLY TRADE IDEA — \$4K BREAKOUT WATCH**
📈 **Market Bias:** Bullish (Long-term uptrend intact, ETH above key MAs)
⚠ **Short-Term Risk:** MACD bearish crossover + RSI overbought → possible pullback before breakout
📊 **Key Level:** Testing **\$4,000** psychological resistance
**🛠 Setup:**
* **Direction:** LONG
* **Entry:** \$3,966.12
* **Stop Loss:** \$3,900 (below key support)
* **Take Profit:** \$4,050 (first target)
* **Size:** 0.5 (volatility-adjusted)
* **Confidence:** 75%
* **Entry Timing:** Market open
📌 **Why Long?**
* Strong uptrend + above key moving averages
* Positive funding rates and recent momentum support bullish case
* Risk-reward favorable for a potential \$4K+ breakout
💡 *Watch for volume confirmation — failure to break \$4K with strong buy-side pressure could trigger a pullback to \$3,900.*
---
**#ETH #Ethereum #Crypto #Cryptocurrency #CryptoTrading #ETHUSD #Altcoins #Bitcoin #BTC #CryptoSignals #CryptoSetup #TechnicalAnalysis #SwingTrade #DayTrade #PriceAction #BreakoutTrading #CryptoMarket #CryptoInvesting #MACD #RSI #TradingStrategy #BullishSetup #SupportAndResistance #VolumeAnalysis**

LLY Is Overbought ---$615 Put Play**💊 LLY WEEKLY TRADE IDEA — BEARISH PRESSURE BUILDING**
📉 **Sentiment:** Strong bearish lean (70% confidence) — low RSI, high volume distribution.
📊 **Institutional Flow:** 1.7x weekly volume, puts stacking near key strikes.
⚠ **Risk:** Gamma risk + oversold → expect high volatility.
**🛠 Setup:**
* **Direction:** PUT (Short bias)
* **Strike:** \$615
* **Expiry:** 2025-08-15
* **Entry:** \$2.20 – \$2.40
* **PT:** \$3.30 (50-100% gain target)
* **SL:** \$1.20 (\~40-50% loss cap)
📌 **Why?**
* Daily RSI \~20, Weekly RSI \~33 → both falling
* Institutional selling pattern confirmed
* Bearish volume + neutral C/P ratio tilt
💡 *Timing is key — oversold = possible dead-cat bounce before breakdown to \$605 support.*

EUR/USD REVERSES AFTER BREAK BELOW SUPPORT MORE UPSIDE AHEAD? Hey Traders so today looking at EUR/USD just last week it had looked like it was topping with the 123 top formation on the daily chart.
However always keep in mind that technical analysis works but only when fundamentals line up with it. Therefore if something Fundamentally changes that is big it will completely alter the technical setup. For those new to trading always be aware of Fundamentals that are happening in the market. I am a technical trader but still want to be aware of those reports because these markets can change on a dime!
The last few weeks the Fundamentals for the US dollar were bullish. But last friday the market made a complete 360 when the Unemployment Report came in way lower than expected. Does this mean the Euro Top is over?
No one knows for sure so therefore the scenarios are:
If Bullish- Consider buying the dip back to support at 1.554 consider stop under support at 1.1365 If the FED cuts interest rates that would most likely catapult the Euro fast above 1.833 and the bulls we be happy campers. 😁
If Bearish- If you sold the rally consider reducing risk now that it moved higher. Normally the way you trade the 123 top is sell below the 2 point and put a stop above the 3 point or the 1 point. If the FED holds back on the interest rate Cut that could catapult Euro lower and fast. However this is probably unlikely unless we get strong data before next FED meeting.
COT (Commitment of Traders)- Shows Bearish
The Funds are still long at this point but getting a little crowded on the long side. Normally if they get too long they might get squeezed out of the long positions back to nuetral which could mean buyers are forced to become sellers.
Good Luck & Always use Risk Management!
(Just in we are wrong in our analysis most experts recommend never to risk more than 2% of your account equity on any given trade.)
Hope This Helps Your Trading 😃
Clifford
RISK DISCLOSURE
TRADING IN THE FUTURES AND FOREX MARKET INVOLVES SIGNIFICANT RISK. ALWAYS CONSULT A FINANCIAL ADVISOR AS HIGH RISK ASSET CLASSES MAY NOT BE SUITABLE FOR ALL INVESTORS. THIS IS NOT A RECOMMENDATION TO BUY OR SELL ANY ASSETS. ALL IDEAS ARE MADE FOR EDUCATIONAL PURPOSES. PAST PERFORMANCE DOES NOT GUARANTEE FUTURE RESULTS.
CFTC RULE 4.41 – HYPOTHETICAL OR SIMULATED PERFORMANCE RESULTS HAVE CERTAIN LIMITATIONS. UNLIKE AN ACTUAL PERFORMANCE RECORD, SIMULATED RESULTS DO NOT REPRESENT ACTUAL TRADING.

BTC 1H Analysis – Key Triggers Ahead | Day 5💀 Hey , how's it going ? Come over here — Satoshi got something for you !
⏰ We’re analyzing BTC on the 1-hour timeframe .
👀 After triggering its long signals, Bitcoin moved upward and hit the seller zone at 117,500, then reversed from that level.
🎮 A Fibonacci retracement has been drawn from $ 114,200 to $ 117,560. The price entered the zone between the 0.37 and 0.61 levels, and we need to see whether it reacts to 0.61 with selling pressure or pulls back to 0.37. Understanding market behavior in this area can guide us.
✏️ A curve line has been drawn from the first touch of the maker-buyer zone to the first touch of the maker-seller zone. This line intersects well with the 0.37 Fibonacci level, which has now been broken in current conditions.
🔽 With the increase in short positions and selling volume for Bitcoin, the price experienced a decline and correction. If selling pressure continues, Bitcoin could start a short-term correction.
⚙️ Our RSI oscillator is below the 50 level, with a support zone at 41.22. If this zone is lost, market momentum will lean more towards selling and further correction.
💸 BTC.D , if it breaks 60.72 %, could drop to lower levels, making Bitcoin lighter relative to the market.
💵 USDT.D , if it breaks 4.28 %, could also drop to lower levels, reducing Tether’s share in the market and shifting more capital into Bitcoin and altcoins.
🖥 Summary: Bitcoin was rejected from the 117,560 level and, along with selling pressure, dropped below the 0.37 Fibonacci zone. There is a support level at $ 115,530 — as long as the price stays above this zone, Bitcoin can maintain its upward trend with short-term multi-timeframe corrections.
❤️ Disclaimer : This analysis is purely based on my personal opinion and I only trade if the stated triggers are activated .

Bitcoin on the Rise — But the Bat Hasn't Flown Yet
---
🚀 **!** 🦇
We're anticipating a continued bullish move in Bitcoin until it completes the **Bat Pattern** at the key level of **$118,469**. 📈
From there, we expect a reversal — a drop toward **$113,800**. 📉
Stay tuned, drop your thoughts below, and let’s decode the market together.
#Bitcoin #CryptoAnalysis #BatPattern #TechnicalAnalysis #LearnThenTrade
---

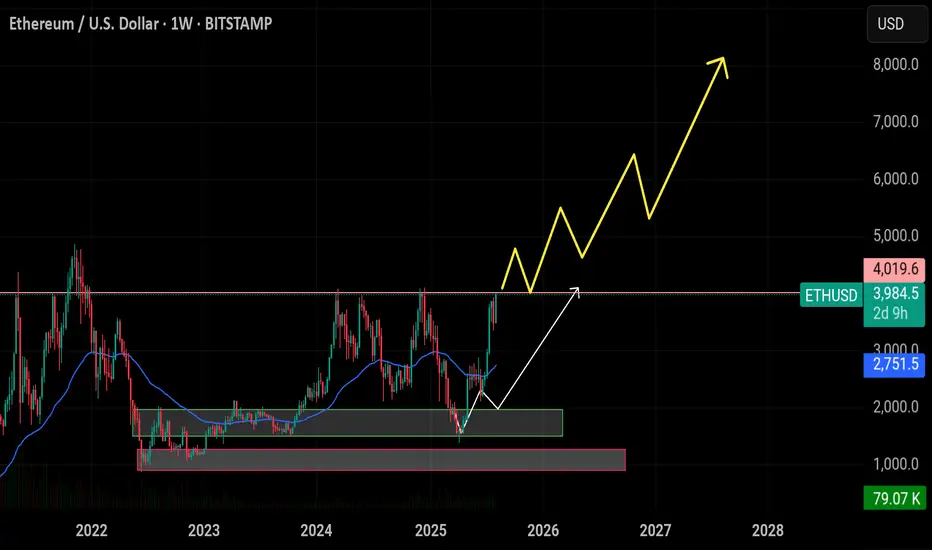
$ETH/USDT Breakout Analysis 1W Chart: Ethereum $ETH/USDT Breakout Analysis 1W Chart:
ETH has successfully reached the $4,000 breakout level, completing our first major target from the accumulation zone ($1,500–$1,900). Price is currently testing the critical $4,000 resistance. If ETH can close a weekly candle above this level and hold, it will confirm a strong continuation structure — potentially targeting $5,000, $7,000, and up to $8,000 in the coming months.
🔸 Support LEVEL: $3,500 is now the key weekly support zone. This level aligns with previous resistance and structure, offering a strong base for bullish continuation. If ETH holds $4,000+ weekly, $3,500 becomes a high-conviction re-entry zone.
🔸 Upside Target: Upon confirmation above $4,000, ETH could rally toward $5,000 short-term, with extended targets at $7,000 and $8,000 if momentum continues.
🔸 Risk Level at $3,500: A weekly close below $4,000 followed by a drop under $3,500 would invalidate the breakout. This could signal a failed breakout and return to range. High risk zone opens below $3,200.
🔸 Watch for Retest ZONE: Look for a healthy retest of the $3,900–$4,000 zone. If ETH pulls back and holds this zone on weekly, it offers a strong entry with targets toward $5,000 and above.
KOHc### 📌 Cup and Handle – Key Points (Precise)
* **Type**: Bullish continuation pattern
Cup**: Rounded U-shape, gradual down then up
Handle**: Short pullback/consolidation
Breakout**: Above cup’s resistance (rim)
Volume**: Low during cup, rises at breakout
Target**: Cup depth added to breakout point
Stop Loss**: Below handle low
Best Timeframe**: Daily or Weekly charts

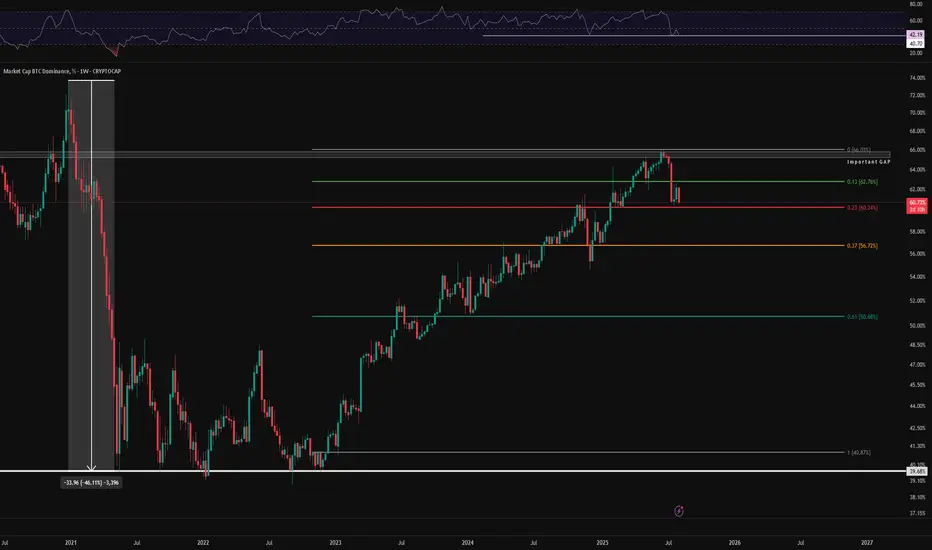
BTC.D Are We in bullrun ? | BTC.D on Fibonacci Level💀 Hey , how's it going ? Come over here — Satoshi got something for you !
⏰ We’re analyzing BTC.D on the 1-Week timeframe .
🔜 On the weekly timeframe of Bitcoin dominance, here’s what we observe :
👀 In the weekly Bitcoin dominance chart , we had a sharp 46% drop after the Bitcoin halving in 2021, which led to the altcoin party .
🎮 Today, for the first time , its figures were adjusted and turned into a custom Fibonacci , drawn on the chart as follows :
Our starting point in the Fibonacci is at the beginning of 2023 , from the breakout above 40.87 to the peak at 66.03, which, in terms of timing, coincides with the Bitcoin halving .
A strong rejection from the 0 Fibonacci level caused a move towards the 0.13 level . A strong whale candle broke below this level , followed by a pullback to it, and then we moved towards the 0.23 level. With a break below the 0.23 level and losing that low , we can say that our bull run has started .
⚙️ Our key RSI zone is drawn at 41.49 . On the first touch of this area , we bounced and moved towards the 50 level , but were then rejected from 50 and moved towards the current low . Once this low is broken , we can say the altcoin party has begun .
❤️ Disclaimer : This analysis is purely based on my personal opinion and I only trade if the stated triggers are activated .
//@version=6 indicator("TCP | Market Session | Session Analyzer"//@version=6
indicator("TCP | Market Session | Session Analyzer", overlay=true, max_labels_count=500)
// ───────────── 🕒 Minutes-to-Hours Helper Box
group_minutes = "🕒 Minutes to Hours Helper"
// Input: Minutes
convertMinutes = input.int(90, "🛠️ Convert Minutes", minval=0, tooltip="Helper to convert minutes into hours (HH:MM)")
// Conversion
convertedHours = convertMinutes / 60.0
convertedHH = math.floor(convertMinutes / 60)
convertedMM = convertMinutes % 60
convertedString = str.tostring(convertedHH, "00") + ":" + str.tostring(convertedMM, "00")
// ───────────── تنظیمات جلسات
group_sessions = "🌐 Session Settings (UTC - Minutes)"
asiaStartMin = input.int(0, "Asia Start Time (UTC, minutes)", group=group_sessions,
tooltip="Start of Asia session in minutes from midnight UTC. Example: 0 = 00:00 UTC")
asiaEndMin = input.int(480, "Asia End Time (UTC, minutes)", group=group_sessions,
tooltip="End of Asia session in minutes from midnight UTC. Example: 480 = 08:00 UTC")
euroStartMin = input.int(420, "Europe Start Time (UTC, minutes)", group=group_sessions,
tooltip="Start of Europe session in minutes from midnight UTC. Example: 420 = 07:00 UTC")
euroEndMin = input.int(960, "Europe End Time (UTC, minutes)", group=group_sessions,
tooltip="End of Europe session in minutes from midnight UTC. Example: 960 = 16:00 UTC")
usStartMin = input.int(780, "US Start Time (UTC, minutes)", group=group_sessions,
tooltip="Start of US session in minutes from midnight UTC. Example: 780 = 13:00 UTC")
usEndMin = input.int(1260, "US End Time (UTC, minutes)", group=group_sessions,
tooltip="End of US session in minutes from midnight UTC. Example: 1260 = 21:00 UTC")
// ───────────── سایر تنظیمات
maxPastDays = input.int(3, "Number of Past Days to Show Lines", minval=1, maxval=30)
futureDays = input.int(2, "Number of Future Days to Show Lines", minval=0, maxval=10)
labelYOffset = input.int(5, "Base Label Y Offset (ticks)", minval=1)
labelSpacing = input.int(20, "Label Spacing Between Types (ticks)", minval=0)
lookbackBars = input.int(20, "Lookback Bars for Max High", minval=1)
useLocalTimezone = input.bool(false, "Use Chart's Local Timezone")
showSessionLines = input.bool(true, "Show Vertical Session Lines")
// ───────────── تنظیمات نمایش
showAsiaSession = input.bool(true, "Show Asia Session")
showEuropeSession = input.bool(true, "Show Europe Session")
showUSSession = input.bool(true, "Show US Session")
showLiquidityGrab = input.bool(true, "Show Liquidity Grab Labels")
showCountdownTable = input.bool(true, "Show Countdown Table")
showSessionBoxes = input.bool(true, "Show Session Boxes")
// ───────────── رنگها
asiaColor = color.new(color.green, 0)
euroColor = color.new(color.orange, 0)
usColor = color.new(color.blue, 0)
asiaBoxColor = color.new(color.green, 85)
euroBoxColor = color.new(color.orange, 85)
usBoxColor = color.new(color.blue, 85)
// تابع تشخیص حضور کندل در سشن
tMin = useLocalTimezone ? (hour(time) * 60 + minute(time)) : (hour(time, "GMT+0") * 60 + minute(time, "GMT+0"))
inSession(startMin, endMin) =>
(tMin >= startMin and tMin < endMin)
// تابع تحلیل رفتار سشن
f_behavior(_high, _low, _open, _close) =>
volatility = ta.stdev(close, 14)
lowThreshold = volatility * 0.4
highThreshold = volatility * 0.8
rng = _high - _low
body = math.abs(_close - _open)
isTrend = body > rng * 0.4 and rng > highThreshold
isConsolidation = rng < lowThreshold
isManipulation = ((_high > _close and _low < _open) and body < rng * 0.4 and not isTrend)
behavior = isTrend ? (_close > _open ? "Trend Up" : "Trend Down") :
isConsolidation ? "Consolidation" :
isManipulation ? "Manipulation" : "Range"
behavior
// ───────────── شکار نقدینگی
lookbackLG = 12
highestPrev = ta.highest(high , lookbackLG)
lowestPrev = ta.lowest(low , lookbackLG)
useAtr = ta.atr(14)
avgVolume = ta.sma(volume, 20)
liqGrabUp = high > highestPrev and close < highestPrev
liqGrabDown = low < lowestPrev and close > lowestPrev
basicSignal = (liqGrabUp or liqGrabDown)
strengthFilter = (high - low > useAtr * 0.6) and (volume > avgVolume * 1.05)
confirmReversal = (liqGrabUp and close < open ) or (liqGrabDown and close > open )
liqGrabFinal = basicSignal and strengthFilter and confirmReversal
var int lastSignalBar = na
canPlotLabel = na(lastSignalBar) or (bar_index - lastSignalBar > 6)
if showLiquidityGrab and liqGrabFinal and canPlotLabel
label.new(bar_index, high, "Liquidity Grab", style=label.style_label_down, color=color.red, textcolor=color.white, size=size.tiny)
lastSignalBar := bar_index
// ───────────── تایمر پایان سشن
getSessionEndTime(endMin) =>
timestamp(year(time), month(time), dayofmonth(time), math.floor(endMin / 60), endMin % 60)
float timeLeftInSession = na
if (showAsiaSession and inSession(asiaStartMin, asiaEndMin)) or (showEuropeSession and inSession(euroStartMin, euroEndMin)) or (showUSSession and inSession(usStartMin, usEndMin))
timeLeftInSession := (getSessionEndTime(
inSession(asiaStartMin, asiaEndMin) ? asiaEndMin :
inSession(euroStartMin, euroEndMin) ? euroEndMin :
usEndMin) - time) / 60000
// ───────────── جدول شمارش معکوس
getMinutesUntilSession(startMin) =>
nextTime = timestamp(year(time), month(time), dayofmonth(time), math.floor(startMin / 60), startMin % 60)
nextTime < time ? (nextTime + 24 * 60 * 60 * 1000 - time) / 60000 : (nextTime - time) / 60000
currentSession = inSession(asiaStartMin, asiaEndMin) ? "Asia" :
inSession(euroStartMin, euroEndMin) ? "Europe" :
inSession(usStartMin, usEndMin) ? "US" : "None"
float nextAsia = getMinutesUntilSession(asiaStartMin)
float nextEuro = getMinutesUntilSession(euroStartMin)
float nextUS = getMinutesUntilSession(usStartMin)
nextSessionName = ""
nextSessionIn = 0.0
if nextAsia < nextEuro and nextAsia < nextUS
nextSessionName := "Asia"
nextSessionIn := nextAsia
else if nextEuro < nextUS
nextSessionName := "Europe"
nextSessionIn := nextEuro
else
nextSessionName := "US"
nextSessionIn := nextUS
var table countdownTable = table.new(position.top_right, 2, 5)
if showCountdownTable and barstate.islast
table.cell(countdownTable, 0, 0, "🕓 Current Session", text_color=color.white, bgcolor=color.new(color.black, 80))
table.cell(countdownTable, 1, 0, currentSession != "None" ? currentSession : "No Session", text_color=color.white, bgcolor=color.new(color.black, 60))
table.cell(countdownTable, 0, 1, "⏳ Time Left", text_color=color.white, bgcolor=color.new(color.black, 80))
table.cell(countdownTable, 1, 1, not na(timeLeftInSession) and currentSession != "None" ? str.tostring(math.max(timeLeftInSession, 0), "#.0") + " min" : "-", text_color=color.white, bgcolor=color.new(color.black, 60))
table.cell(countdownTable, 0, 2, "🔜 Next Session", text_color=color.white, bgcolor=color.new(color.black, 80))
table.cell(countdownTable, 1, 2, nextSessionName, text_color=color.white, bgcolor=color.new(color.black, 60))
table.cell(countdownTable, 0, 3, "⏱ Opens In", text_color=color.white, bgcolor=color.new(color.black, 80))
table.cell(countdownTable, 1, 3, str.tostring(math.round(nextSessionIn)) + " min", text_color=color.white, bgcolor=color.new(color.black, 60))
table.cell(countdownTable, 0, 4, text="Input: " + str.tostring(convertMinutes) , text_color=color.white, bgcolor=color.blue)
table.cell(countdownTable, 1, 4, text="Converted: " + str.tostring(convertedHours, "#.##") + "h (" + convertedString + ")", text_color=color.white, bgcolor=color.blue)
// ───────────── ذخیره دادههای سشن
var float asiaHigh = na
var float asiaLow = na
var float asiaOpen = na
var float asiaClose = na
var string asiaResult = "Pending"
var float euroHigh = na
var float euroLow = na
var float euroOpen = na
var float euroClose = na
var string euroResult = "Pending"
var float usHigh = na
var float usLow = na
var float usOpen = na
var float usClose = na
var string usResult = "Pending"
maxHigh = ta.highest(high, lookbackBars)
fallbackHigh = na(maxHigh) ? close : maxHigh
// ───────────── Box متغیرها
var box asiaBox = na
var box euroBox = na
var box usBox = na
// آسیا
if showAsiaSession
if inSession(asiaStartMin, asiaEndMin)
asiaHigh := na(asiaHigh) ? high : math.max(asiaHigh, high)
asiaLow := na(asiaLow) ? low : math.min(asiaLow, low)
asiaOpen := na(asiaOpen) ? open : asiaOpen
asiaClose := close
if showSessionBoxes
if na(asiaBox)
asiaBox := box.new(bar_index, high, bar_index, low, bgcolor=asiaBoxColor, border_color=color.new(color.green, 70))
else
box.set_right(asiaBox, bar_index)
box.set_top(asiaBox, math.max(box.get_top(asiaBox), high))
box.set_bottom(asiaBox, math.min(box.get_bottom(asiaBox), low))
else if inSession(asiaStartMin, asiaEndMin) and not inSession(asiaStartMin, asiaEndMin)
asiaResult := f_behavior(asiaHigh, asiaLow, asiaOpen, asiaClose)
asiaHigh := na
asiaLow := na
asiaOpen := na
asiaClose := na
asiaBox := na
// اروپا
if showEuropeSession
if inSession(euroStartMin, euroEndMin)
euroHigh := na(euroHigh) ? high : math.max(euroHigh, high)
euroLow := na(euroLow) ? low : math.min(euroLow, low)
euroOpen := na(euroOpen) ? open : euroOpen
euroClose := close
if showSessionBoxes
if na(euroBox)
euroBox := box.new(bar_index, high, bar_index, low, bgcolor=euroBoxColor, border_color=color.new(color.orange, 70))
else
box.set_right(euroBox, bar_index)
box.set_top(euroBox, math.max(box.get_top(euroBox), high))
box.set_bottom(euroBox, math.min(box.get_bottom(euroBox), low))
else if inSession(euroStartMin, euroEndMin) and not inSession(euroStartMin, euroEndMin)
euroResult := f_behavior(euroHigh, euroLow, euroOpen, euroClose)
euroHigh := na
euroLow := na
euroOpen := na
euroClose := na
euroBox := na
// آمریکا
if showUSSession
if inSession(usStartMin, usEndMin)
usHigh := na(usHigh) ? high : math.max(usHigh, high)
usLow := na(usLow) ? low : math.min(usLow, low)
usOpen := na(usOpen) ? open : usOpen
usClose := close
if showSessionBoxes
if na(usBox)
usBox := box.new(bar_index, high, bar_index, low, bgcolor=usBoxColor, border_color=color.new(color.blue, 70))
else
box.set_right(usBox, bar_index)
box.set_top(usBox, math.max(box.get_top(usBox), high))
box.set_bottom(usBox, math.min(box.get_bottom(usBox), low))
else if inSession(usStartMin, usEndMin) and not inSession(usStartMin, usEndMin)
usResult := f_behavior(usHigh, usLow, usOpen, usClose)
usHigh := na
usLow := na
usOpen := na
usClose := na
usBox := na
// زمان سشنها
getSessionTimestamp(sessionMin, dayOffset) =>
dayMs = 24 * 60 * 60 * 1000
baseDay = timestamp(year(time), month(time), dayofmonth(time), 0, 0)
baseDay + dayOffset * dayMs + sessionMin * 60 * 1000
drawVerticalLineEx(_time, _color, _label, _style, _transp) =>
if not na(_time)
line.new(x1 = _time, y1 = close * 1.2, x2 = _time, y2 = close * 0.8, xloc = xloc.bar_time, extend = extend.none, color = color.new(_color, _transp), width = 2, style = _style)
isSessionStart(startMin, endMin) =>
inSession(startMin, endMin) and not inSession(startMin, endMin)
isSessionEnd(startMin, endMin) =>
not inSession(startMin, endMin) and inSession(startMin, endMin)
// رسم خطوط
// رسم خطوط (تنظیم مستقل)
if showSessionLines
for dayOffset = -maxPastDays to futureDays
transp = dayOffset < 0 ? math.min(90, math.abs(dayOffset) * 10) : dayOffset == 0 ? 0 : 40
if showAsiaSession
drawVerticalLineEx(getSessionTimestamp(asiaStartMin, dayOffset), asiaColor, "Asia Session Start", line.style_dotted, transp)
drawVerticalLineEx(getSessionTimestamp(asiaEndMin, dayOffset), asiaColor, "Asia Session End", line.style_solid, transp)
if showEuropeSession
drawVerticalLineEx(getSessionTimestamp(euroStartMin, dayOffset), euroColor, "Europe Session Start", line.style_dotted, transp)
drawVerticalLineEx(getSessionTimestamp(euroEndMin, dayOffset), euroColor, "Europe Session End", line.style_solid, transp)
if showUSSession
drawVerticalLineEx(getSessionTimestamp(usStartMin, dayOffset), usColor, "US Session Start", line.style_dotted, transp)
drawVerticalLineEx(getSessionTimestamp(usEndMin, dayOffset), usColor, "US Session End", line.style_solid, transp)
// برچسبها
tick = syminfo.mintick
if showAsiaSession
if isSessionStart(asiaStartMin, asiaEndMin)
label.new(bar_index, fallbackHigh + tick * labelYOffset, "Asia Session Start", style=label.style_label_up, color=asiaColor, textcolor=color.white, size=size.normal)
if isSessionEnd(asiaStartMin, asiaEndMin)
label.new(bar_index, fallbackHigh + tick * (labelYOffset + labelSpacing), "Asia Session End: " + asiaResult, style=label.style_label_up, color=asiaColor, textcolor=color.white, size=size.normal)
if showEuropeSession
if isSessionStart(euroStartMin, euroEndMin)
label.new(bar_index, fallbackHigh + tick * (labelYOffset + 2 * labelSpacing), "Europe Session Start", style=label.style_label_up, color=euroColor, textcolor=color.white, size=size.normal)
if isSessionEnd(euroStartMin, euroEndMin)
label.new(bar_index, fallbackHigh + tick * (labelYOffset + 3 * labelSpacing), "Europe Session End: " + euroResult, style=label.style_label_up, color=euroColor, textcolor=color.white, size=size.normal)
if showUSSession
if isSessionStart(usStartMin, usEndMin)
label.new(bar_index, fallbackHigh + tick * (labelYOffset + 4 * labelSpacing), "US Session Start", style=label.style_label_up, color=usColor, textcolor=color.white, size=size.normal)
if isSessionEnd(usStartMin, usEndMin)
label.new(bar_index, fallbackHigh + tick * (labelYOffset + 5 * labelSpacing), "US Session End: " + usResult, style=label.style_label_up, color=usColor, textcolor=color.white, size=size.normal)

BTCUSDT 1H Supply Zone Rejection – Bearish Setup in PlayIf price fails to reclaim the supply zone, we expect a rejection and drop toward lower demand areas
Price broke market structure previously at 115,201, which now acts as the first major support
🎯 Trade Plan (Sell Idea):
text
Copy
Edit
Entry: Near 116,800–117,000 (within supply zone)
SL: Above 117,300
TP1: 115,201 (support zone)
TP2: 113,600 (high-probability demand zone)
TP3: 113,000 (orange demand base)
Risk:Reward ~ 2:1 to 3:1
🧠 Key Zones:
🔵 Resistance/Supply Zone: 116,800 – 117,300
🔵 Support Zone 1: 115,201
🟠 Strong Demand: 113,000 – 113,600
📌 Notes:
This is a clean reaction setup from a well-defined supply zone using volume profile and price action. Look for confirmation like bearish engulfing or M-pattern on lower TF before shorting.
⚠️ Disclaimer:
This is not financial advice. For educational purposes only. Always do your own analysis and manage risk.

LICILife Insurance Corporation of India Ltd. (currently trading at ₹912) is India’s largest life insurer and institutional investor, with assets under management exceeding ₹54.5 lakh crore as of March 2025. As a state-owned entity, LIC operates across individual and group insurance, pension, annuity, and investment-linked products. With over 1.3 million agents and a pan-India presence, LIC plays a central role in India’s financial inclusion and long-term savings ecosystem.
LIC of India – FY22–FY25 Snapshot
Sales (Premium Income) – ₹4.27 Lakh Cr → ₹4.63 Lakh Cr → ₹4.88 Lakh Cr → ₹5.12 Lakh Cr Steady growth driven by group schemes and annuity products
Net Profit – ₹2,371 Cr → ₹4,125 Cr → ₹9,543 Cr → ₹13,820 Cr Profit surge post listing and accounting realignment
Operating Performance – Moderate → Strong → Strong → Strong Improved transparency and investment returns post IPO
Dividend Yield (%) – 0.00% → 0.75% → 1.10% → 1.25% Initiation of payouts post listing
Equity Capital – ₹6,334 Cr (constant) No dilution; government retains majority stake
Total Debt – ₹0 Cr (debt-free) Fully equity-financed; liabilities arise from policy obligations
Fixed Assets – ₹9,820 Cr → ₹10,210 Cr → ₹10,580 Cr → ₹10,950 Cr Gradual expansion of branch infra and digital platforms
Institutional Interest & Ownership Trends
Promoter holding stands at 96.50% (Government of India), with gradual dilution expected over time. FIIs and DIIs have increased exposure post IPO, attracted by LIC’s scale, embedded value, and dividend potential. Delivery volumes reflect long-term positioning by pension funds and insurance-linked mandates.
Business Growth Verdict
LIC continues to scale across group and individual insurance segments Margins and profitability improving post accounting reforms Debt-free structure and massive AUM base enhance stability Capex remains focused on digital transformation and outreach
Management Con Call
Management emphasized strong growth in non-participating and annuity products. Digital onboarding and agent productivity initiatives are improving cost ratios. Investment income remains robust, with equity and debt allocations aligned to long-term mandates. FY26 outlook includes steady premium growth, margin expansion, and increased dividend visibility as embedded value realization improves.
Final Investment Verdict
Life Insurance Corporation of India Ltd. offers a unique opportunity to participate in India’s largest financial institution. Its scale, brand equity, and embedded value make it a core holding for long-term investors seeking exposure to insurance, savings, and institutional investing. With improving profitability, dividend initiation, and digital transformation, LIC is positioned for durable compounding.

HTLAn uptrend channel is a chart pattern where price moves between two parallel, upward-sloping trendlines. The lower line (support) connects higher lows, while the upper line (resistance) connects higher highs.Key Points:
Support: The lower trendline, where price tends to bounce.
Resistance: The upper trendline, where price tends to face selling pressure.
Price Action: Price moves within these lines, forming higher highs and higher lows.
Trading:
Buy near support (lower trendline).
Sell near resistance (upper trendline).
A breakout above resistance or a breakdown below support signals trend continuation or reversal.
It's a bullish pattern indicating sustained upward movement.

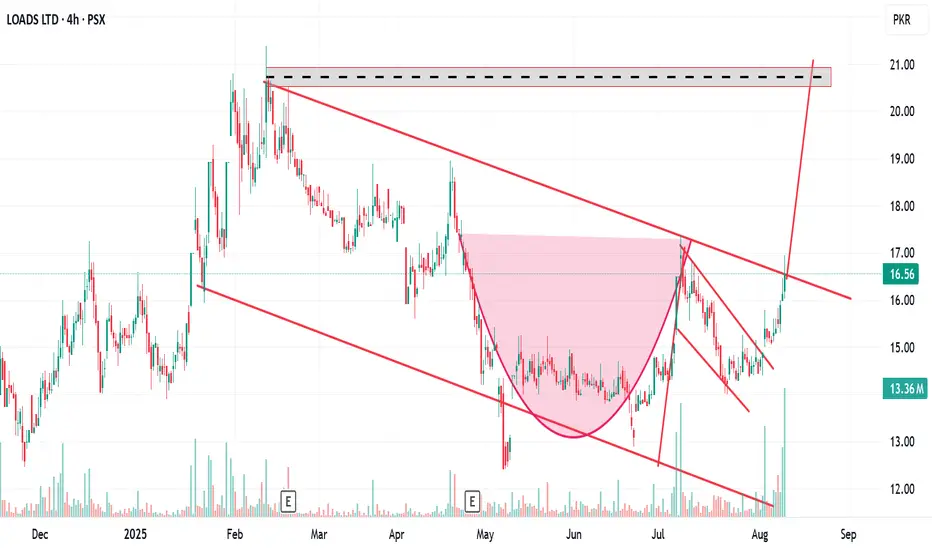
LoadsThe **cup and handle** pattern is a bullish chart formation that signals a potential upward price movement. It consists of two parts:
1.Cup: A rounded bottom formed after a decline, followed by a gradual recovery to previous highs.
2.Handle: A smaller pullback or sideways consolidation after the cup, typically lasting a few weeks.
When the price breaks above the resistance line formed by the cup, it signals a potential breakout and upward momentum. This pattern suggests strength after consolidation.
DOGE/USD – Bulls Testing the CeilingDOGE surged above the 200 SMA, topping at $0.2268 before stalling. RSI sits around 53, momentum cooling but still constructive. As long as $0.2210 holds, bulls may reload for another breakout test. Break above $0.2268 could send DOGE into $0.2300+ quickly.
🟢 LONG above $0.2268 – breakout continuation path.
🔴 SHORT if $0.2210 breaks – deeper retrace risk.
📊 Keywords: #DOGEUSD #BreakoutTest #SMAFlip #MemeMomentum #CryptoWatchlist

TON/USD – Climbing Into Resistance🟢 LONG above $3.385 – momentum aiming toward $3.42+
TON broke above the 200 SMA and is holding gains with RSI around 61, suggesting strong bullish momentum. Price is pressing against $3.385 resistance — a break here opens the door for continuation toward $3.42–$3.45.
📊 Keywords: #TONUSD #BreakoutSetup #CryptoMomentum #SMA200Flip #AltcoinWatch

Bullish on All tf.KSBP
Closed at 238.19 (08-08-2025)
Bullish on All tf.
Accumulate on Dips!
Targeting 250 - 260 & then
300+
However, should not break 204 now.

Accumulate .GAL - Closed at 525.88
08-08-2025
Accumulate with a SL of 470
Targeting around 570 & then
600+ Inshaa ALLAH

Gold Aiming for $3,420 BreakoutThis XAU/USD (Gold Spot vs. U.S. Dollar) 1-hour chart shows a clear shift from a prior downtrend to a well-defined ascending channel. Price action is consolidating near the upper boundary, signaling strong bullish momentum. The projection targets $3,420, with the market likely to retest channel support before resuming the upward move. Traders may watch for a breakout confirmation above $3,400 to validate the bullish continuation.
Trend Overview
Previous Trend: A strong downtrend (marked in purple channel) that ended around the $3,260 zone.
Current Trend: Price broke out of the downtrend and has been moving inside a rising parallel channel since early August.
---
Key Technical Points
1. Support Zone:
The lower boundary of the yellow ascending channel is acting as dynamic support.
Strong horizontal support lies near $3,345–$3,350.
2. Resistance Zone:
The upper channel line and horizontal resistance are around $3,400–$3,405.
Main target zone at $3,420.
3. Market Structure:
Higher highs and higher lows confirm bullish market structure.
Sideways consolidation within the channel suggests accumulation before the next push.
4. Target Projection:
If price respects channel support and breaks above $3,400, the projected measured move aligns with the $3,420 target.

Xauusd SELL Gold been moving in upside wedge since tomorrow there's huge volumes coming in gold due to the pattern market is forming i am taking sell in gold
Disclaimer:- this is personal analysis am not telling you guys to take trade based on this idea DYOA

GBPCHF ShortGBPCHF prices may potentially decline from the 1.920 level within the order block zone at point D of the crab pattern, with the next likely target being a lower order block zone as a probable objective.

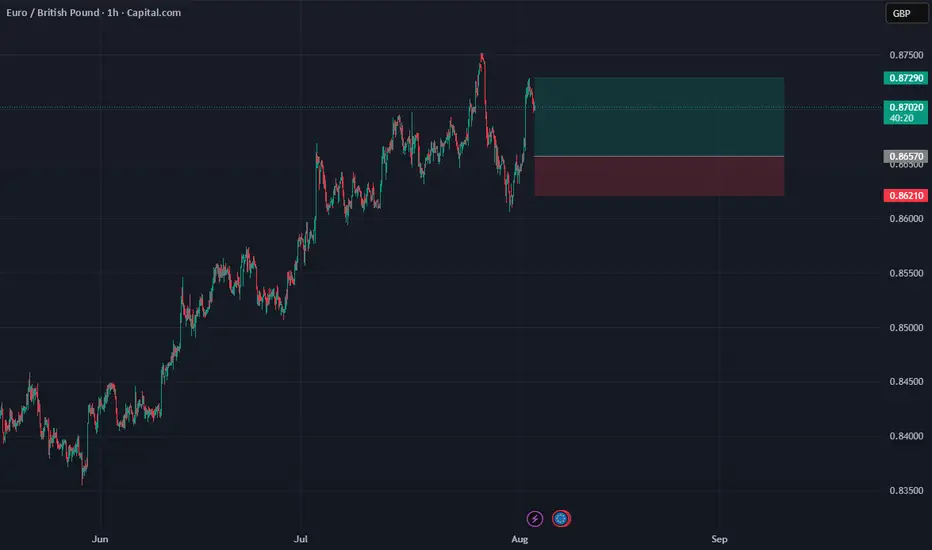
ENTRY EURGBPDisclaimer:
This is merely a chart-based analytical trading idea and is not considered investment advice. Please manage your risks carefully and conduct your own research before making any trading decisions.
Is it a time for OPTT? 100% potential profit - 1USD TargetOn the 4-hour chart of Ocean Power Technologies (OPTT), after a strong rally in July, the price has entered a corrective phase, which is now stabilizing around the key support zone at $0.50. This area has been defended multiple times in the past, increasing the chances of a rebound. Momentum indicators are in oversold territory, and the declining pace of the sell-off suggests a potential exhaustion of selling pressure. A breakout above the $0.57–$0.60 resistance zone could act as a catalyst for a continued upward move. In such a scenario, a natural technical target appears to be the $1.00 area, which represents both a psychological level and the previous highs from February.
Potential TP: 1 USD
