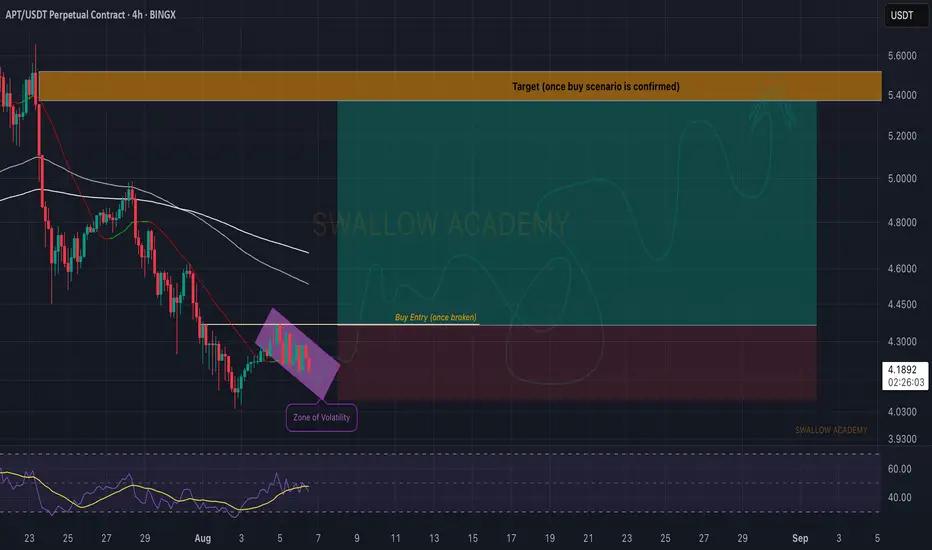
Aptos (APT): Zone of Liquidity or Zone of Breakout? APT seems to form a double bottom pattern here, where we are looking for a proper breakout of that neckline zone, after which we are going to look for a long position here as well!
Swallow Academy
Harmonic Patterns
BTC 1H Analysis – Key Triggers Ahead | Day 3💀 Hey , how's it going ? Come over here — Satoshi got something for you !
⏰ We’re analyzing BTC on the 1-hour timeframe .
⏱ We’re analyzing Bitcoin on the 1-hour timeframe.
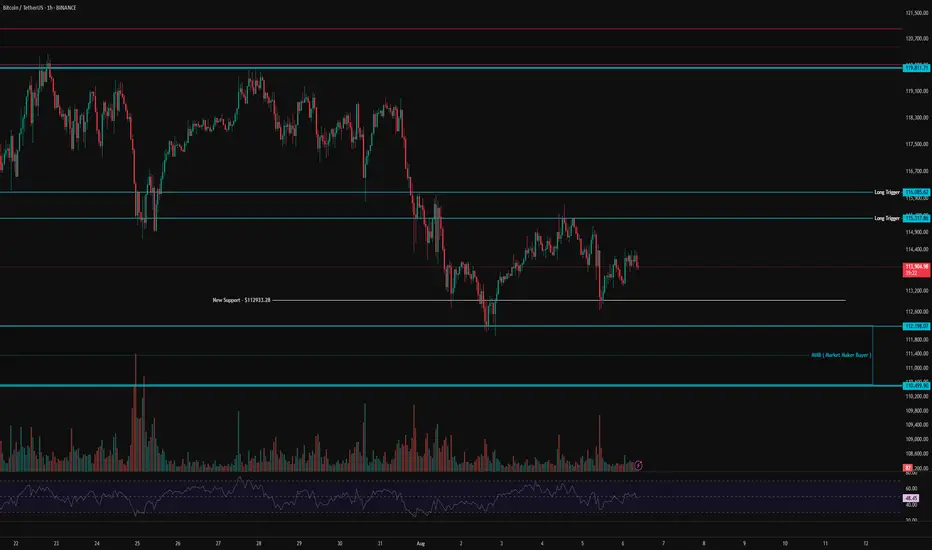
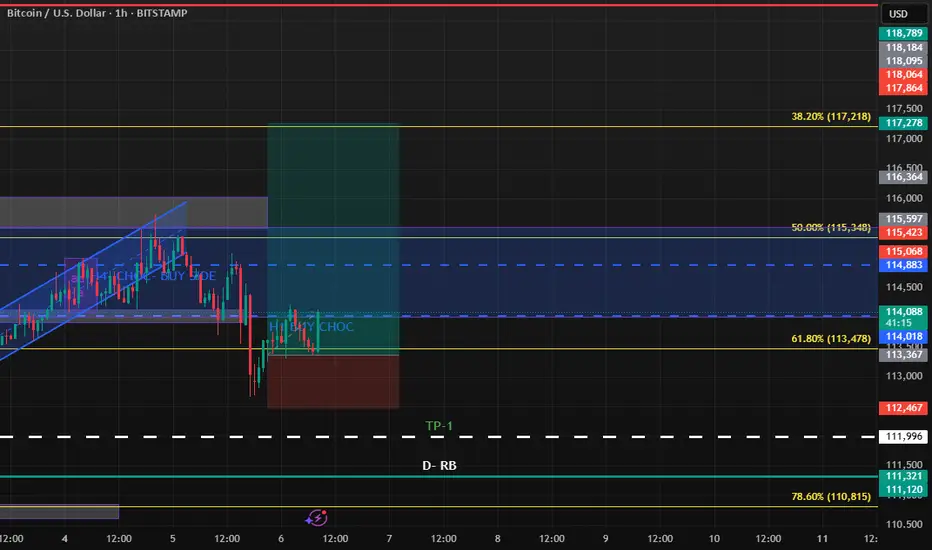
👀 After bouncing from the current $113,000 area, Bitcoin moved upward, indicating the presence of market maker buyers in this zone. A short-term support has formed at $113,000, and yesterday we saw a strong rejection from this level, which helped prevent further selling pressure.
Bitcoin now faces a resistance zone and a potential long entry trigger between $115,317 and $116,085. If long positions increase and short positions get squeezed, this resistance could be broken, potentially fueling a bullish move.
⚙️ On the RSI, our key level is the 50 range. A confirmed hold above this level could signal a higher low forming relative to the previous bottom at $112,933.
🕯 We’re seeing an increase in trading volume, and as the price moves closer to $110,499, there's a noticeable liquidity pull from long positions—more buyers are stepping in around this area.
📈 Our long position trigger lies within the resistance zone mentioned. A confirmed breakout and hold above this level, alongside RSI entering Overbought across multiple timeframes and volume expansion, would give us a solid entry for a long position.
📉 Our short position trigger is below $112,200. A sharp drop with strong selling pressure and RSI entering Oversold would justify a short entry—though I do not recommend taking this trade.
❤️ Disclaimer : This analysis is purely based on my personal opinion and I only trade if the stated triggers are activated .
Kakao Bullish 📊 Trade Idea: – Fibonacci Retracement + Bullish Continuation Setup
Timeframe: Daily (1D)
Chart Type: Candlestick
Strategy Type: Swing Trade / Trend Continuation
⸻
🧩 Trade Thesis:
After a strong impulsive move upwards, the price has retraced back to the 50%-61.8% Fibonacci zone, which historically acts as a key support area during trending markets. A possible bullish continuation pattern is forming, with consolidation visible near the 0.5 level.
⸻
📍 Entry, Stop Loss & Take Profit:
• Buy Entry: 56,800 (Breakout or confirmation from current support zone)
• Stop Loss (S.L): 53,300 (Below the 0.618 Fib level and recent local low)
• Take Profit (T.P): 88,500 (Based on previous swing high extension / trendline projection)
⸻
📏 Trade Metrics:
• Risk per Share: 56,800 - 53,300 = 3,500
• Reward per Share: 88,500 - 56,800 = 31,700
• Risk-to-Reward Ratio: ~1:9
A high reward/risk setup with price holding near Fibonacci support, awaiting breakout confirmation.
⸻
🔍 Technical Confluence:
• Price has respected the 61.8% Fibonacci retracement level, a key area of potential reversal.
• Volume shows signs of stabilization after the correction phase.
• Uptrend structure remains valid unless the price closes below 53,300.
• Potential bullish flag or pennant pattern in progress, signaling continuation.
⸻
⚠️ Trade Management:
• Aggressive Entry: Near current levels (anticipating breakout)
• Conservative Entry: Wait for daily candle close above 59,400 (confirmation)
• Adjust SL to Breakeven if price breaks above 65,000
• Watch for Rejection Signs if price approaches 61.8% level again
⸻
🕓 Timeline Expectation:
• Short-to-Medium Term Outlook (2–6 weeks) depending on breakout and follow-through.
⸻
📌 Note: Always review fundamental context and broader market sentiment. This is a technical idea for educational purposes only.

Gold - Intraday Long Setup (5M TF) | Smart Money + Elliott Struc# 🟢 Gold - Intraday Long Setup (5M TF) | Smart Money + Elliott Structure
**Pair:** Gold Spot / USD
**Timeframe:** 5M
**Session:** London / NY Overlap
**Type:** Intraday Long Idea
**Concepts:** Smart Money, Supply & Demand, Wave Analysis, SSL Confirmation
---
## 🔍 Market Context
The market is currently reacting inside a **key Demand Zone** on the 5-minute timeframe, following a strong bearish move during the London session. The structure suggests a corrective **ABC wave formation**, where the **(c) point** appears to be forming a potential higher low at demand.
- Point **(a)**: Marked the first impulse down
- Point **(b)**: Rejection at minor **Supply Zone**
- Point **(c)**: Retest of **POI at Demand**, showing signs of exhaustion in selling pressure
---
## 📈 Technical Confluences
- 🟦 **Demand Zone** active and respected
- 📏 Potential BOS (Break of Structure) upon break of the recent high
- 📊 **Vol %ile** = 83% → Above average participation
- ⚠️ Risk Level: High (tight structure, requires confirmation)
- 🧭 Entry Distance: Near
---
## 🔧 Indicators Status (SSL Hybrid)
| Indicator | Status |
|--------------------------|----------|
| SSL Channel | ✅ Bullish cross (supporting reversal)
| RSI (50) | ✅ Holding above midpoint
| MACD | ✅ Bullish crossover (early signal)
| BB Oscillator / HT / RQK | ❌ Still bearish (lagging)
---
## 🎯 Trade Idea
**Bias:** Long
**Trigger:** Break above **minor Supply** and formation of BOS
**Target Zones:**
1. **TP1:** 3,370
2. **TP2:** 3,378 (supply edge)
3. **TP3:** 3,385 (upper supply zone)
**SL:** Below point (c) @ **~3,357**
---
## 🧠 Notes
This setup is valid as long as price holds above the Demand Zone and confirms a bullish shift via BOS. Wait for clear confirmation before entering.
_This is an educational idea based on Smart Money + Elliott Wave principles – not financial advice._
---
#gold #smartmoney #supplydemand #elliottwave #sslhybrid #intraday #5mtf #tradingview

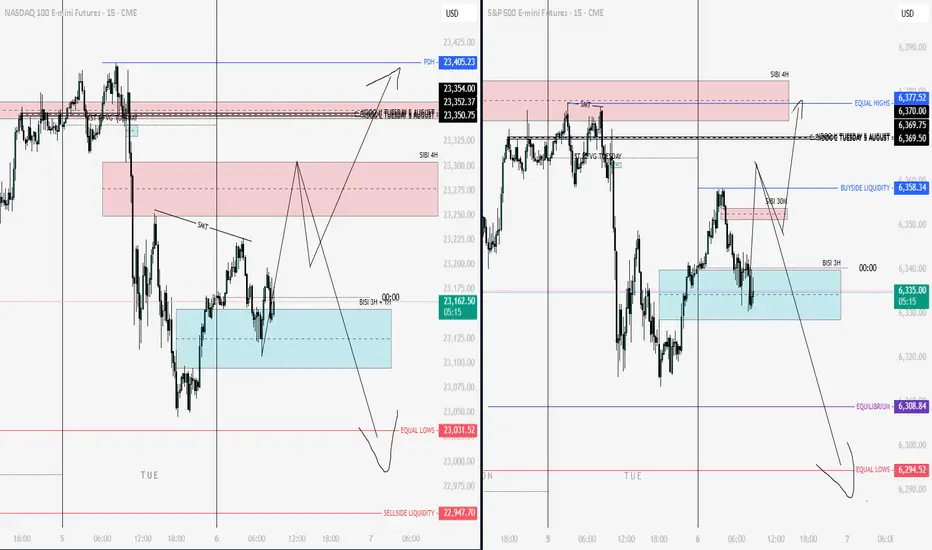
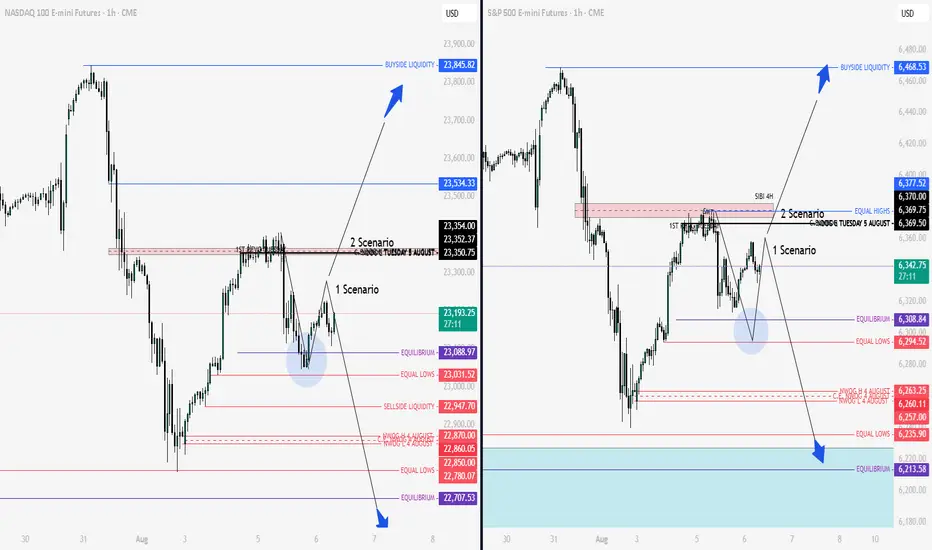
NQ & ES Key Levels 06-08-2025"To determine which of the two scenarios is more likely to play out, we first need to see how the market opens. Based on the price action and how key levels are respected, we’ll gain clarity on the setup we’re looking for. Price is currently at a critical point, with probabilities at roughly 50-50 — so there’s no clear bias yet. However, we’re well aware of the key levels and zones we’re focused on."
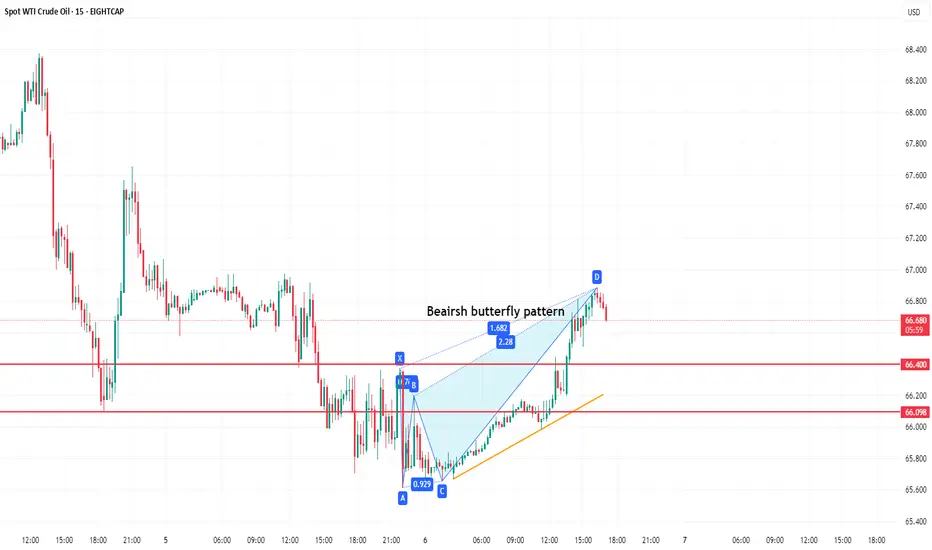
WTI SPOT CRUDEBearish butterfly appear completed, and near completion ratio once reversed, Wave wise also reversal possible wave B in lower degree appear to be completed.
After the forecast 05-08-2025Just take a look at the previous post I predicted where the price would go and see what happened and the sensitivity to these key levels. The price delivered perfectly on sensitive levels
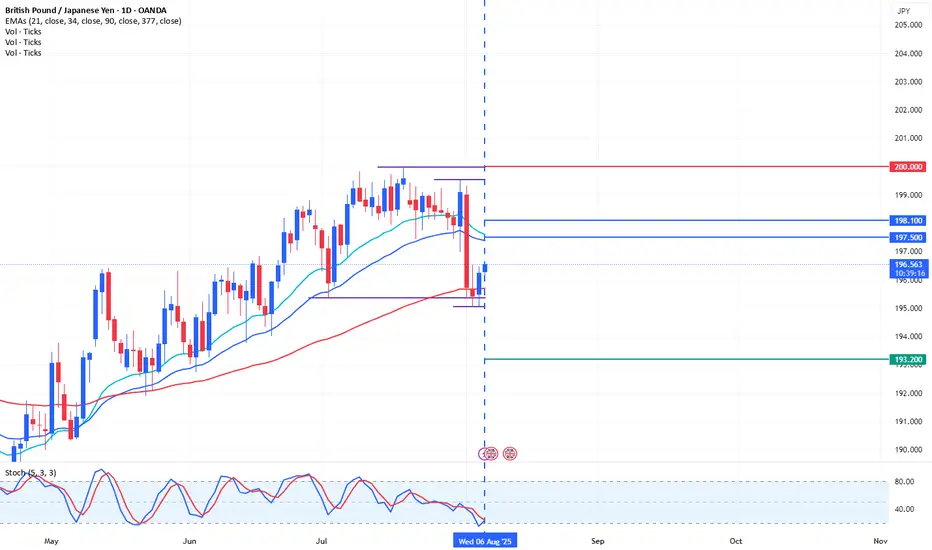
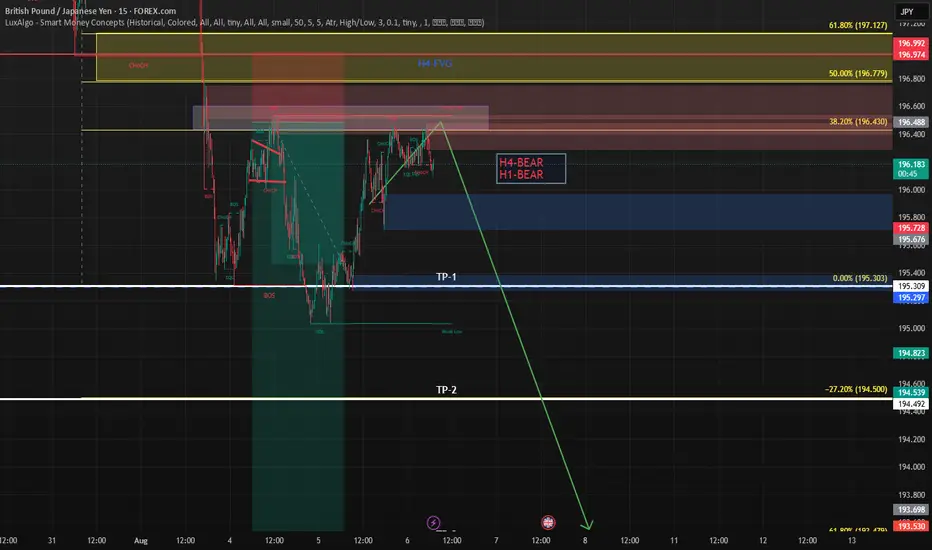
Trading Ideas GBPJPY 1D [Disc On]Fundamental Analysis:
The Fed Interest Rate: 4.50% (in line with expectation)
Bank of England Interest Rate: (release date August 7, 2025)
Note:
idk how to explain but all information is in that chart :v
Dlala Holding ( DBIS ).Dlalal Stock on Explosive Level.
1st Target price ( Anti-Crab ) .
2nd Target price ( Anti-Bat ) / ( Alternate-Shark ) .
Highly recommended for Buying 👌- Strongly recommended for Buying 💥💥💥

Sell AUDJPYAUDJPY buy will quickly turn around and start shorting in the next few hours. Price will test the support at 94,342 soon. Price was already on a downtrend, yesterday we saw a bullish retracement to trigger sell orders.

ENTRY EURJPYDisclaimer:
This is merely a chart-based analytical trading idea and is not considered investment advice. Please manage your risks carefully and conduct your own research before making any trading decisions.

Bitcoin Long-Term Investment Outlook 1W [Disc On]Bitcoin Long-Term Investment Outlook
Technical Analysis:
A bearish stochastic divergence has formed on the weekly (1W) chart, indicating a potential trend reversal downward toward the Fibonacci cluster support zone.
Conclusion: There is a high probability of seeking BUY positions at the psychological levels of 107,300 – 103,400 and 92,800 – 91,800, with a Take Profit target at 140,600.
(Note: Always confirm with volume and macroeconomic factors before execution.)

135K COMING! Retrograde rallies!Heres a quick update on my take on Bitcoin reacting to Mercury retrograde, the moon cycles and our lunar eclipse in early September.
We are at our last stages in this bull market before BTC starts bleeding into September. It's critical to know how we are sitting technically, so please stay calm and observe the market neutrally.
- 112K Support is holding firm, this level is critical as Mercury retrograde enters Q3, which Quarter 3 has been historically bullish for Bitcoin.
- However, bearish energy could still linger until August 14th, as that date is within a 5 day window of a full moon. From now until the 14th will be a cooling zone and consolidation zone. Our RSI is sitting nice and neutral, not reacting to much to the recent drop, meaning more room for upside.
- From August 14th - 28th, we will start to see euphoria in the market. After we are supported on the 117.5K level a 15% rally could take us to the 1.618 FIB level, i'm taking profits at 135K.
- After that, we face the second lunar eclipse of this cycle on September 7th. Historically every Lunar eclipse has bearish energy, and I'm excepting to re accumulate after a 30 - 35% correcting from the recent top out.
This will be the end of the Bitcoin rally, naturally creating a bleed from BTC into the ALT's, Bitcoin will drop as well as dominance and ALT season will kick in. Bye Bye BTC until march for a little swing...

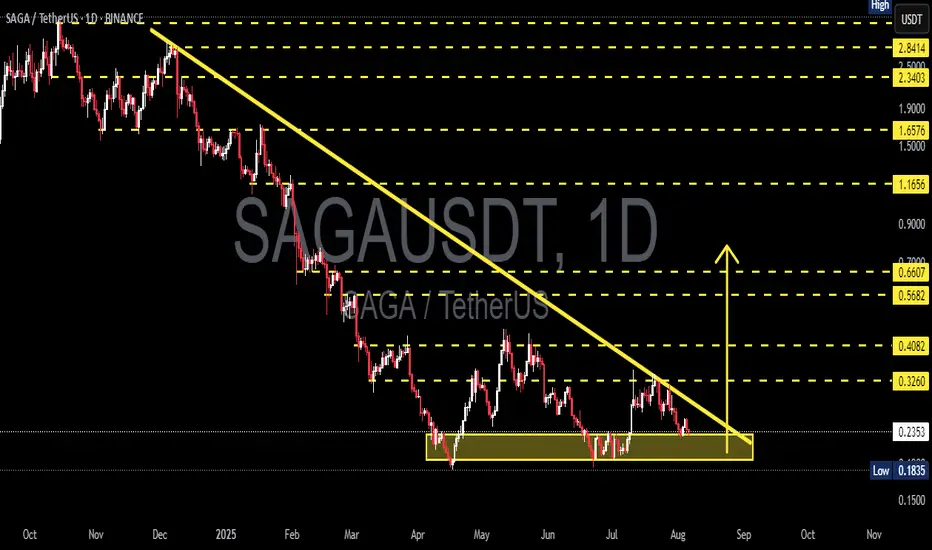
SAGA/USDT – Endgame of Descending Triangle, Big Move Coming!🧠 Overview:
SAGA/USDT has been forming a Descending Triangle pattern for nearly 6 months, reflecting sustained selling pressure while maintaining strong horizontal support between $0.2352 – $0.1835. The price is now approaching the apex of the triangle, suggesting that a major move is imminent — either a bullish breakout or a bearish breakdown.
This setup is a classic “make or break” moment that often precedes explosive price action.
---
🔍 Technical Pattern: Descending Triangle
Dynamic Resistance: Lower highs forming a clear downtrend since February 2025.
Strong Support: The base of the triangle is solidified in the $0.2352–$0.1835 zone, which has been tested multiple times.
This pattern shows increasing sell pressure, but also persistent buyer defense — tension is rising.
---
🟢 Bullish Scenario: Breakout and Trend Reversal?
A confirmed breakout above the descending trendline and resistance at $0.3260 would signal a potential trend reversal and the start of bullish momentum.
📌 Bullish Target Levels:
1. $0.4082 – first local resistance
2. $0.5682 – volume-heavy area
3. $0.6607 – measured breakout target
4. $1.1656 – medium-term resistance
5. $1.6576 to $2.34 – possible if strong altcoin rally occurs
📈 Bullish Confirmation Signals:
Strong bullish candle close above trendline
Significant volume spike
RSI bouncing from neutral or oversold area
---
🔴 Bearish Scenario: Breakdown from Support
If the price breaks below $0.2352 and fails to hold the critical level at $0.1835, it may trigger a deeper continuation of the long-term downtrend.
📌 Bearish Target Zones:
$0.1500 psychological level
Possibly lower, depending on macro sentiment
⚠️ Caution:
Watch out for false breakdowns — wait for daily candle confirmation before reacting emotionally.
---
📊 Strategic Summary:
SAGA is at a critical inflection point — either it breaks out to reverse the trend or continues the downtrend with new lows. While descending triangles are typically bearish patterns, bullish breakouts can invalidate the structure, especially if supported by volume and sentiment.
💡 Pro Tip:
Always wait for daily candle close confirmation
Use RSI/MACD to confirm momentum shifts
Set tight stop-losses, especially near support/resistance
#SAGAUSDT #CryptoAnalysis #TechnicalBreakout #DescendingTriangle #BullishSetup #Altcoins #TrendReversal #CryptoChart #BreakoutWatch #VolumeAnalysis #PriceAction
JOE/USDT Approaching a Major Turning Point: Will Buyers Step In?🔎 Market Overview & Structure:
JOE/USDT is currently trading within a major historical demand zone between $0.1241 – $0.1548, a level that has proven to be a strong support since early 2023. Each time the price revisits this area, we’ve seen significant bounces — indicating that buyers continue to defend this zone aggressively.
However, the macro structure still reflects a clear long-term downtrend from its all-time high.
---
🧠 Why This Zone Matters (Demand Zone Characteristics):
This zone has been tested multiple times and remains intact, showing strong buyer interest and accumulation.
It acts as the final defense before a possible major breakdown.
Institutions and smart money often accumulate in zones like this – making it a Low Risk, High Reward area.
---
🟢 Bullish Scenario – Is a Mid-Term Reversal Brewing?
If the price holds above the $0.1241 level and breaks through $0.1885:
1. A reversal pattern (base or double bottom) may form.
2. Potential upside targets:
🎯 TP1: $0.1885 → First resistance breakout
🎯 TP2: $0.2332 → Key horizontal resistance
🎯 TP3: $0.4087 → Next major supply zone
🎯 TP4 (Mid-Term): $0.6254 – $0.9569 if strong bullish momentum continues
3. A daily or 5D candle close above $0.2332 with high volume would confirm a trend shift to the upside.
---
🔴 Bearish Scenario – Danger of Breakdown:
If the price breaks below $0.1241:
A new Lower Low structure will confirm continued bearish trend.
There's no major historical support below this zone, opening the door for a sharp decline into uncharted territory.
This would signal renewed seller dominance and likely a prolonged bearish phase.
---
📐 Price Patterns & Structure:
Current price action resembles an accumulation range or base formation.
Possibility of:
🔁 Double Bottom
⏳ Adam & Eve Reversal Pattern
A breakout from this range could spark a strong upside rally.
---
💡 Strategy Insights:
Accumulation Entry Zone: $0.1241 – $0.1548 with tight stop-loss.
Bullish Confirmation: Breakout and close above $0.1885 with volume.
Bearish Confirmation: Daily close below $0.1241 → avoid longs, consider shorts.
---
📌 Conclusion:
JOE/USDT is at a make-or-break level. This is a key decision point where the price could either start a mid-term bullish reversal or fall into deeper bearish territory.
For long-term investors, this is a potential accumulation zone with favorable risk-reward. For traders, it's time to watch closely for breakout or breakdown confirmations.
#JOEUSDT #CryptoAnalysis #Altcoins #BreakoutTrading #ReversalZone #DemandZone #TechnicalAnalysis #JOEToken #CryptoSetup

consolidation seen in naukri now trying to break supportwatch naukri as it is breaking the support good to watch for downside
follow strict sl and targets

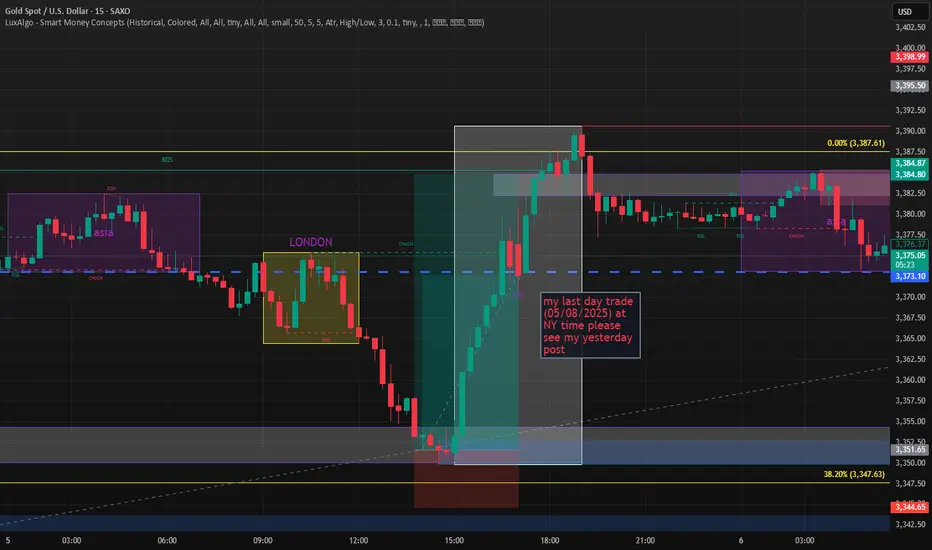
My last day trade which was published on (05/08/2025) at newyorkPlease see my last day trade which was almost 400 pips ..if u need any assistance or and technical support in chart or trade ..send me hi to my TG @thanz_123.
WTI(20250806)Today's AnalysisMarket News:
The US non-manufacturing PMI fell to 50.1 in July from 50.8 in June, below the expected 51.5. The ISM New Orders Index fell to 50.3 in July from 51.3 in June, with export orders contracting for the fourth time in five months.
Technical Analysis:
Today's Buy/Sell Levels:
64.90
Support and Resistance Levels:
66.21
65.72
65.40
64.40
64.08
63.59
Trading Strategy:
On a break above 64.90, consider a buy entry, with the first target at 65.40. On a break below 64.40, consider a sell entry, with the first target at 64.08

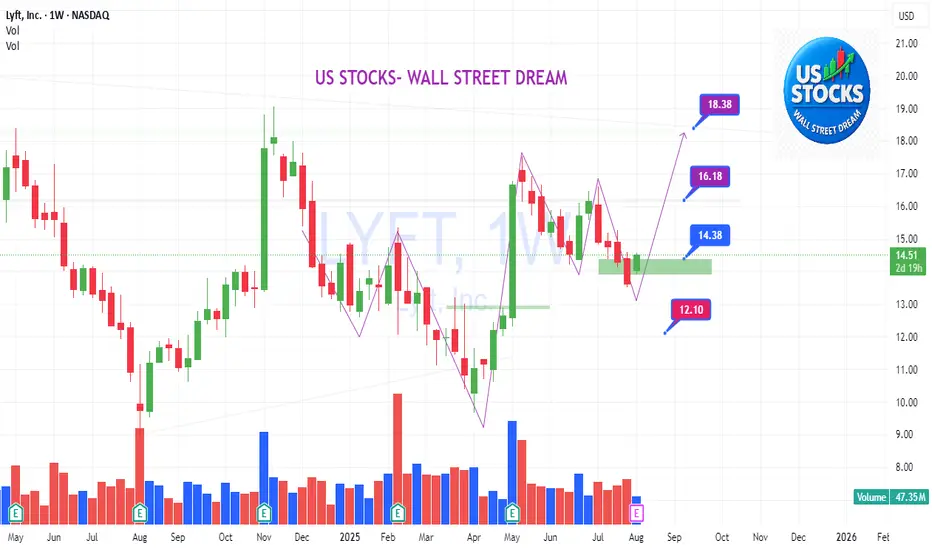
LYFT: Are these random steps on Wall Street?LYFT:
.
Are these random steps on Wall Street, or are they reasonable and logical moves by the market?
.
US STOCKS- WALL STREET DREAM- LET'S THE MARKET SPEAK!
ETH | Short | 3hrs This technical analysis is for informational and educational purposes only. It does not constitute financial advice. Remember to always research and consult with a professional before making investment decisions. Good luck! 📈💼🚀

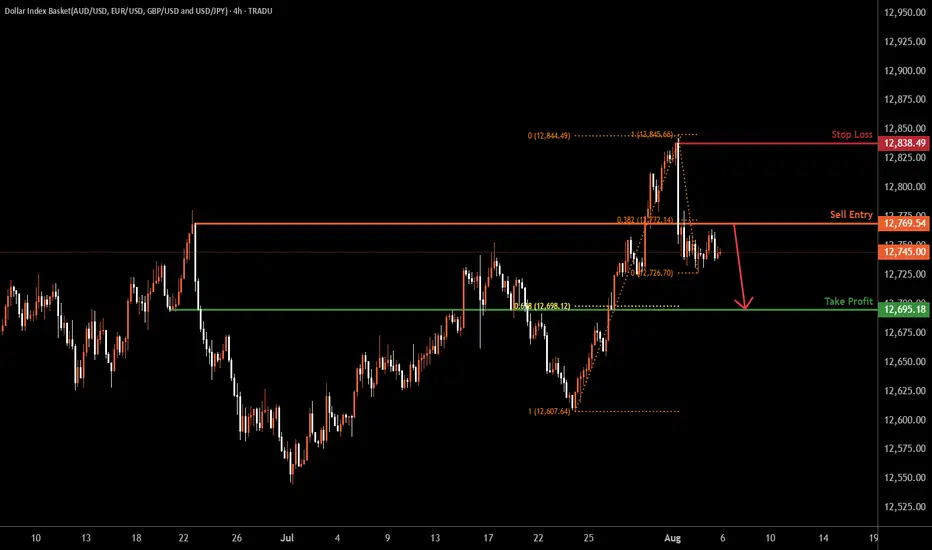
USDOLLA H4 | Bearish dropBased on the H4 chart analysis, we can see the price rise to the sell entry which is a pullback resistance and could drop from this level to the take profit.
Sell entry is at 12,769.54, which is a pullback resistance that lines up with the 38.2% Fibonacci retracement.
Stop loss is at 12,838,49, which is a swing high resistance.
Take profit is at 12,695.18, which is a pullback support that aligns with the 61.8% Fibonacci retracement.
High Risk Investment Warning
Trading Forex/CFDs on margin carries a high level of risk and may not be suitable for all investors. Leverage can work against you.
Stratos Markets Limited (tradu.com ):
CFDs are complex instruments and come with a high risk of losing money rapidly due to leverage. 65% of retail investor accounts lose money when trading CFDs with this provider. You should consider whether you understand how CFDs work and whether you can afford to take the high risk of losing your money.
Stratos Europe Ltd (tradu.com ):
CFDs are complex instruments and come with a high risk of losing money rapidly due to leverage. 66% of retail investor accounts lose money when trading CFDs with this provider. You should consider whether you understand how CFDs work and whether you can afford to take the high risk of losing your money.
Stratos Global LLC (tradu.com ):
Losses can exceed deposits.
Please be advised that the information presented on TradingView is provided to Tradu (‘Company’, ‘we’) by a third-party provider (‘TFA Global Pte Ltd’). Please be reminded that you are solely responsible for the trading decisions on your account. There is a very high degree of risk involved in trading. Any information and/or content is intended entirely for research, educational and informational purposes only and does not constitute investment or consultation advice or investment strategy. The information is not tailored to the investment needs of any specific person and therefore does not involve a consideration of any of the investment objectives, financial situation or needs of any viewer that may receive it. Kindly also note that past performance is not a reliable indicator of future results. Actual results may differ materially from those anticipated in forward-looking or past performance statements. We assume no liability as to the accuracy or completeness of any of the information and/or content provided herein and the Company cannot be held responsible for any omission, mistake nor for any loss or damage including without limitation to any loss of profit which may arise from reliance on any information supplied by TFA Global Pte Ltd.
The speaker(s) is neither an employee, agent nor representative of Tradu and is therefore acting independently. The opinions given are their own, constitute general market commentary, and do not constitute the opinion or advice of Tradu or any form of personal or investment advice. Tradu neither endorses nor guarantees offerings of third-party speakers, nor is Tradu responsible for the content, veracity or opinions of third-party speakers, presenters or participants.