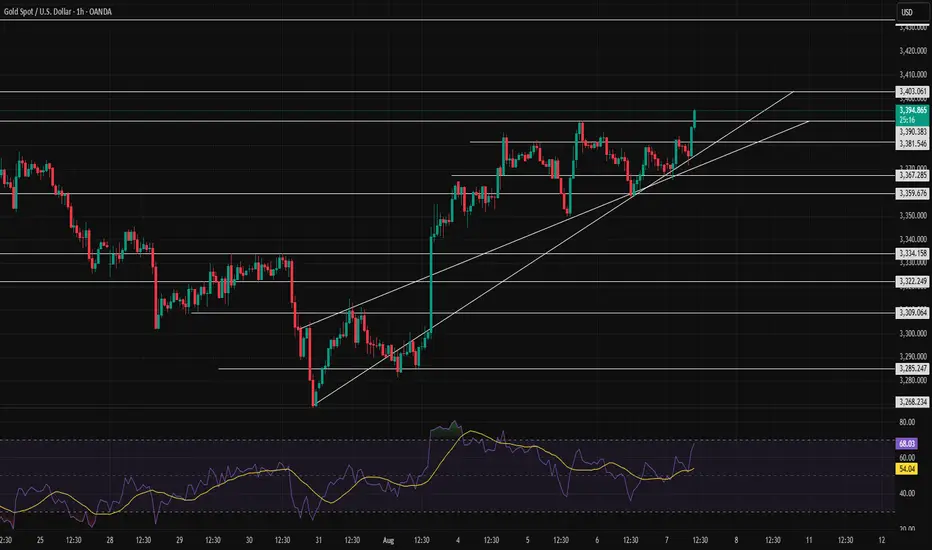
Today's gold price target: 3400+Today's gold price target: 3400+
Trading strategy remains the same. Continue buying low this week, with a target price of 3400+.
Buy range: 3350-3360-3370
Stop-loss range: 3340-3350
Target range: 3380-3400+
Technical Analysis:
As shown in Figure 2h:
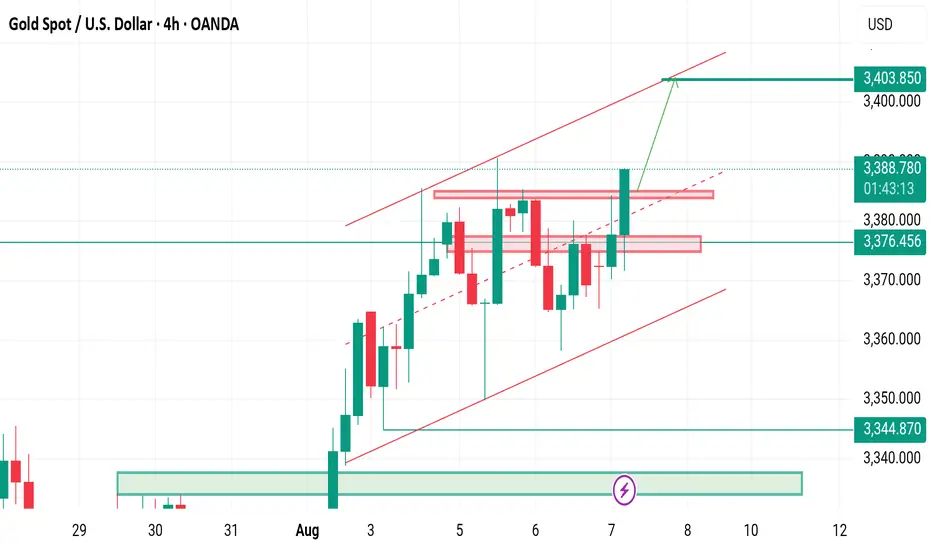
When will gold enter the triangle range of 3385-3440?
I've been waiting all week.
For the past week, gold prices have been fluctuating and converging between 3360 and 3385.
Our strategy this week is to buy low.
Currently, we remain undefeated and have made significant profits.
I still believe today could be a major moment for gold prices to break out, stabilizing at 3380 and breaking through 3400, with a target of 3440+.
I still believe the macroeconomic trend is irreversible:
Expectations of a Fed rate cut and geopolitical risks will continue to support gold prices in the short term. Long-term long positions are recommended above $3,350.
Precious metals are inherently volatile. The recommended gold trading strategy is to buy on dips over the long term.
Of course, gold prices could continue to fluctuate between $3,360 and $3,385.
If you do prefer to short, my short-term recommendation is to short near the highs of $3,385-3,390, with a stop-loss at $3,395.
If it falls below $3,365, the target support level is $3,350.
Currently, gold prices should focus on breaking through the resistance level of $3,380-3,381 in the short term.
If the price holds this level, it could potentially reach $3,450.
If the price pulls back, the support levels of $3,345 and $3,274 should be watched.
Harmonic Patterns

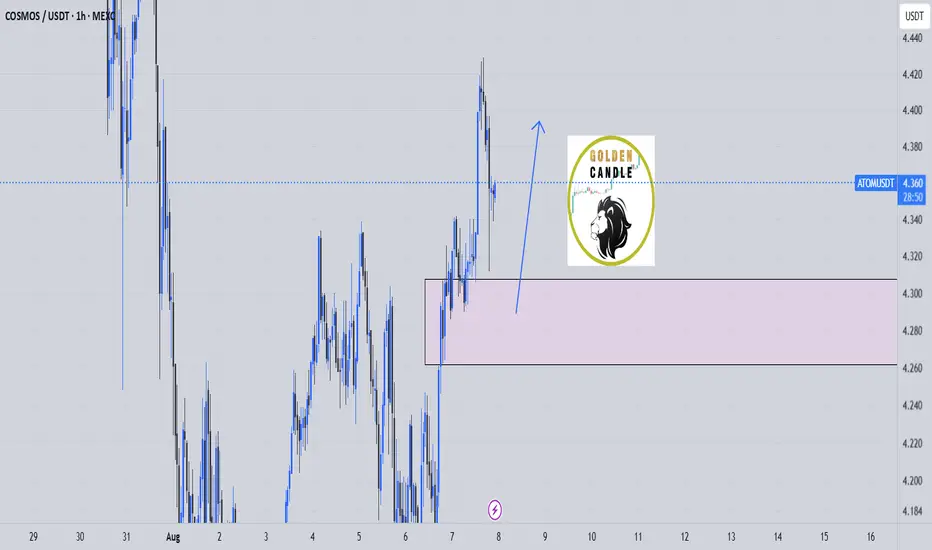
buy midterm atom "🌟 Welcome to Golden Candle! 🌟
We're a team of 📈 passionate traders 📉 who love sharing our 🔍 technical analysis insights 🔎 with the TradingView community. 🌎
Our goal is to provide 💡 valuable perspectives 💡 on market trends and patterns, but 🚫 please note that our analyses are not intended as buy or sell recommendations. 🚫
Instead, they reflect our own 💭 personal attitudes and thoughts. 💭
Follow along and 📚 learn 📚 from our analyses! 📊💡"
SHORT LINKHere’s a detailed trading analysis for your SHORT setup on LINK/USDT based on the chart:
🔍 Chart Context
Pair: ChainLink / USDT
Exchange: Binance
Timeframes: 4H (left) and 15m (right)
Current Price: ~$18.05
Short Bias: Bearish reaction expected from supply zone
🔲 Key Zones & Levels
🔼 Resistance / Supply Zone
$18.11 - $18.50 (highlighted in purple box)
Price reacted sharply on first touch → signs of sell pressure.
Confluence:
Previous highs
Psychological resistance near $18.50
🔽 Support / Target Zone
$17.05 - $16.50 (marked by orange and green box levels)
Prior consolidation and demand area
First strong reaction expected around $17.10–$17.20
🧭 Trade Idea (SHORT)
🎯 Entry
Area: $18.05–$18.50 (preferably near the top of the purple box)
Confirmation: 15m or 1h bearish engulfing or liquidity sweep + reversal
⛔️ Stop Loss
Above $18.60
Reason: Above the wick and supply zone, avoiding stop hunt
📉 Targets
TP1: $17.50 (edge of green box, early profits)
TP2: $17.00 (orange support line)
TP3: $16.50–$16.00 (final target on full breakdown)
🔧 Technical Indicators
RSI (Relative Strength Index)
4H RSI: ~69.74 → nearly overbought
15m RSI: ~66.90 → potential bearish divergence
Conclusion: Momentum slowing, ripe for pullback
Volume
Spike on breakout to $18+ zone → Possible buy climax
Declining after → suggests distribution phase
🧠 Probability Triggers
✅ High Confluence for SHORT
Strong supply zone
Overbought RSI
High volume spike + exhaustion
Clear FVG (Fair Value Gap) and imbalance below
❌ Short Invalidated If
Break & close above $18.60 with volume
Consolidation above $18.50
📝 Summary
Criteria Details
Bias SHORT
Entry Zone $18.05 – $18.50
Stop Loss Above $18.60
Target Range $17.50 → $17.00 → $16.50
Risk/Reward Approx. 1:2.5 to 1:3.5
Confidence ✅ High (Supply zone + RSI + Volume confluence)

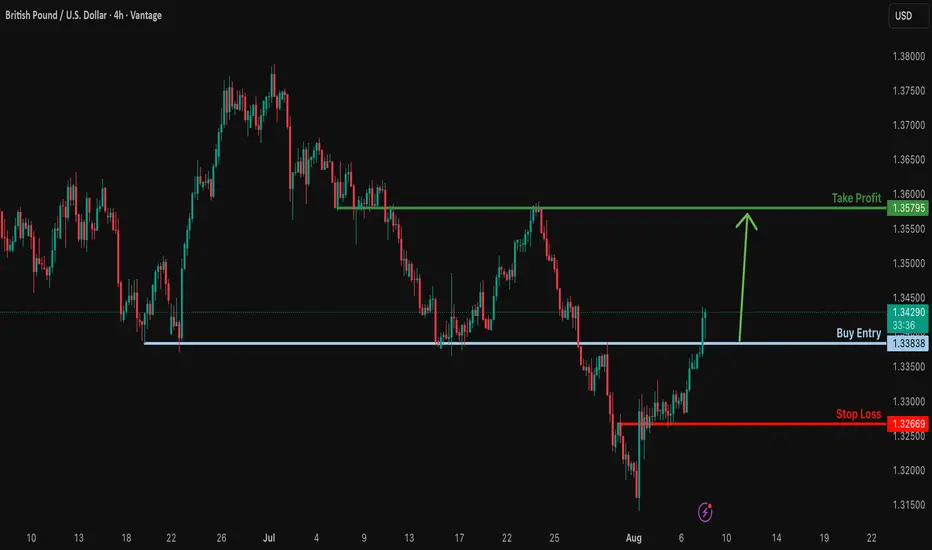
Bullish rise?GBP/USD is reacting off the support level which is an overlap support and could bounce from this level to our take profit.
Entry: 1.3383
Why we like it:
There is an overlap support.
Stop loss: 1.3266
Why we like it:
There is a pullback support.
Take profit: 1.3579
Why we like it:
There is a pullback resistance.
Enjoying your TradingView experience? Review us!
Please be advised that the information presented on TradingView is provided to Vantage (‘Vantage Global Limited’, ‘we’) by a third-party provider (‘Everest Fortune Group’). Please be reminded that you are solely responsible for the trading decisions on your account. There is a very high degree of risk involved in trading. Any information and/or content is intended entirely for research, educational and informational purposes only and does not constitute investment or consultation advice or investment strategy. The information is not tailored to the investment needs of any specific person and therefore does not involve a consideration of any of the investment objectives, financial situation or needs of any viewer that may receive it. Kindly also note that past performance is not a reliable indicator of future results. Actual results may differ materially from those anticipated in forward-looking or past performance statements. We assume no liability as to the accuracy or completeness of any of the information and/or content provided herein and the Company cannot be held responsible for any omission, mistake nor for any loss or damage including without limitation to any loss of profit which may arise from reliance on any information supplied by Everest Fortune Group.
OG Bearish DivergenceBINANCE:OGUSDT
Trade Setup:
Target 1: 6.714(0.786 Fibonnaci Golden Zone).
Target 2: 6.051 (0.618 Fibonnaci Golden Zone).
Target 3: 5.584 (0.5 Fibonnaci Golden Zone).
Target 4: 3.609 (0 Fibonnaci).
DCA : 8.093 (1.135 Fibonacci)
Stop Loss: 8.635 (1.272 Fibonacci).
RSI Analysis: The RSI is showing a bearish divergence, suggesting potential bearish momentum. The current RSI is around 84.67, approaching oversold territory, so caution is advised.

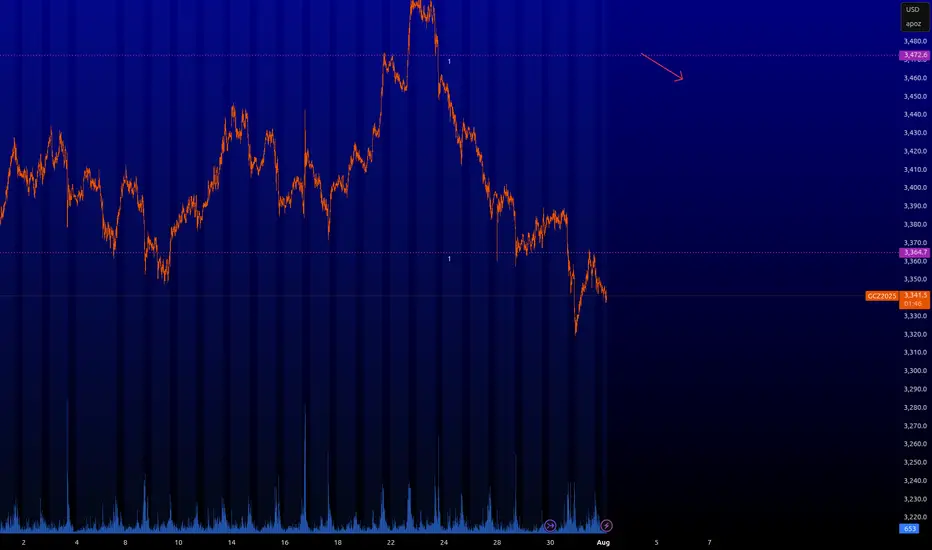
GC : Key levelsHere are the key levels that the market will be interested in. You can scalp from 3.472.
⚠️ VOLATILITY WARNING ⚠️
Trading around major news can be extremely unpredictable. Trade responsibly!
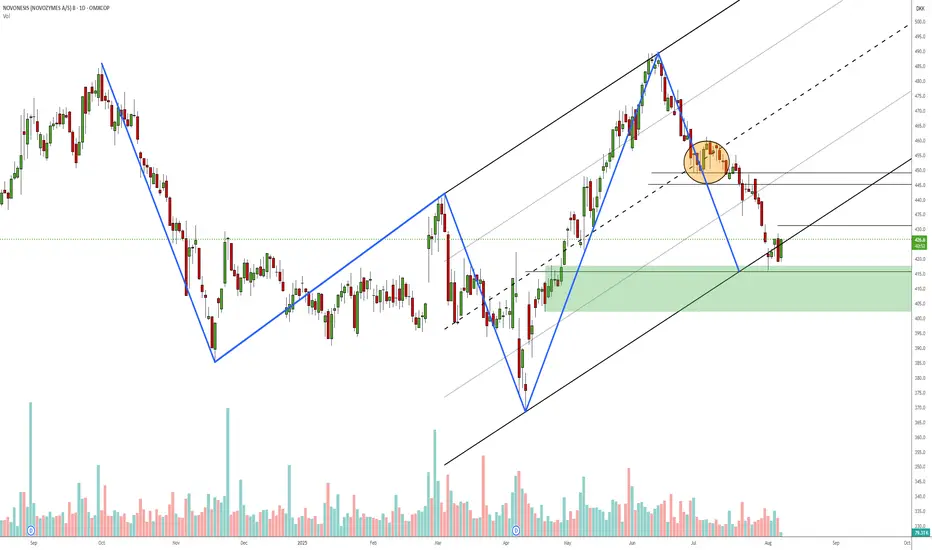
Novonesis daily reversal?Measured move / 3-point channel to test of failed symmetry zone. Might take 1/3 off around 445 depending on PA. I might add to the position if the bearish ab=cd at 431 fails and I'll be looking to take the loss if it drops below 400. Haven't used harmonic patterns for a long time, but this does resemble a 5-0 pattern if I'm not mistaken?
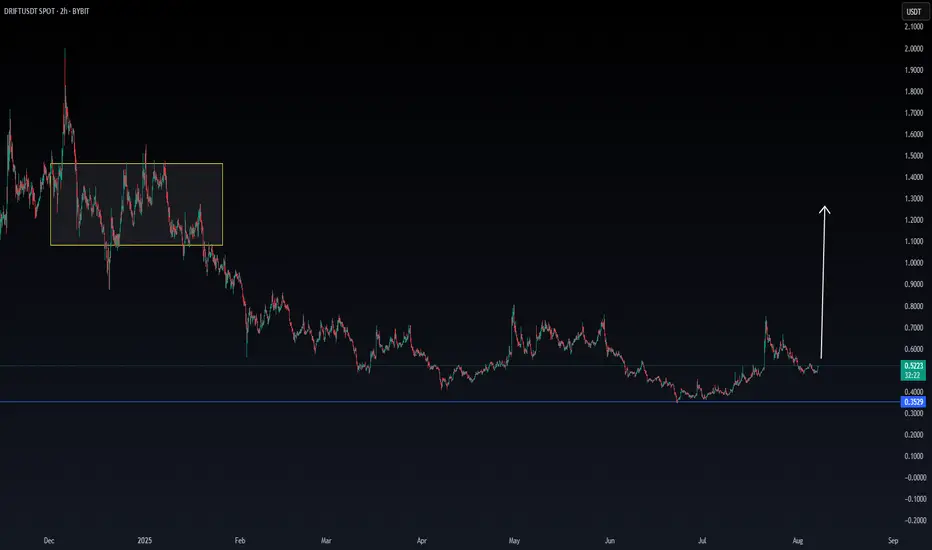
DRIFT/USDT Starting the engine to moonDrift seems to have a new upcoming volume, which can be confirmed in the coming hours.
Will follow Drift for more confirmations.
August 07 Team Call For Gold FluxThis is just a charting example for the team to use when the markets continue.
Kyle
Upneet
Rae
Ashley
We're looking for gold to reject 3390 and potential head back down to 3375 and if we dont see 3375 hit we'll see the market continue into the 3400.00+ Area looking for Gold to reject 3420 or go towards an ATH.

CADJPYIt will follow till tomorrow midday.
Let´s see.
Blessings.
Check "passiveincomes" at signal start.
thanks

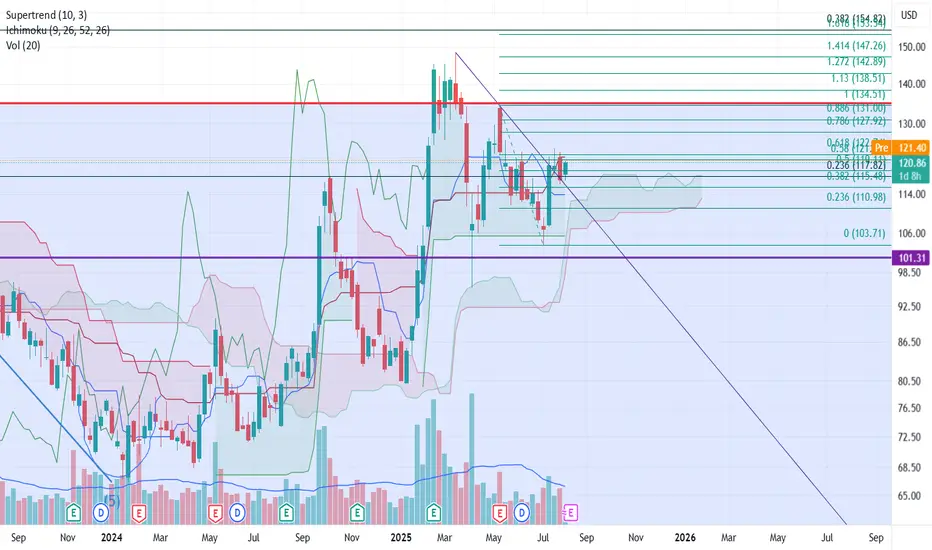
Baba - Waking GiantIt was trading at 300 levels during the 2020. Compare the EPS and sales with 2020 and 2025, there is a growth but the stock price has been trending down.
But from 2024, it has started the reversal and its trying to break the trend line.
Its 4th largest cloud provider world wide and its AI model Qwen gained traction with lots of downloads recently.
Target 1: 155$
Target 2: 210$
Stop loss: $90
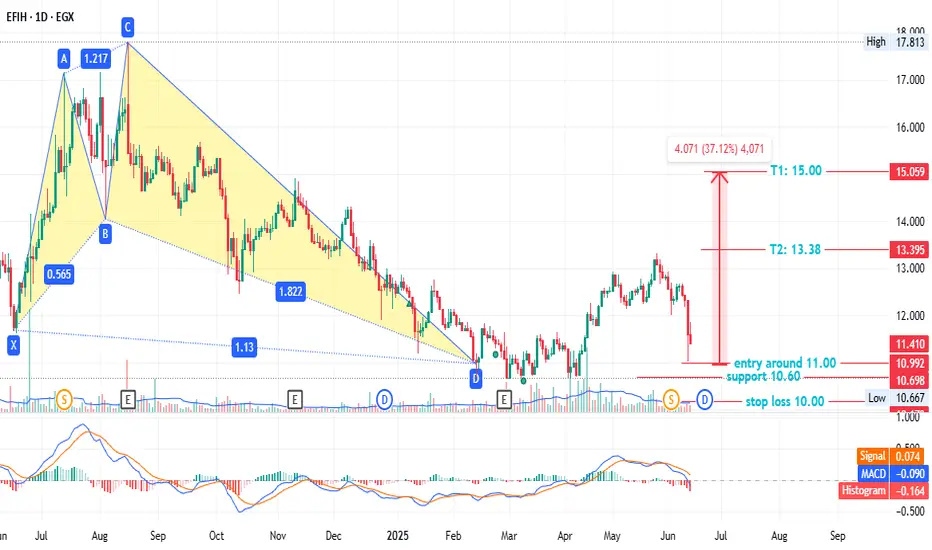
EFIH - anther chance - low risk EGX:EFIH - 1-Day Timeframe
A bullish pattern emerged on Feb 13, but prices adjusted after the 3/2 stock split on Jun 02. Key levels:
- Entry: ~11.00
- Stop loss: 10.00 (7.00% loss)
- Support: 10.60 (6-month low)
- Targets:
- T1: 13.38 (22.24% profit)
- T2: 15.00 (37.12% profit)
This is not investment advice—only my analysis based on chart data. Consult your account manager before investing. Good luck!
BTC and the RSI at the monthly chartGuys, take a look at BTC on the monthly chart.
It’s interesting—if you look at previous cycles, when the monthly RSI was at the same level as it is now, we weren’t even close to a cycle top. (I'm using BITSTAMP for this since it gives the clearest view of historical price action.)
From what I can see, the cycle top will probably land somewhere around RSI 90–95 on the monthly. If we take a more cautious approach, maybe in the 90–92 range.
(Of course, this is based on historical price action, and as we've discussed, this cycle could play out differently. Still, I think it's reasonable to expect at least some repeating patterns. And obviously, RSI alone isn’t something we can fully rely on.)

Final pullback #Buy Gold Gold is testing its support for the final time before its going to 34xx ... look for buy

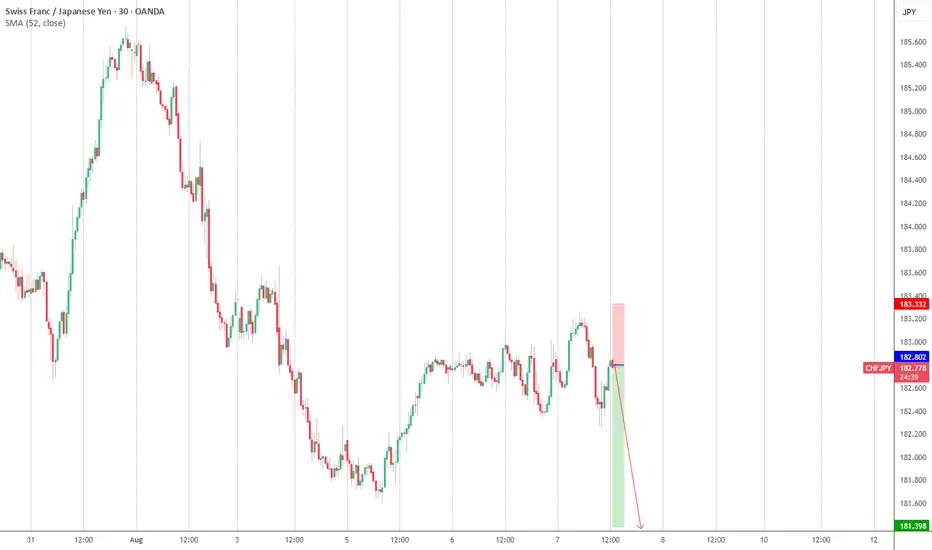
chfjpyI summon the gods of the universe with all their power to make this currency pair crash brutally.
Blessings.
Let´s see in "passiveincomes" at signal start.
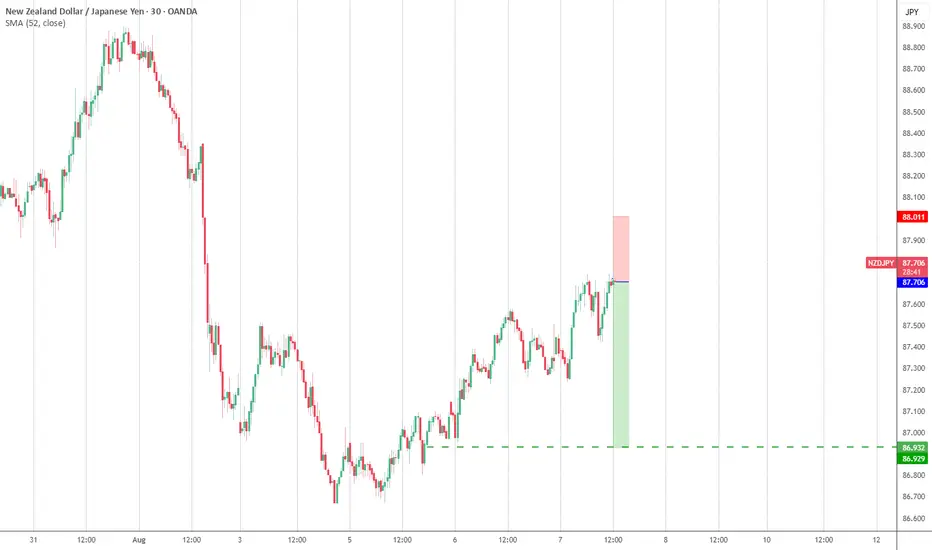
nzdjpyThis pair is confusing people but the true is that it will fall strong.
Let´s go.
Blessings.
"passiveincomes" in signal start.
I see you there.
GBPUSD THE GBPUSD bank rate will be watched for forward guidance ,if they keep rate the same @ 4.25% and the BOE HEAD KEEP HAWKISH RHETORICS WE KEEP BUYING BRITISH POUNDS .
TRADING IS PROBABILTY ,TRADE WITH CAUTION

XAUUSDHaving some SMC tecs counting with, Also with a harmonic pattern present, we'd say that it's time for the trend ends up.

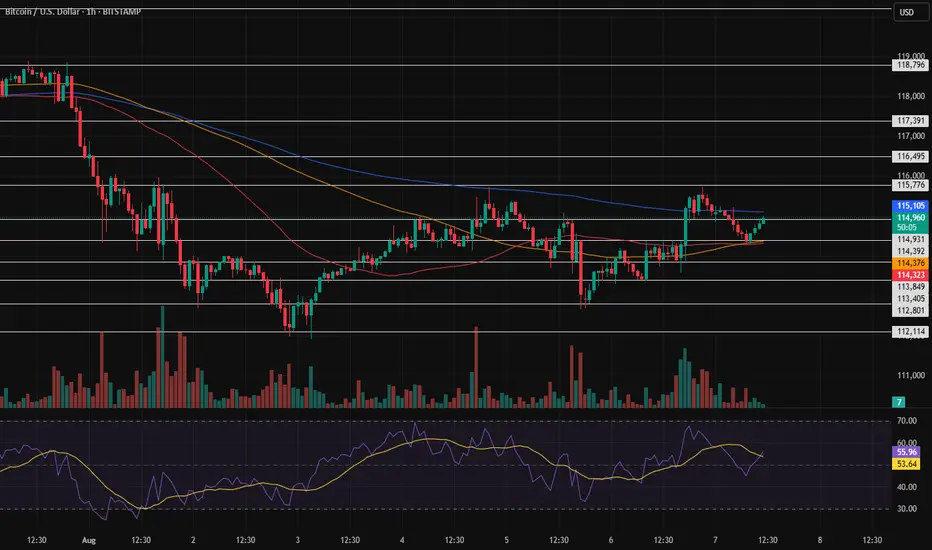
Waiting for confirmation of $114,000According to the previous analysis where we expected the price to reach \$117,000, our outlook still stands. If the price confirms this level and reaches back to 115,800, it indicates a bullish tendency. We need to wait for confirmations from the market.
ENTRY NZDUSDDisclaimer:
This is merely a chart-based analytical trading idea and is not considered investment advice. Please manage your risks carefully and conduct your own research before making any trading decisions.

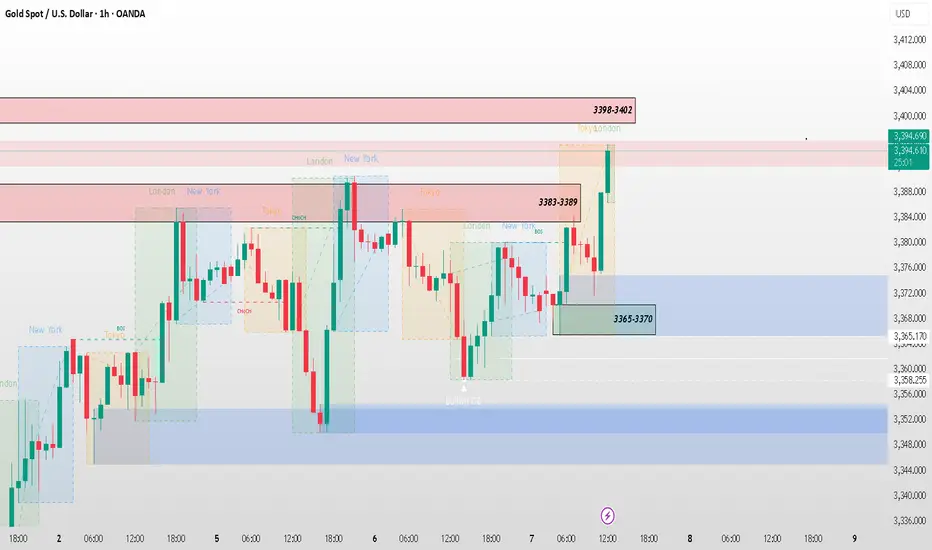
XAU/USD – Smart Money Update (1H)📉 XAU/USD – Smart Money Update (1H)
🔍 Current Structure: Price tapped into 3365–3370 demand and broke above the 3383–3389 supply zone.
🟩 Key Zones:
✅ Intraday Demand: 3365–3370 (recent reaction zone)
🟩 Major Demand: 3344–3354 – deeper support if price retraces
🔼 Next Resistance: 3398–3402
🧠 Smart Money Insight:
Price respected the 3365–3370 demand after taking liquidity and swept above the minor supply (3383–3389). If price holds above 3383, bullish momentum likely toward 3398–3402.
⚠️ Watch for:
Bullish continuation above 3398 for extended upside
Bearish rejection at 3398–3402 if supply kicks in
#XAUUSD #SmartMoney #ForexStrategy #OrderFlow #FXFOREVER #GoldAnalysis #LiquidityZones
3403 is the decision pointAfter the reaction to the price we mentioned, it will become clear whether the price can reach 3432 or not.
XAUUSD on swing high 3402-3410 mark M30-H1 TIMEFRAME SETUP
Currently we have range of 3370-3385 area although if H4 closed above 3385 gold will on bullish Bias till 3405-3410.
What possible scenarios we have ?
• Market has to gives closing of H4 above 3382-3385 ,also I'm on holding buy trade near 3382 and my Targets are 3402-3410.
• secondly If gold drops to my Buying area where I will buy XAUUSD in dips and my optimal target will be 3402-3410.
Additional Tip:
Market is on bullish Bias ,above 3385 no sell Trade .
Below 3375-3378 not buy till 3345.